HAL Id: hal-00174446
https://hal.archives-ouvertes.fr/hal-00174446
Submitted on 24 Sep 2007HAL is a multi-disciplinary open access archive for the deposit and dissemination of sci-entific research documents, whether they are pub-lished or not. The documents may come from teaching and research institutions in France or abroad, or from public or private research centers.
L’archive ouverte pluridisciplinaire HAL, est destinée au dépôt et à la diffusion de documents scientifiques de niveau recherche, publiés ou non, émanant des établissements d’enseignement et de recherche français ou étrangers, des laboratoires publics ou privés.
Concentration effect on the scintillation properties of
Sol-Gel derived LuBO3 doped with Eu3+ and Tb3+.
Christelle Mansuy, Jean-Marie Nedelec, Christophe Dujardin, Rachid Mahiou
To cite this version:
Christelle Mansuy, Jean-Marie Nedelec, Christophe Dujardin, Rachid Mahiou. Concentration effect on the scintillation properties of Sol-Gel derived LuBO3 doped with Eu3+ and Tb3+.. Optical Materials, Elsevier, 2007, 29, pp.697-702. �10.1016/j.optmat.2005.10.017�. �hal-00174446�
1
Concentration effect on the scintillation properties of
Sol-Gel derived LuBO
3doped with Eu
3+and Tb
3+.
C. Mansuy
1, J.M. Nedelec
1*,C. Dujardin
2and
R. Mahiou
11Laboratoire des Matériaux Inorganiques, CNRS UMR 6002, Université Blaise Pascal et
Ecole Nationale Supérieure de Chimie de Clermont-Ferrand, 63177 Aubière cedex, France
2Laboratoire de Physico-Chimie des Matériaux Luminescents, CNRS UMR 5620
Université Claude Bernard, 10 rue A.M. Ampère 69622 Villeurbanne Cedex, France.
* Corresponding author : Dr J.M. Nedelec
Laboratoire des Matériaux Inorganiques UMR 6002 Université Blaise Pascal, 24 Avenue des Landais 63 177 Aubière Cedex, FRANCE
2
Abstract
Lu1-xEuxBO3 and Lu1-xTbxBO3 powders have been prepared by a sol-gel process with
0 < x < 0.15 for Eu3+ and 0 < x < 0.05 for Tb3+. The purity of powders has been verified by
X-Ray diffraction and the results confirm that all the materials have the vaterite type even if the calcination has been performed at 800°C. Furthermore, the solid solution for LuBO3
vaterite is observed up to x=0.15 and x=0.05 for europium and terbium ions respectively. So doping with Eu3+ or Tb3+ ions does not affect the structure. These materials have also been
analyzed by Fourier Transform Infra Red Spectroscopy. The morphology of the powders has been studied by Scanning Electron Microscopy and shows a very nice morphology with small spherical particles with narrow size distribution. Optical properties have then been studied to confirm the effective substitution of Eu3+ or Tb3+ for Lu3+ ions and to determine the materials
scintillation performances. The optima, in term of scintillation yield, are obtained for Eu3+
and Tb3+ concentration of x=0.05 in both cases.The afterglows have also been measured and
confirm the potentiality of these materials as scintillators.
PACS: 78.55.Hx, 81.20. Fw, 29.40.Mc, 73.61.Tm
3
1. Introduction
Nowadays, research directed towards scintillating materials is in constant development. These materials, that convert high energy radiation into UV-Visible light, are used in various applications: medical imaging, high energy physics, airport security and industrial control. The use of these scintillating materials in medical equipment (X-rays, γ-rays, positron emission, ... ) requires improvement of their properties, in particular their conversion yield. Soft chemistry routes and in particular the sol-gel process offer an attractive alternative solution for the production of efficient scintillators with a control of the optical properties.
Rare earth activated lutetium orthoborates, which present a high density due to lutetium, appear to be good scintillators [1,2]. We consequently decided to prepare LuBO3:Eu3+ and
LuBO3:Tb3+ powders by an original sol-gel route. Indeed, the major advantage of this soft
chemistry process is that it allows the control of the morphology and the texture of the materials and also the preparation of the material as thin films [3,4,5]. Moreover, the sol-gel route allows the elaboration of materials of different composition and doped easily with different ions, in various concentration and the sol-gel derived materials are synthesized at lower temperature than the ones elaborated by classical solid state synthesis.
The powders have been characterized using various techniques. The purity and the morphology have been respectively analysed by X-Ray Diffraction (XRD) and Scanning Electron Microscopy (SEM). The scintillation properties of LuBO3:Eu3+ and LuBO3:Tb3+
powders have also been studied.
4 2.1 Powders preparation
LuBO3:Eu3+ and LuBO3:Tb3+ powders have been prepared by a sol-gel process
described elsewhere [6]. In a first step, lutetium and Ln (Ln: Eu or Tb) chlorides are dissolved in required amounts in isopropanol during 2 hours. Rare earth chlorides and solvents used were anhydrous and all the experiments were carried out in an argon inert atmosphere to prevent any influence of air moisture.
Potassium isopropoxide was prepared by reacting metallic potassium (Aldrich) with anhydrous 2-propanol (Accros). After dissolution of chlorides, the solution of potassium isopropoxide is added and then Lu/Ln chlorides mixture is reacted with the potassium alcoholate which substitutes for chloride leading to the formation of the rare earth alkoxides and the immediate precipitation of KCl according to:
LnCl3 + 3 K+ + 3 iOPr- → Ln(iOPr)3 + 3 KCl↓
This mixture was then refluxed for 2h at 85°C, in order to complete the formation of the rare earth alkoxides. Secondly, an alcoholic solution of boron tri-isopropoxide is added. A homogeneous solution is obtained after 4h-reflux at 85°C.
After cooling down at room temperature, centrifugation is performed in order to separate KCl from the sol. The hydrolysis of the sol with distilled water yields a gel, which is dried at 80°C to obtain a white xerogel.
This xerogel is then fired at 800°C for 18h in order to obtain Lu(1-x)LnxBO3 (Ln :Eu or Tb)
crystalline powders. Samples with 0.005 < x < 0.15 and 0.002 < x < 0.05 have been prepared respectively for LuBO3:Eu3+ and LuBO3:Tb3+.
5 2.2 Characterization
All powders have been checked by X-Ray diffraction on a Siemens D501 diffractometer working in the Bragg-Brentano configuration with Cu-Kα radiation (λ =
1.5406 Ǻ).
Infrared spectra were recorded on a Perkin Elmer 2000 FTIR spectrometer using the KBr pellet technique.
Thermogravimetric analysis was performed using a Metler Toledo 851 apparatus. Samples were heated in air with a rate of 1 °C.min-1.
Micrographs were recorded using a Cambridge StereoScan 360 SEM operating at 20 kV. Samples were prepared by depositing a small quantity of powder on adhesive carbon film before coating the surface with gold.
The excitation spectra of all the powders, doped with Eu3+ or Tb3+, were recorded at
room temperature using a Xenon lamp as continuous excitation source and a Triax 320 monochromator coupled with a CCD detector.
The scintillation spectra were recorded with a Jobin-Yvon Triax 320 monochromator coupled with a CCD camera after excitation of the samples with a tungsten X-ray tube working at 35 kV and 15 mA. The signal was collected near the sample with an optical fiber. For relative conversion yield estimation, the samples were placed in a quartz tube with a fixed position throughout the measurements. Commercial polycristalline Gd2O2S:Tb3+
powder supplied by Riedel de Haën was used as a standard for the scintillation yields measurements. The setup was kept constant between the measurements (excitation and detection), simply changing the sample tube. Equivalent masses of samples were used for measurements and all samples were milled in similar conditions in order to keep the granulometry as constant as possible. Reproducibility was tested on the gadox sample yielding values within a 5 % deviation range.
6 The afterglow measurements were performed at room temperature on the samples corresponding to concentration optima. The excitation was performed during 10 s with a X-ray source working at 40 kV and 35 mA. Gd2O2S:Tb3+ powder was used as a reference.
3. Results and discussion
3.1. Characterisation
X-Ray diffraction
Figure 1 presents the X-Ray diffraction patterns recorded for LuBO3 powders heated
at 800°C for 18h and doped with Eu3+ (Fig. 1 a) or Tb3+ (Fig. 1 b) ions. Orthoborate LuBO3
presents two crystalline types depending on the thermal treatment. As mentioned in [7] the vaterite form is obtained at 800°C instead of the calcite form when the material is prepared by solid state reaction. However, all the recorded diffractograms are identical and show exclusively the vaterite form of LuBO3 with no evidence for LuBO3 calcite, EuBO3 or TbBO3
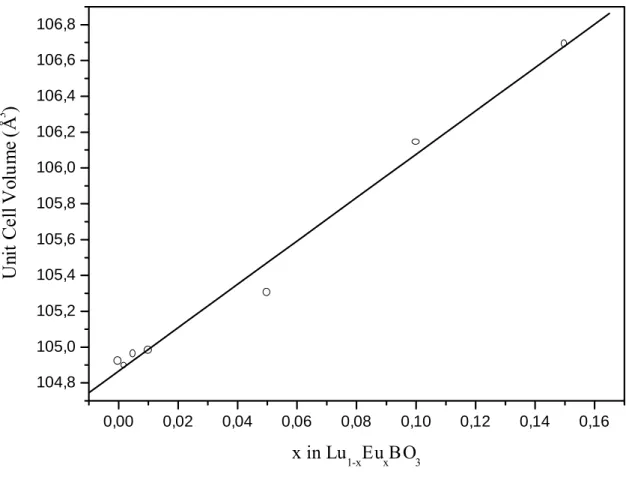
phases. Refinement of powder X-ray diffraction patterns allows deriving the cell parameters for the vaterite phase of LuBO3. Plot of the cell volume as a function of Eu3+ content as
shown in Figure 2, clearly shows a linear evolution as expected from Vegard’s Law for a solid solution. So rare earth ions (Eu3+, Tb3+) substitute for Lu3+ cation in LuBO3 vaterite
structure and the solid solution is observed up to 15% and 5% for respectively europium and terbium ions. Solid solution limits have not been determined and higher concentration might be possible while keeping the vaterite structure and a monophasic material.
7
FTIR Spectroscopy
Fourier transform Infrared spectroscopy has been carried out on the different samples doped with Eu3+ or Tb3+ ions. All recorded spectra, displayed in Figure 3, are similar. No
significant change is observed upon doping with Eu3+ (Figure 3(a)) or Tb3+ (Figure 3(b)) ions.
All the bands observed in the range 500-1200 cm-1 correspond to B-O group vibration modes
and the positions agree well with published results [4,8].
Thermal analysis
The evolution of LuBO3 from the amorphous to crystalline form has been studied by
thermal analysis. This study gives informations on the cristallisation of the material. A thermogravimetric analysis has been carried out on LuBO3 powder elaborated by sol-gel
process and the resulting thermogramm is presented in Figure 4. The first derivative is also shown in order to clearly identify the temperatures associated with the different weight losses.
A first weight loss is observed around 100°C and can be allotted to the elimination of adsorbed species such as alcohol or water molecules. A second significant weight loss, observed at about 150°C, corresponds to the condensation of the material. There is a condensation of the alkoxy and hydroxy groups with subsequent alcohol or water elimination. Some residual organic compounds can also be directly pyrolyzed. At this temperature, the inorganic skeleton is formed. A last weight loss is observed at 700°C and corresponds to the crystallisation temperature. From this temperature, the crystalline growth occurs and no more weight loss is observed. This last loss is characteristic of the mineral network reorganization and of the final elimination of residual OH groupments. Total loss of weight is approximately 17%. Thermal behavior appear very consistent with former results concerning sol-gel derived oxides.
8
Scanning Electron Microscopy
To complete the study, Scanning Electron Microscopy has been performed on vaterite LuBO3 powders synthesized by sol-gel process and treated at 800°C for 18h.
The micrograph recorded at 30 000 x magnification, given in Figure 5, indicate that LuBO3
powders are homogeneous and constituted of small spherical particles of about 200nm. The size distribution of these particles is uniform, which is a usual consequence of using the sol-gel process.
3.2. Excitation and emission spectra
Excitation spectra
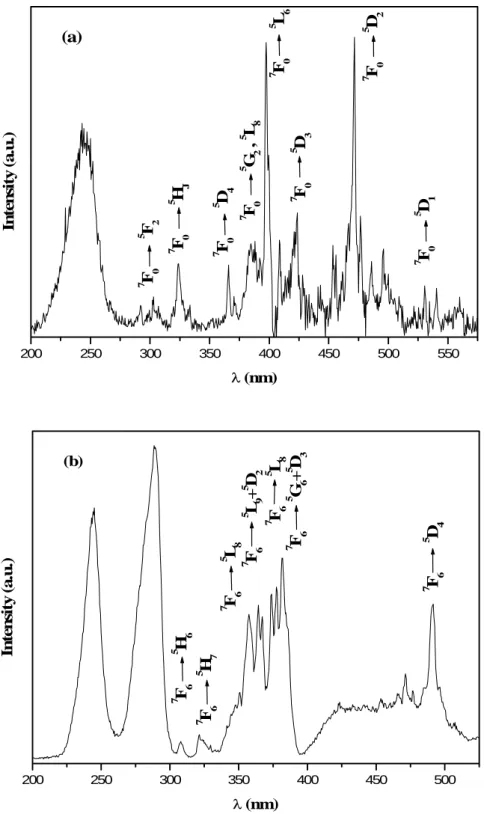
The excitation spectra of LuBO3:Eu3+ and LuBO3:Tb3+ vaterite powders were
recorded for different concentrations of Eu3+ (0.05 < x < 0.15) and Tb3+ (0.002 < x < 0.05).
Figure 6 shows the excitation spectra recorded at room temperature by fixing the emission wavelength at respectively 591nm and 541nm for the optima (Lu0.95Eu0.05BO3 and
Lu0.95Tb0.05BO3).
The excitation spectrum recorded for LuBO3: Eu3+ powder is constituted of lines
corresponding to 4f-4f transitions. The line observed at about 470 nm is attributed to 7F0 → 5D
2 transition and the ones situated in the range between 300-430 nm correspond to 7F0 → 5F
2, 5HJ, 5D4, 5GJ, 5L8, 5L6, 5D3 transitions. The excitation band located below 250 nm is
assigned to the charge transfer absorption [9].
The excitation lines observed for LuBO3:Tb3+ powder, in the range 300-500 nm, are
characteristic of 4f-4f transitions. They correspond to 7F6 → 5H6, 5H7, 5L8, 5L9, 5D2, 5G5, 5L10, 5G
9
Emission spectra
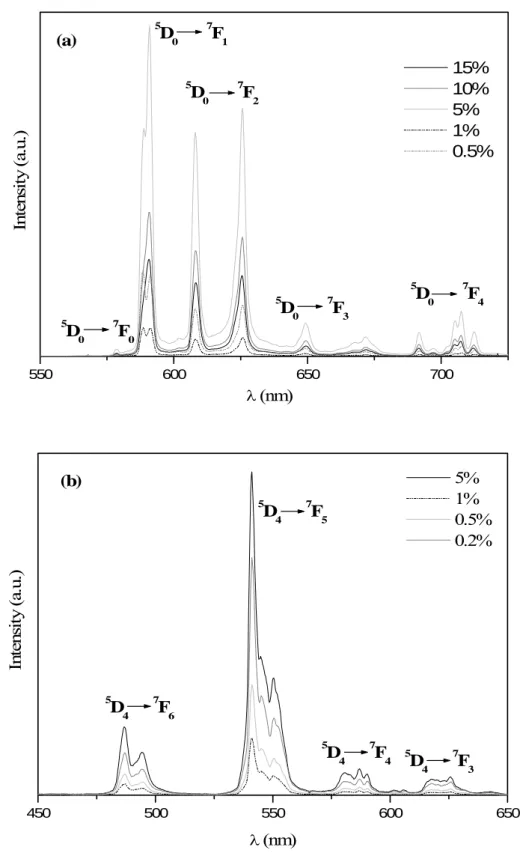
The emission spectra recorded at room temperature under X-ray excitation for Eu3+
and Tb3+ doped LuBO3 vaterite, with different concentrations of Eu3+ and Tb3+, are presented
in Figure 7. Gadox (Gd2O2S:Tb) emission spectrum has also been recorded in order to
calculate the scintillation yields of Eu and Tb doped materials.
In the case of LuBO3:Eu3+ (Fig. 7a), the spectrum is constituted of lines corresponding
to 5D0 → 7FJ (J = 0-4) transitions of Eu3+ ions. The spectral distribution of the Eu3+ doped
materials results in a global orange-red emission.
LuBO3:Tb3+ emission spectrum (Fig. 7b) exhibits, in the range between 475-650 nm,
several lines characteristic of 5D4 → 7FJ (J = 3-6) transitions of Tb3+ ions. 5D4 → 7F5 transition is
the most intense and confers to the materials an overall green emission.
Scintillation yields
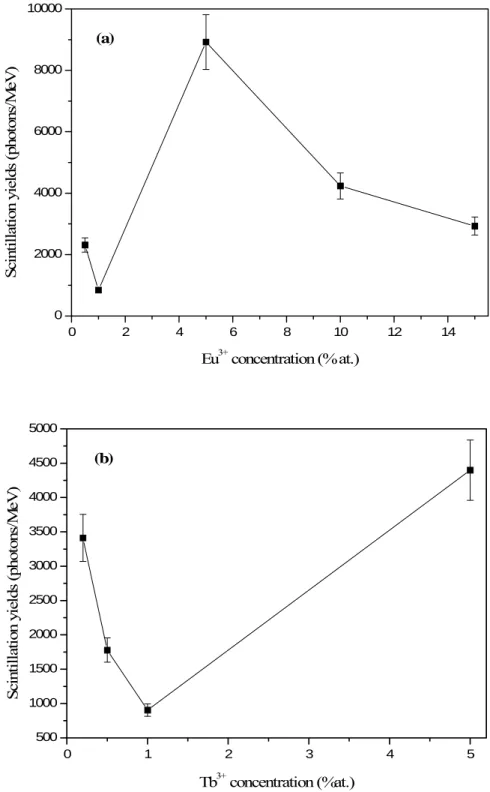
Scintillation yields have been calculated for all the powders by comparing the integrating areas of the emission spectra of the sample and Gadox. Scintillation yields under γ-rays excitation is 78000 photons/Mev [11] for Gadox. The yields of our materials were calculated from reference values, which are obtained under γ-ray excitation. Our measurements have been performed under X-ray excitation, so the results given for the scintillation yields under γ-ray excitation might be under-estimated. Yields have been calculated for concentrations of Eu3+ and Tb3+ ions with respectively 0.005 < x < 0.15 and
0.002 < x < 0.05. The scintillation yields for all the samples and their evolution as a fonction of the doping ion concentration is presented in Figure 8.
10 For Eu3+ doped LuBO3, the optimum is obtained for a Eu concentration of 5% with a
scintillation yield of about 8923 photons/MeV. This scintillation yield is 11% of the Gadox one, which is a good value.
In the case of Tb3+ doped LuBO3 powders, LuBO3:Tb3+ (5%) present the higher
scintillation yield since this one is equal to about 4398 photons/MeV.
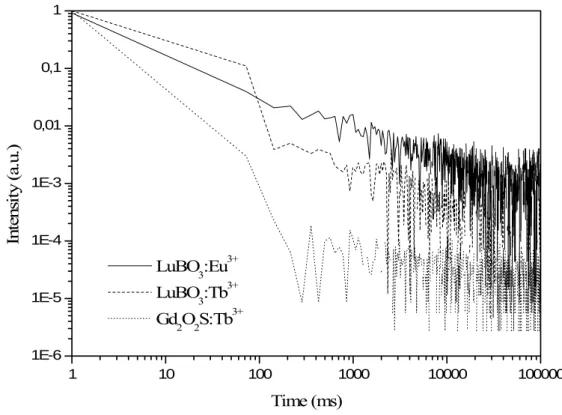
3.3. Afterglow
Precise knowledge of the afterglow is required for practical applications. Afterglow measurements were recorded at room temperature, using an X-Ray source, which operated at 40kV with an intensity of 25mA. The material was excited for 10s and the signal was collected using a photomultiplier.
The afterglow behaviours for Eu3+ and Tb3+ doped LuBO3 powders are presented in
Figure 9. The afterglow of Gadox (Gd2O2S:Tb3+) was also measured as a reference. The
afterglow values, mesured 1 s after X-ray turn-off, are 1%, 0.2% and 0.007% respectively for Lu0.95Eu0.05BO3, Lu0.95Tb0.05BO3 and Gadox.
4. Conclusion
The sol-gel process has been proven to be a good technique for the preparation of scintillating materials doped with different rare earth ions both as powders and thin films. The advantages of this method compared to traditional syntheses are, the lower temperature of treatment, the good crystallinity and purity of the samples, the morphology control and a homogeneous distribution of the particles size.
11 The scintillation properties of Eu3+ and Tb3+ doped LuBO3 powders were studied for
different concentrations of doping ion and good scintillation yields were obtained. Sol-gel derived LuBO3:Eu3+ and LuBO3:Tb3+ appear to be promising scintillators.
Acknowledgements
The authors would like to thanks the French FRT for financial support under project LuminiX (RNTS-01B262).
Figures captions
Figures captions
Figure 1: X-Ray diffraction patterns recorded for (a) Lu0.85Eu0.15BO3 and (b) Lu0.95Tb0.05BO3
with the corresponding ASTM reference patterns (dotted lines)
Figure 2: Evolution of the unit cell volume for Lu1-xEuxBO3 x=0-0.15 as a function of x.
Figure 3: IRTF spectra of (a) LuBO3:Eu3+ and (b) LuBO3:Tb3+ powders of vaterite form
heated at 800°C for 18h
Figure 4: TG curve obtained from LuBO3 powder and first derivative curve (dotted line)
Figure 5: SEM micrographs of LuBO3 samples of vaterite form heated at 800°C for 18h
Figure 6: Excitation spectra of (a) LuBO3:Eu3+ and (b) LuBO3:Tb3+ of vaterite form for
different concentrations of Eu3+ (0.005 < x < 0.15) and Tb3+ (0.002 < x < 0.05) recorded at
respectively λem= 591nm and λem= 541nm and at room temperature
Figure 7: Emission spectra recorded, at room temperature, under X-ray excitation on (a) LuBO3:Eu3+ and (b) LuBO3:Tb3+ of vaterite form, with different concentrations of Eu3+ and
Tb3+ ions.
12 Figure 9: Afterglow measurement on Lu0.95Eu0.05BO3, Lu0.95Tb0.05BO3 and Gadox under
13 10 20 30 40 50 60 70 (b) (a) In te ns ity (a .u .) 2θ (°)
Figure 1: X-Ray diffraction patterns recorded for (a) Lu0.85Eu0.15BO3 and (b) Lu0.95Tb0.05BO3 with the corresponding ASTM reference patterns (dotted lines)
0,00 0,02 0,04 0,06 0,08 0,10 0,12 0,14 0,16 104,8 105,0 105,2 105,4 105,6 105,8 106,0 106,2 106,4 106,6 106,8 U nit C el l V olu m e (Å 3 ) x in Lu1-xEuxBO3
14 1300 1200 1100 1000 900 800 700 600 500 (a) 15% 10% 5% 1% 0.5% 0.2% In te ns ity ( a. u.) Wavenumber (cm-1) 1300 1200 1100 1000 900 800 700 600 500 (b) 5% 1% 0.5% 0.2% undoped In te ns ity ( a.u .) Wavenumber (cm-1)
Figure 3: IRTF spectra of (a) LuBO3:Eu3+ and (b) LuBO3:Tb3+ powders of vaterite form heated at 800°C for 18h
15 10 0 20 0 30 0 40 0 50 0 60 0 70 0 80 0 2 0 2 2 2 4 Temperature (°C) We ig h t l o ss ( m g )
16
2 µm 2 µm
17 200 250 300 350 400 450 500 550 7 F 0 5 D 1 7 F 0 5 F 2 7 F 0 5 H J 7 F 0 5 D 4 7 F 0 5 G 2 , 5 L 8 7 F 0 5 L 6 7 F 0 5 D 3 7 F 0 5 D 2 (a) In te n si ty (a .u .) λ (nm) 200 250 300 350 400 450 500 7 F 6 5 D 4 7 F 6 5 G 6 + 5 D 3 7 F 6 5 L 8 7 F 6 5 L 9 + 5 D 2 7 F 6 5 L 8 7 F 6 5 H 7 7 F 6 5 H 6 (b) In te n sit y ( a .u .) λ (nm)
Figure 6: Excitation spectra of (a) LuBO3:Eu3+ and (b) LuBO3:Tb3+ of vaterite form for different concentrations of Eu3+ (0.005 < x < 0.15) and Tb3+ (0.002 < x < 0.05) recorded at respectively λ
em=
18 550 600 650 700 (a) 5 D 0 7 F 0 5 D0 7F4 5 D0 7F3 5 D 0 7 F 2 5 D0 7F1 In te ns it y (a .u .) λ (nm) 15% 10% 5% 1% 0.5% 450 500 550 600 650 (b) 5 D4 7F3 5 D 4 7 F 4 5 D4 7F5 5 D4 7F6 In te ns it y ( a. u.) λ (nm) 5% 1% 0.5% 0.2%
Figure 7: Emission spectra recorded, at room temperature, under X-ray excitation on (a) LuBO3:Eu3+ and (b) LuBO3:Tb3+ of vaterite form, with different concentrations of Eu3+ and Tb3+ ions.
19 0 2 4 6 8 10 12 14 0 2000 4000 6000 8000 10000 (a) Sc in til la tion yi el ds ( phot ons /M eV ) Eu3+ concentration (% at.) 0 1 2 3 4 5 500 1000 1500 2000 2500 3000 3500 4000 4500 5000 (b) Sc in ti lla tion yi el ds ( ph ot ons /M eV ) Tb3+ concentration (%at.)
20 1 10 100 1000 10000 100000 1E-6 1E-5 1E-4 1E-3 0,01 0,1 1 In te ns it y (a .u .) Time (ms) LuBO3:Eu3+ LuBO3:Tb3+ Gd2O2S:Tb3+
Figure 9: Afterglow measurement on Lu0.95Eu0.05BO3, Lu0.95Tb0.05BO3 and Gadox under X-ray excitation with a 10 s irradiation time.
21
References
[1] L. Zhang, C. Pedrini, C. Madej, C. Dujardin, J.C. Gâcon, B. Moine, I. Kamenskikh, A. Belsky, D.A. Shaw, M.A. MacDonald, P. Mesnard, C. Fouassier, J.C. Van't Spijker and C.E.W. Van Eijk, Radiation Effects and Defects in Solids, 1999, 150(1-4), 439.
[2] W.W.Moses, M.J.Weber, S.E.Derenzo, D.Perry and P.Berdahl, Procceding of the International Conference on Inorganic Scintillators and Their Applications, September 22-25, 1997.
[3] H. Schmidt, M. Mennig, http://www.solgel.com/articles/Default.htm
[4] J.-M. Nedelec, D. Avignant, R. Mahiou, Chem. Mat., 2002, 14, 651.
[5] A. Garcia-Murillo, C. Le Luyer-Urlacher, C. Dujardin, C. Pedrini, J. Mugnier, J. Sol-Gel Sci. Techn., 2003, 26, 957.
[6] D. Boyer, G. Bertrand-Chadeyron, R. Mahiou, L. Lou, A. Brioude, J. Mugnier, Opt. Mater., 2001, 16, 21.
[7] D. Boyer, F. Leroux, G. Bertrand, R. Mahiou, J. Non-Cryst. Solids, 2002, 306, 110.
[8] C.E. Weir, R.A. Schröeder, J. Res. Nat. Bur. Stand., 1964, 68A, 465. G. Chadeyron, M. El-Ghozzi, R. Mahiou, A. Arbus and J. C. Cousseins, J. Solid State Chem., 1997, 128, 261.
22 [9] D. Hreniak, E. Zych, L. Kepinski and W. Strek, J. Phys. Chem. Solids, 2003, 64, 111. [10] M. Zawadzki, D. Hreniak, J. Wrzyszcz, W. Mista, H. Grabowska, O.L. Malta et W. Strek, Chem. Phys., 2003, 291 (3), 275.