Investing in Asian frontier markets:
is the risk worth the return?
Bachelor Project submitted for the degree of
Bachelor of Science HES in International Business Management
by
Cindy MARCHON
Bachelor Project Advisor:
Frédéric RUIZ
Geneva, June 4th 2018
Haute école de gestion de Genève (HEG-GE) International Business Management
Declaration
This Bachelor Project is submitted as part of the final examination requirements of the Haute école de gestion de Genève, for the Bachelor of Science HES-SO in International Business Management.
The student accepts the terms of the confidentiality agreement if one has been signed. The use of any conclusions or recommendations made in the Bachelor Project, with no prejudice to their value, engages neither the responsibility of the author, nor the adviser to the Bachelor Project, nor the jury members nor the HEG.
“I attest that I have personally authored this work without using any sources other than those cited in the bibliography. Furthermore, I have sent the final version of this document for analysis by the plagiarism detection software stipulated by the school and by my adviser”.
Geneva, June 4th 2018
Acknowledgements
I would like to sincerely thank all the lecturers of the International Business Management program of the Haute École de Gestion de Genève for contributing to my experience and transmitting the necessary knowledge needed to understand various areas of business in international environments.
Also, I would like to express my gratitude to all the people who have helped me from a distance or close up in my research, with a particular mention to my advisor, Mr. Frédéric Ruiz, who was also conducting the minor in Finance for International Business, where I learned all the priceless knowledge needed for this study. I thank him for the time he dedicated for me anytime I needed his advice, and for the quality of his teachings.
Finally, I would like to thank my colleagues, family and friends for their support and encouragements.
Executive Summary
Investors are paying increasing attention to frontier markets, as they present the advantage of high returns with potentially diminishing risks in the future and attractive correlation characteristics as globalization unfolds. As the growth of China has slowed down in the past few years, Asian frontier markets are the countries investors turn to expecting rapid economic growth. However, these countries are at their early stage of development, and thus present higher risks than better-known emerging countries. The objective of this research is to determine whether it is worth investing today in Asian frontier markets based on historical data from MSCI indices by comparing risks and returns in individual Asian frontier market MSCI indices, and comparing these results with other frontier, emerging and developed markets. This study also takes into account diversification opportunities, since frontier markets investments are often used as a tool for diversifying investment portfolios.
This research has found that in fact, Asian frontier markets do not consistently provide higher return than other frontier markets, or even emerging and developed ones, but do present higher risks. Even though they are expected to follow China and India’s track, Asian frontier markets do not outperform the MSCI Frontier Markets Index, the MSCI Emerging Markets Index, nor the MSCI World Index. In addition, the volatility and max drawdowns calculated from MSCI indices for Vietnam, Bangladesh and Sri Lanka are larger than that in other indices. This suggests that is isn’t worth investing in Asian frontier markets based on historical data.
However, this study identified reasons for the unexpected outcomes of this analysis. First, this research is based on individual country analysis, and compares with indices that include several countries, which in the case of the MSCI Frontier Markets Index, are very different and uncorrelated to one another, and thus they cancel each other out in the index value. Second, Asian frontier markets are more liquid than other frontier markets, which translates into higher volatility, but doesn’t mean risk is higher in Asian frontier countries than in others.
Despite higher volatility and low returns compared to other indices, Asian frontier markets remain a profitable investment for investors that are ready to commit for the long-run and closely monitor their investments, and for those who are interested in their correlation characteristics to diversify an investment portfolio. Asian frontier countries still present high growth prospects, and deserve a particular attention from foreign investors.
Contents
Investing in Asian frontier markets: is the risk worth the return? ... 1
Declaration... ii
Acknowledgements ... iii
Executive Summary ... iv
Contents... v
List of Tables ... vi
List of Figures ... vi
Introduction ... 1
1. Definitions and context ... 3
1.1 Definition of frontier markets ... 3
1.2 Global benchmarks ... 3
1.3 Asian frontier markets ... 5
1.3.1 Bangladesh development and influences ... 6
1.3.2 Sri Lanka development and influences ... 7
1.3.3 Vietnam development and influences ... 8
1.4 Asian frontier markets: risks and challenges ... 9
1.4.1 Bangladesh: specific risks and challenges ... 11
1.4.2 Sri Lanka: specific risks and challenges ... 13
1.4.3 Vietnam: specific risks and challenges ... 14
1.5 Asian frontier markets: opportunities ... 16
2. Analysis ... 18 2.1 Risk-return analysis ... 18 2.2 Methodology ... 18 2.2.1 Risk measures ... 19 2.2.2 Performance measures ... 20 2.3 Results ... 22
2.3.1 Establishment of the risk level ... 23
2.3.2 Establishment of the performance level ... 31
2.3.3 Risk adjusted performance ... 35
2.4 Correlation and diversification potential ... 40
3. Discussions ... 42
3.1 Risks versus returns ... 42
3.2 Recommendations ... 44
Conclusion... 46
Bibliography ... 47
Appendix 1: Different classifications of frontier countries ... 52
Appendix 2: MSCI Market Classification Criteria ... 53
Appendix 3: Frontier markets total trade volume 2010-2017 ... 54
List of Tables
Table 1 – LIBOR average rates over different periods ... 22
Table 2 – Sharpe ratio table ... 36
Table 3 – Correlation coefficients between the different MSCI indices ... 40
List of Figures
Figure 1 – MSCI Market Classification ... 4Figure 2 – Country weights on the MSCI Frontier Markets Asia Index ... 6
Figure 3 – Historical volatility comparison 2010-2016 ... 23
Figure 4 – Annualized volatility comparison ... 24
Figure 5 – Historical volatility of Asian frontier markets’ returns 2010-2016 ... 25
Figure 6 – Historical drawdown comparative graph between frontier, emerging and developed markets 2010-2017 ... 27
Figure 7 - Historical drawdown comparison between individual Asian frontier countries and the MSCI Frontier Market Index 2010-2017 ... 28
Figure 8 - Evolution of daily returns over 8 years in MSCI Asian frontier markets’ indices in percentage of their initial value as of 01.01.2010 ... 31
Figure 9 - Annualized daily returns comparison of individual Asian frontier markets and other relevant indices ... 32
Figure 10 - Evolution of daily returns over 8 years in all indices in percentage of their initial value as of 01.01.2010 ... 34
Introduction
In a world where money is power, investments play a large role in business. The objective of any investment is to use cash that is otherwise sleeping in the bank to foster future capital growth by placing it. There are many different investments vehicles: stocks, bonds, options, futures, mutual funds, real estate, certificates of deposit, foreign exchange market, and exchange traded funds (ETFs). Stocks – also called equity investments – are part of the most volatile, and thus, part of the highest returning investment vehicles. Investors seek for investments that will maximize their return while minimizing the risk, and they often try to measure how the risks compare to the potential return for each potential investment before placing their money.
Globalization has made international trade easier, and as it unfolds, international markets are flourishing and opening new opportunities to businesses and people, attracting the eyes of ambitious investors. Countries formerly considered as poor, under-developed nations are emerging, and expansion can be fast during this phase of development, which results in high growth rates.
People are familiar with emerging countries and their potential in terms of investments, and now that these economies’ growth is slowing down, investors are trying to find out which countries are the next China and India. Naturally, they turn to economies that are less developed, smaller and/or less liquid, but still have investment potential: frontier markets.
Many investors believe that Asian frontier markets are more susceptible to follow the track of their neighbors – India and China – than others, due to the higher regional pressure and influence. In October 2014, Olivier Bell, Portfolio Manager in T. Rowe Price, wrote that “China has a large effect on many frontier markets in Asia”, and explains that there is a ‘push’ and a ‘pull’ influence, but the overall effect is that China’s growth and development is favorable for Asian frontier markets.
Although these markets offer high growth prospects, and therefore high potential return on investments, they also present higher risks: macroeconomic management, political regression and corruption risks are to be considered, among many others.
This research will focus on Asian frontier countries classified in the Morgan Stanley Capital International (MSCI) Index – the most commonly used frontier market index – which includes: Vietnam, Bangladesh and Sri Lanka. In order to be classified in a given investment universe such as the MSCI Global Investable Market Indexes, markets must
meet some requirements based on qualitative and quantitative measures, which is why there are only 3 countries to analyze.
This report considers the real risk of investing in each of these 3 frontier countries to come to a conclusion answering the following question: is the risk of investing in Asian frontier markets worth the return? It studies each country individually and compares them, to come to a precise recommendation to investors.
To come to such a conclusion, this research will contain 3 main parts, which will be delimited by each chapter. Chapter 1 offers an overview of frontier markets, including a definition of important terms and a point on index classification. It also describes the context of each country based on a brief historic of its development, the challenges it faces and its current state. Chapter 1 also describes the risks and challenges specific to each Asian frontier country as well as the opportunities that they present.
Chapter 2 starts with introducing the tools used to perform the analysis of the market data collected to measure the risks and performance of Asian frontier markets investments, as well as the risk-return balance. It evaluates the level of risk, the level of performance and the risk-adjusted performance of each Asian frontier market, by comparing with the relevant MSCI indices, such as the MSCI Frontier Markets Index, MSCI Emerging Markets Index and MSCI World Index. This analysis ends with a short study on possible correlations between the 3 analyzed markets and the other main indices for frontier markets in general, emerging and developed markets.
The last chapter reviews and interprets the results of the analysis in Chapter 2, taking into account the context described in Chapter 1, and discusses the worthiness of investing in each of the 3 Asian frontier markets. At the end of the chapter, some recommendations are available for investors who intent to invest in Bangladesh, Sri Lanka and/or Vietnam.
Chapter 1
1. Definitions and context
1.1 Definition of frontier markets
There is no universally embraced definition of what constitutes a frontier market. The agreed meaning is that they are markets that are less mature than emerging markets because of characteristics such as demographics, development, politics and liquidity, but they still have investment potential. Thus, we differentiate 3 main types of markets: — Developed markets : the countries that are the most economically advanced. — Emerging markets : the countries that are in the process of rapid economic growth
and development with less mature capital markets.
— Frontier markets : a subset of emerging markets with little market liquidity and lower economic development, but potential for rapid growth. Frontier countries tend to have more volatile and less diverse stock markets, and thus they are higher risk investments, but they have high returns potential as well.
These markets are often in their infancy and have attracted attention due to their diversification opportunities and growth potential. Frontier markets equities have become more and more investable, and this asset class is believed to have the potential to become a significant portion of the global equity opportunity set.
1.2 Global benchmarks
Before any investment decision, investors like to refer to global benchmarks to measure stock market performance. Because the definition of what constitutes a frontier market is not fixed, classification systems vary widely between indexers and benchmarks. There are 4 main frontier markets indices: MSCI, S&P (Standard and Poor), FTSE (Financial Times Stock Exchange) and Russell.1
The most commonly used index is the Morgan Stanley Capital International (MSCI) Frontier Market Index. Under this index, there are criterions that must be met in order
that a country is classified under a certain category (frontier, emerging or developed), based on the MSCI Market Classification Framework.2
Once a country is classified in a category, its classification is reviewed on a timely manner. For instance, Pakistan used to be considered as a frontier market, before it was moved to emerging markets after the June 2017 review, because its characteristics reached the requirements of this category.
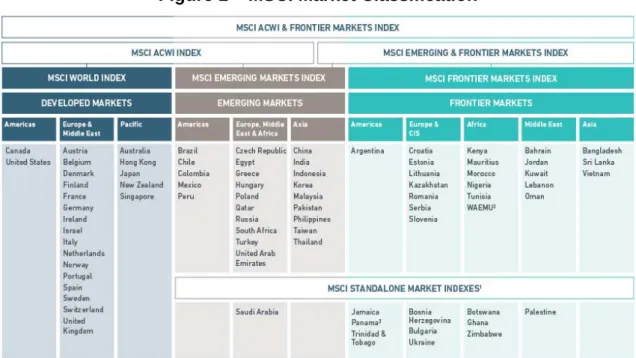
MSCI also segments the markets geographically within each category, which leaves us with the following MSCI Market Classification table (Figure 1):
Figure 1 – MSCI Market Classification
Source: MSCI (2017) The West African Economic and Monetary Union (WAEMU) including 8 countries – Benin, Burkina Faso, Ivory Coast, Guinea-Bissau, Mali, Niger, Senegal and Togo – the index for frontier markets counts 29 countries in total, which are divided into 5 geographical regions: Americas, Europe & Commonwealth of Independent States (CIS), Africa, Middle East and Asia.
1.3 Asian frontier markets
Asia has produced 2 countries that have had a remarkable economic development over the last decades – namely China and India – both of which have lots of influence over other countries in the region. The cultural and geographic proximity of Asian frontier markets to these fast-growing giants makes them more susceptible to follow their track. For instance, the increase of the Chinese and Thai labor and production costs shifts the production facilities of some firms to Asian frontier markets such as Bangladesh or Vietnam. In addition, China has reinforced its relations with South-East Asia by signing the China-ASEAN Free Trade Agreement (CAFTA) in 2005 with the countries of the region, which seeks to strengthen good regional relations and promote exchange and cooperation between China and its neighbors to a new stage. China’s success is mainly due to its ability to attract Foreign Direct Investment (FDI) and to the large-scale capital investment on the part of its government. If South-East Asian countries manage to reproduce this, they are likely to follow China’s track.
India has a large influence in South Asia due to its historical and cultural relevance, its size and its comparative economic might. However, this region is one of the least economically integrated regions in the world, despite a number of free trade arrangements and cooperation agreements: the South Asian Association for Regional Cooperation (SAARC) agreements, the South Asian Preferential Trading Arrangement, and the South Asian Free Trade Arrangement (SAFTA), have failed to break down trade barriers.
There are 3 Asian frontier markets – Vietnam, Bangladesh and Sri Lanka – all of which are influenced by China and India. Because of this influence, many believe that Asian frontier countries are more likely to become the next fast-growing countries, reproducing the growth of China and India. Therefore, this study will focus on these 3 countries, to evaluate risks and opportunities, and whether they are worth investing in today.
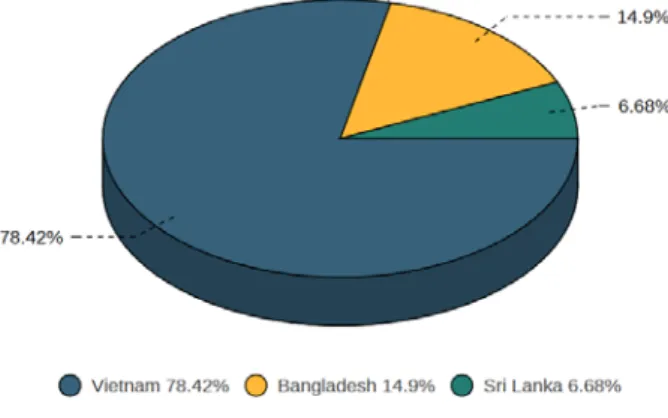
MSCI provides an index for Asian frontier markets called “MSCI Frontier Markets Asia Index”, which presents country weights on its last report dated April 30th 2018 as follows:
Figure 2 – Country weights on the MSCI Frontier Markets Asia Index
as of April 30
th2018
Source: MSCI Frontier Markets Asia Index USD (2018) This graph (Figure 2) shows that 78.4% of the value of the MSCI Frontier Markets Asia Index comes from Vietnamese companies as of April 30th 2018, against 14.9% from
Bangladesh and only 6.68% from Sri Lanka. This suggests that Vietnamese companies either do a lot better than Bangladeshi and Sri Lankan ones (when results are converted in USD), or that they are much more numerous.
The following sections describe the development and influences on Asian frontier countries, to understand the context in which they are evolving.
1.3.1 Bangladesh
development and influences
Before going into the specific risks and opportunities to be found in Bangladesh, it is important to understand where the country stands as of today, and therefore, we need to have a look at its development during the last few decades.
In the early 20th century, Bangladesh was part of British India, which then broke down
into India, West Pakistan and East Pakistan. In 1971, Bangladesh took its independence from Pakistan (the region was the former East Pakistan) after the Bangladesh Liberation War.
Since, the country has made significant progress in its economic sector performance and, especially in the 1990s. Agriculture and garment manufacturing accounts for 90% of Bangladeshi export earnings, and the country relies a lot on these industries. However, due to the global financial crisis of 2012-2013, the demand for low-cost Bangladeshi goods fell sharply.
Today, Bangladesh is still considered as a least development nation, it remains one of the poorest nations in the world and still struggles in South Asia region, despite the economic and social gains of the past few decades.
1.3.2 Sri Lanka development and influences
Sri Lanka took its independence in 1948, after it was colonized for about 150 years by Britain, who developed coffee and tea plantations on the island. A democratic political system was put in place during the British colonization and continued after the British left Sri Lanka.
From 1983 to 2009, Sri Lanka suffered from a Civil War: the Sri Lankan Tamils wanted the independence from Sri Lanka to create the Tamil Eelam, because the Sri Lankan political system was mainly lead by the Sinhalese majority (82% of the population). The government won the war after the military Sri Lankan defeated the Tamil Tigers in May 2009, after a 26-year military campaign. This caused significant hardships for the population, environment and economy of the country.
Sri Lanka still faces many challenges, such as inequality between social groups, a fragile economy due to precarious debt situation, which leads to low public spending and poor-quality services in health and education. Also, the country is highly susceptible to natural hazards and extreme weather, which need lots of resources to absorb the losses they cause and weakens the economic situation of Sri Lanka.
Despite these challenges, Sri Lanka remains in the high human development category (73/188 countries), it is a lower middle-income country, which has been achieving economic growth averaging over 5% in the past decade. Also, the adoption of the Right to Information Act created opportunities for increased transparency, accountability and civic engagement, which can also be of interest for international investors.
Sri Lanka has lots of Indian and Chinese influence: historically and culturally, Sri Lanka and India have been very close, but India failed to intervene in the Sri Lankan Civil War, which hurt the relationship. Since then, China has built ports and highways in Sri Lanka in the light of naval agreements between the two nations, they also have strong
diplomatic and defense ties. In 2015, India has signed a nuclear energy deal to improve relations with Sri Lanka, in order to push back Chinese influence. Today, Sri Lanka’s relationship with India is better, and the country has also lots of influence from China due to diplomatic relations and the growing cultural ties.
1.3.3 Vietnam development and influences
Vietnam was a French colony from 1858 and declared its independence in 1945. The Democratic Republic of Vietnam was recognized by China and USSR in 1950. After the famous Dien Bien Phu battle in 1954, Vietnam was split into North and South at the Geneva conference, which led to the American War in Vietnam. North Vietnamese troops invaded South Vietnam and took control of it, which led to the reconstruction of the country, marked by the new constitution adopted in 1992.
The communist Party remains the leading force in Vietnamese society.
In 1994, the US lifted its 30-year trade embargo and the US-Vietnam diplomatic relations have been restored in full the following year.
In 1995, Vietnam has become a full member of the Association of Southeast Asian Nations (ASEAN), and a member of the World Trade Organization (WTO) in 2007. Vietnam have remarkably developed these past 30 years due to economic and political reforms launched in 1986. The country’s economic growth and development transformed Vietnam from one of the world’s poorest nations to a lower middle-income country: its GDP per capita has been among the fastest in the world. Its fundamental growth drivers are resilient domestic demand and export-oriented manufacturing.
What is interesting about Vietnam’s GDP growth is that it is equitably distributed, which significantly reduced poverty, and improved social outcomes: significant improvements in the provision of basic services – such as education and healthcare – and better access to basic infrastructure (e.g. electricity, sanitation facilities and clean water).
However, the country still faces challenges and limitations: poverty gains are fragile, productivity and labor force growth has been declining over the last 10 years. The country still has some vulnerabilities due to a weak domestic private sector, and improvements to the current urbanization model are needed to foster future growth, as well as significant investments and more productive infrastructure. Sustaining growth will be the real challenge for Vietnam.
1.4 Asian frontier markets: risks and challenges
Even though frontier markets present high growth potential, the development of these countries is slowed down by the many challenges that they face, which can be classified as follows:
— Governance challenges : such as corruption, accounting and disclosure, ownership and conflict of interest, and infrastructure — Environmental challenges : such as climate and extreme weather, pollution and
resource scarcity
— Social factors : such as the lack of consumer protection (i.e. inadequate quality control regulation, and product standards), employee protection (i.e. lack of health and safety standards, insufficient protection of employees against human rights abuses), and protection against the impact of companies’ operations over the communities they operate in. — Institutional factors : such as inadequate regulations, ineffective
mechanisms to ensure contract enforcement and weak capital markets.
Frontier markets usually present higher risks and are facing more challenges than emerging countries. This section explains the specific risks and challenges that Asian frontier markets are facing today.
The risks that can be found in frontier markets can be categorized as follows: Macro-environmental risks:
— Political and economic instability risks — Trading barriers
— Sovereign risks — Sector risks — Commodity risks
— Nationalization of resource risks
Financial risks:
— Currency risks — Liquidity risks — Transaction costs — Data shortage
Macro-environmental risks differ a lot from a country to another, this is why they are discussed for each Asian frontier country separately, further in this section. Financial risks are found in all Asian frontier market, so they will be described below for all 3 countries.
Currency risk : Because frontier markets have a less liquid and deep foreign exchange for their currency, there is a higher currency volatility, which represents a bigger risk. Also, bid-ask spreads are usually wider, and commissions are larger (see “transaction costs”, p. 11) This means that, in order to get in and out of the market, investors will pay a higher cost than in investments in emerging markets, for instance.
Changes in exchange rates can have a large impact on frontier equities’ performance, and investors need to pay attention to it. The currencies to pay attention to are the following:
— Bangladeshi Taka (BDT) for investments in Bangladesh — Sri Lankan Rupee (LKR) for investments in Sri Lanka — Vietnamese Dong (VND) for investments in Vietnam
Liquidity risk : Investors in capital markets need to be able to cease opportunities to buy when they consider the price to be low and sell when they consider it to be high. However, frontier markets’ securities are less liquid because there aren’t so many investors interested in investing their money in these countries due to the risks it represents, and thus the trade volume is relatively low, which makes it harder to enter and exit the market to take advantage of the changes in prices.
This risk concerns more short to medium term investors than long-term ones, and it is what differentiates frontier markets assets the most from mainstream emerging market assets.
Asian frontier markets attract more trade than most frontier markets3, but the level of trade volume remains rather low.
Out of the 3, Vietnam is the one that attracts most trade (3.13% of the MSCI Frontier Markets Index’s total trade volume), followed by Bangladesh (1.62%) and Sri Lanka at the very end (0.80%). This draws the conclusion that the Vietnamese equity market is more liquid than other Asian frontier countries’ equity markets.
Transaction costs : They include the local brokers’ commission and bid-ask spreads for instance, which represent the labor required to make the transaction happen. According to a study realized in 2015 by Marshall, Nguyen and Visaltanachoti, transaction costs tend to be higher in frontier markets than in developed ones – mostly because trading barriers are higher and longer for foreign investors in these countries – which can make short-term investing very unproductive, and can make rebalancing the investment portfolio too often lose the diversification benefits.
These costs need to be taken into account, since they represent a reduction of the overall return on investment, and can diminish the opportunities that frontier markets investing presents.
Data shortage : There is a lack of data for frontier markets in comparison to other, more developed markets due to low trading activity in these countries, the lack of track record (due to short history, since frontier markets are relatively young), the absence of capital markets and the preference to use cash-based accounts.
The consequence is that risk is hard to evaluate precisely.
1.4.1 Bangladesh:
specific risks and challenges
Weak political environmentBangladesh has a weak political environment, which is mainly due to the high terrorism risk the country is facing and the strong polarization between the 2 main political parties: Bangladesh Nationalist Party (BNP) and Bangladesh Awami League.
While both parties strive in favor of democracy, the other ideologies that they defend are very different. For instance, BNP’s ideology is based on Bangladeshi nationalism4, free market economy and for the preservation of the teachings of religion (mainly Islam, but also Hinduism), whereas Awami League’s ideology rests on Bengali nationalism5, secularism – i.e. the freedom of all religions and non-communal politics – and socialism, for the establishment of exploitation-free society and social justice.
4 based on secular, cultural, linguistic identity 5 based on religio-linguistic and cultural identity
There is a high rivalry between the 2 leaders of each political party, which stems partly from differences over who played the greater role in the country’s independence struggle. This causes tensions in the country and on its political system, which represents a risk for foreign investors, because tensions and rivalry could escalate into an internal conflict, especially considering the fact that the country is vulnerable to terrorism risk.
Frequent natural disasters
This country is highly vulnerable to natural disasters, especially to cyclones – 137 events from 1907 to 2004, which affected 63,817,281 people among which 614,112 were killed – and severe floods – 64 events from 1907 to 2004, which affected a total of 369,678,156 people, among which 50,310 died.
In addition to the human cost of natural disasters, these can result in significant loss of harvests and infrastructure damages. This impacts economic performances, and thus presents a risk for foreign investors.
Weak business environment
Bangladesh’s development is being compromised by infrastructure shortcomings and financial weaknesses: Bangladesh ranked 177 out of 190 countries in the World Bank’s Ease of Doing Business Index, with very low position on getting electricity (185), and enforcing contracts (189) for instance.
Also, local and foreign investors are reluctant to invest in Bangladesh due to the large amount of unnecessary bureaucracy and red-tape.
Vulnerable export base
Bangladesh’s export base depends heavily on the garment industry, which represented almost 25% of the country’s exports in 2016. This represents a risk because if the textile industry in Bangladesh suddenly suffers from a large decline due to increasing global competition in this sector, the consequences on the country’s economy could be highly impacted, which would affect equity investments, regardless of the industry (spill-over effect).
1.4.2 Sri Lanka: specific risks and challenges
Ethnic tensionsThe inequality between Sinhalese and Tamils has become wider after the Sri Lankan military defeated the Tamil Tigers at the end of the Sri Lankan Civil War, which causes tensions to remain after the conflict.
These tensions remain a threat to the stability of the country, and thus its growth prospects, because Sri Lankan Tamils are still unhappy with the situation, and there is a risk that another war for independence could occur, or at least other conflicts within the country, which are harming not only the population, but also the country’s environment and economy, which could translate into poor performance of the Sri Lankan stock market as well.
Vulnerable export base
Sri Lanka relies a lot on its textile and clothing industries for exports, which together represent 45% of the export base. This represents a large risk because the country’s economic growth depends on this industry’s performance. An adverse change in the supply and demand dynamics of Sri Lankan textiles and clothes could result in a large drop of the country’s stock market performance, especially considering that there would be a spill-over effect over other industries as well.
Precarious debt situation
The debt to GDP ratio6 of Sri Lanka is 77.6%. This is a very large government debt in comparison to GDP, especially given the level of development of this country: frontier markets usually have a lower level of government debt as they are in development phase, and usually rely more on their internal resources for growth.
As a result, the economy of this country is fragile, and the government tries to reverse this debt, which leads to low public spending and poor-quality of public services such as health and education.
This is a factor reducing growth and diminishing growth prospects for the future, since the labor force will be less skilled in the future due to low quality of education. This is a large challenge for Sri Lanka to overcome, and it could impact the Sri Lankan stock
6 The debt to GDP ratio is a measure that compares government debt and GDP, which
indicates whether a country can produce and sell sufficient goods and services to pay back debts without incurring further debt. The lower it is, the less government debt the country has in comparison to its GDP.
market in a negative way in the next decades. For now, Sri Lanka relies on short-term external financing, while it tries to lower its debt.
Climate disasters
As Sri Lanka is a small island in the Indian Ocean in the path of two monsoons, this country is often affected by weather related hazards, such as floods, tsunamis, droughts and storms. The most common hazards are floods and droughts, because of the monsoonal rain or, in case of drought, failure of monsoonal rain.
Even though tsunamis are not frequent, the 2004 tsunami has highlighted the country’s vulnerability to this type of disasters: two-third of the Sri Lankan coast was affected, and almost 3 million people suffered from this tsunami.
The agricultural production is often largely impacted by these natural disasters, especially floods and droughts, and the direct consequence of this is the need to use lots of resources to absorb the losses as well as the human cost to these disasters, which weakens the country, and its economy.
Climate disasters represent a large risk in Sri Lanka, which can have an adverse effect on the stock market: being able to heal from an injury or eat is more important than market performance. Even though this is an indirect consequence, it can have a large impact on an investment’s performance, this is therefore a risk that must be considered by investors.
1.4.3 Vietnam:
specific risks and challenges
Lack of transparencyTransparency and corruption is a big issue in most frontier markets. Transparency International has ranked Vietnam 107 out of 180 in their Corruption Perception Index (2017), compared to 91/180 for Sri Lanka and 143/180 for Bangladesh.
Even though this is a risk that is not specific in Vietnam, it is one of the largest challenges that the country has difficulty to overcome in order to foster growth. Vietnam is at a more advanced stage of development than most frontier markets, and there was many discussions about whether Vietnam should be reclassified as an emerging market since June 2017. The lack of openness to foreign investors is the main reason for that, but the lack of transparency and of availability of information disclosures in English by local companies have also counted in the decision not to promote Vietnam to an emerging market status.
Corruption and the lack of transparency is a large issue for foreign investors, because it makes the available information questionable at best, and the lack of information makes the market less predictable.
Complicated business environment
The business environment needs improvement in Vietnam, because of infrastructure shortcomings, heavy state involvement and inefficient business registration, tax payment and customs procedures.
These factors are large barriers to the development of businesses, which has an adverse effect on the country’s growth and on its equity market, thus decreasing returns on investments in Vietnam.
Recurrent tensions with China
The sovereignty dispute between China and Vietnam over the China Sea is affecting diplomatic relations between the two countries. Vietnam has started to drill oil in this region in July 2017, and China ended the explorations by threatening to attack the facilities if they were not dismantled. This has revived tensions between the two countries.
War seems unlikely, but China has a large influence on the region, this is why Vietnam needs to keep good relations with its giant neighbor. The escalation of these tensions into an international conflict would be highly detrimental to Vietnam and its economy, which would negatively impact its stock market.
1.5 Asian frontier markets: opportunities
As shown in the previous sections, frontier markets present many risks. However, they still attract the attention of investors, because they present so many opportunities. This section goes through the different opportunities in frontier markets, focusing on Asian frontier countries.
Rapid economic growth prospects
Frontier markets are expected to be the next emerging economies, and therefore, a rapid economic growth is expected from them in the coming years, if they manage to overcome some challenges that they still are facing.
Technological advancements, a strong fiscal position, low labor costs, favorable demographics as well as a large stock of natural resources are typical factors supporting growth in these countries.
For instance, Bangladesh has reduced poverty and hunger in the country of 50% from 2005 to 2016, becoming a role model for eliminating hunger. Now it has shifted its focus towards Sustainable Development Goals (SDG) and intends to achieve them through effective diffusion of Information and Communication Technologies (ICT). Doing that, Bangladesh is facilitating an environment that encourages people to contribute to progress, and thus fostering economic growth of the country through technological advances.
Also, the rising costs of wages in China have made Bangladeshi and Vietnamese labor costs seem particularly low in comparison, and lots of companies have shifted their production from China to Bangladesh and Vietnam to take advantage of the low labor cost. Bangladesh and Vietnam are attracting more and more foreign direct investment, and this contributes to fostering economic growth in Asian frontier countries.
Demographics are also very favorable to economic growth in Asian frontier countries, because they have a young growing population that will contribute to a developing workforce and increased domestic consumption.
This is particularly true for Bangladesh, whose median age is much lower than the world’s median age, with 26 years for Bangladesh’s population versus 30.4 for the world population in 2017.
A large stock of natural resources is also one of the features that can generally be found in frontier markets and that can foster economic growth as well, and Asian frontier countries do have lots of natural resources to rely on. For instance, Sri Lanka has heavy reserves of limestone, graphite, mineral sands, gems, phosphates and clay, which they can use to develop their industries and/or trade to foster further economic growth. Another factor that supports economic growth in frontier markets is their exceptionally low debt burdens in comparison to more developed economies. In Asian frontier markets, Bangladesh has the lowest debt to GDP ratio: in 2017, it was only 27.1%. However, Vietnam and Sri Lanka had a debt to GDP ratio in 2017 of 61.5% and 77.6% respectively, which is rather high for frontier markets (see section 1.4.2 for Sri Lanka’s government debt).
Bangladesh is the only Asian frontier country that really does have a strong fiscal position in comparison with more developed markets. Its debt to GDP ratio is lower than that for China (47.6% in 2017) or India (68.7% in 2017).
Convergence and diversification benefits
Another opportunity in frontier markets is the diversification potential that they present, since they are so different from one another and much less influenced by global economic and political developments than local ones. This results in low correlations to other markets.
Frontier markets are particularly good portfolio diversifiers when combined with other asset classes, to reduce the overall risk of the portfolio.
For Asian frontier markets, it is already rather clear that Vietnam, Bangladesh and Sri Lanka are very different from one another. However, the regional factor makes them more comparable, especially since they are influenced by the same countries in the region, mainly China and India.
Correlation and diversification potential is discussed in section 2.4, to see how correlated Asian frontier markets are with other markets and with each other.
Chapter 2
2. Analysis
2.1 Risk-return analysis
This research aims to compare returns and risks on equity investments in Asian frontier markets. Therefore, this section deals with the computation of performance and risk measures based on the daily stock prices of different MSCI indices, since the MSCI Index is used as the basis of this paper. This analysis is performed on the data collected from the following indices:
— MSCI Bangladesh Index — MSCI Sri Lanka Index
— MSCI Vietnam Index
— MSCI Frontier Markets Index — MSCI Emerging Markets Index — MSCI World Index
The data set contains 2088 daily observations covering a period from 01.01.2010 to 31.12.2017, which represents 8 full years.
As Bangladesh was the last of the 3 current Asian frontier markets to be classified in the MSCI Frontier Markets Index, data on daily stock prices is available for this country only starting in November 2009, which is why the data selected for this analysis starts on January 4th 2010, which is the first published date of 2010.
2.2 Methodology
This quantitative analysis compares risks and returns in Asian frontier markets equity investments, and thus uses different risk and performance ratios to measure them based on calculations on MSCI indices data.
These ratios are used to establish the level of risk and performance of each index. Then, the results for each of Asian frontier countries’ index are used in the analysis to determine whether each country is worthy of investors’ money, whether they impact positively or negatively the MSCI Frontier Markets Index (which includes Asian frontier markets), and whether they are better investments than emerging and developed markets.
To determine that, this research compares the results of each ratio computed from each index, based on the following: volatility of the market, max drawdown over the last 8 years, daily returns as a measure of performance and the Sharpe ratio. Other measures of risks and performance exist – such as the beta (β), the value at risk (VaR) and the
alpha (α) for instance – but this study does not use them due to the lack of data necessary to compute them and the low added-value that they present in the context of this analysis.
2.2.1 Risk
measures
VolatilityThis metric measures the dispersion of returns, which gives investors an idea of the average risk of an investment. Volatility is computed by taking the standard deviation of returns over a certain period. The lower the volatility, the less risky the investment. Here’s how standard deviation is computed:
∑
1
For = Mean of returns = Return at period i = Number of observations
Also, it is important to mention that volatility treats positive and negative risk just the same: a high volatility doesn’t only mean that the index can decrease by so much, it can also go up.
The data collected from MSCI are daily returns. For the analysis to make more sense and to be more straight-forward, measures are computed on an annual basis, which means that volatility must be annualized using the following formula:
∙
For = Number of observations in a full period = Standard deviation over a time period
This study uses daily returns, so T =360, because in banking, it is common practice to use 360 days per year in calculations.
Max drawdown
The max drawdown is a measure of extreme risk, it gives an indication of the maximal historical loss occurred over a given period and is used to compute the “time to recovery” of a stock, which computes how long a stock takes to recover from a drawdown.
This is an important measure, because volatility only deals with the average risk, but in order that investors know what they risk, they also need to consider extreme risks: what is the biggest loss they could have to face if they choose to invest? The max drawdown gives an order of magnitude of the potential maximal loss, based on historical data. It is particularly interesting to look at it when considering frontier market investments, because it can be hard to exit the market when times are bad, due to the illiquid nature of these markets (see “Liquidity risk”, p. 10)
The max drawdown is the minimal historical value of the index as a percentage of the maximal value of the index before the fall.
The data selected for this analysis captures 8 years of historical data (01.01.2010 31.12.2017), thus excluding the financial crisis of 2008.
2.2.2 Performance
measures
ReturnThe return of an investment is the money made or lost on an investment. It can be positive – in which case it is called a gain – or negative – that is called a loss – and it is either expressed as a percentage of the capital invested, or in monetary units.
This research studies the returns on indices in specific stock markets and not a particular investment or investment portfolio, so it makes more sense to look at return as a percentage of the value of each index.
This study uses daily index prices. Therefore, to calculate the daily return on an index, it uses the following formula:
For = Price index level at day D = Price index level at day D-1
As this study also computes annualized volatility based on daily returns, it also needs to annualize returns to make these variables comparable.
1
1
For = Price level of the index at the end of the period = Price level of the index at the beginning of the period = Number of days within the period
Sharpe ratio
The Sharpe ratio is a measure of the efficiency of an investment. It is also called the risk-adjusted performance and computes the excess return generated per unit of risk (volatility). What is called the excess return is the risk-free rate subtracted to the return generated by an investment. It allows to separate the pure performance that is due to taking the risk, excluding the compensation for the time-value of money.
Thus, the Sharpe ratio is computed as follows:
For = Performance of the investment = Risk-free rate
= Standard deviation (volatility)
This study computes ratios on an annual basis, therefore, it will use annualized returns for the performance of the investment and annualized volatility for the standard deviation. The risk free rate is the return obtained from a risk free investment. As no investment is absolutely risk free, it is common practice to use a rate that is as risk free as possible such as a measure of interbank lending rate – such as the LIBOR – or a measure of government interest rates – such as a 6-months treasury bill rate.
MSCI uses the LIBOR rate to compute the Sharpe ratios of its different indices, therefore this study uses the LIBOR rate as the risk free rate as well. The data collected covers a
period from January 1st 2010 to December 31st 2017, and the LIBOR rate has evolved
during this period, so it is necessary to compute the average LIBOR rate.
The Sharpe ratio is computed on different time periods, so this study computes the average LIBOR rate over different periods based on data collected from Bloomberg (LIBOR USD 3 months)7, which are reported on the table below (Table 1):
Table 1 – LIBOR average rates over different periods
1-year average LIBOR (01.01.2017-31.12.2017) : 0.492219641% 3-years average LIBOR (01.01.2015-31.12.2017) : 0.565380104% 5-years average LIBOR (01.01.2013-31.12.2017) : 0.775084097% 8-years average LIBOR (01.01.2010-31.12.2017) : 1.264405616%
Source: author’s calculation on data provided by Bloomberg As this ratio computes the excess return per unit of risk, the higher it is, the better. However, it is rather unlikely that this ratio returns a value higher than 1.5, because risks and returns go together, and generating more than 1.5 unit of excess return per unit of risk sounds too good to be true, especially when looking into equity investments and country indices.
2.3 Results
The objective of this research is to determine whether it is worth investing in Asian frontier markets and to determine which ones present the best opportunities when compared with the risks. This part of the paper presents the results of the quantitative analysis performed on the MSCI data for each index presented in section 2.1.
Firstly, the level of average and extreme risk is assessed by comparing all indices, which allows to establish the risk level of Asian frontier markets.
Secondly, the level of performance is established by performing an analysis on the evolution of returns of each index, and comparing the results between all indices. Finally, performance needs to be compared with the risks to see whether the added risks are worth the returns, and this is done by adjusting the performance to the risk, using the Sharpe ratio.
2.3.1 Establishment of the risk level
In order to establish the level of risk in each country, it is important to consider average risk and extreme risk. In this research, the average risk is measured through the volatility (standard deviation, σ) of the returns of an investment, and the max drawdown is used to assess the extreme risk.
Average Risk:
In this section, it is important to stress that even though the word “risk” has a bad connotation, it refers also to positive risk – the risk that something positive happens – and the standard deviation is blind to the direction that the index takes, whether its value is increasing or decreasing.
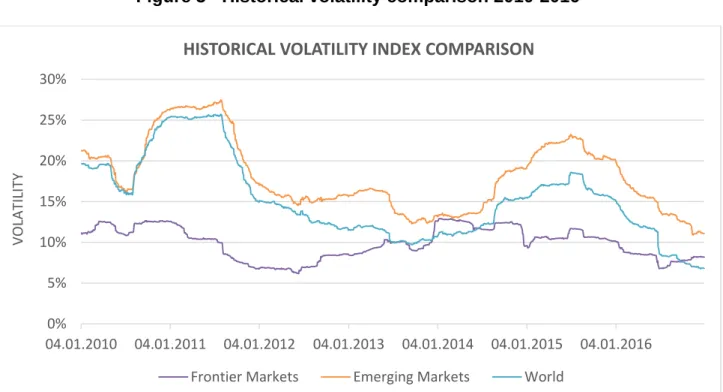
Frontier markets are known among investors to be highly unpredictable, which means that they are perceived as very risky, and this is why most investors hesitate to invest in these markets. However, the following graph (Figure 3) shows a quite steady volatility for frontier markets, whereas emerging and developed markets’ volatility varies more overtime.
Figure 3 - Historical volatility comparison 2010-2016
Source: author’s calculation on data provided by MSCI (daily prices on each index) This can be explained by the fact that there is less investing activity in frontier markets, so the market is calmer and fluctuations are less important in these markets than in more developed and more investable ones.
0% 5% 10% 15% 20% 25% 30% 04.01.2010 04.01.2011 04.01.2012 04.01.2013 04.01.2014 04.01.2015 04.01.2016 VOLATILITY
HISTORICAL VOLATILITY INDEX COMPARISON
This graph (Figure 3) shows a decline in volatility for all indices and a striking correlation between the volatility of returns in emerging and developed markets, frontier markets do not follow the same track. Also, the differential between the largest and lowest values of volatility is larger in emerging and developed markets’ indices than in the frontier markets index. But before drawing such a conclusion, it is important to take a look at annualized volatility of daily returns. This study computes the annualized volatility over the last year, the 3 last years, and the 5 last years and over the whole analyzed period (8 years).
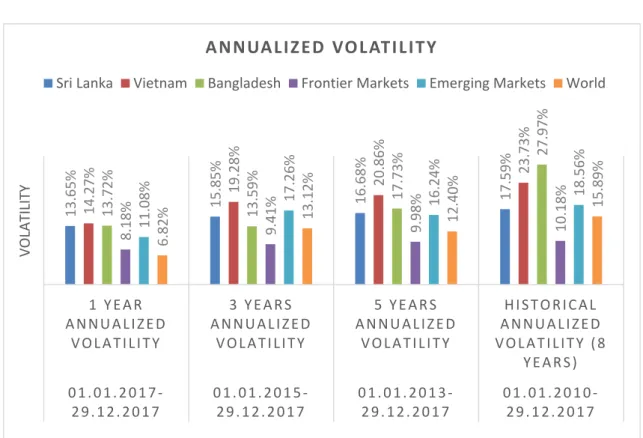
Figure 4 - Annualized volatility comparison
Source: author’s calculation on data provided by MSCI (daily prices on each index) This graph shows the annualized volatility of the returns over different periods. There are few striking things to point out on this graph:
— Emerging markets are more volatile than frontier markets regardless of the analyzed period.
— Asian frontier markets’ volatilities have decreased over time.
— Asian frontier markets are much more volatile than all other indices regardless of the analyzed period.
— Overall, volatilities are declining, and differences between indices are diminishing.
13.65% 14.27% 15.85% 16.68% 17.59% 19.28% 20.86% 23.73% 13.72% 13.59% 17.73% 27.97% 8.18% 11.08% 9.41% 9.98% 10.18% 17.26% 16.24% 18.56% 6.82% 13.12% 12.40% 15.89% 1 Y E A R A N N U A L I Z E D V O L A T I L I T Y 3 Y E A R S A N N U A L I Z E D V O L A T I L I T Y 5 Y E A R S A N N U A L I Z E D V O L A T I L I T Y H I S T O R I C A L A N N U A L I Z E D V O L A T I L I T Y ( 8 Y E A R S ) 0 1 . 0 1 . 2 0 1 7 ‐ 2 9 . 1 2 . 2 0 1 7 0 1 . 0 1 . 2 0 1 5 ‐ 2 9 . 1 2 . 2 0 1 7 0 1 . 0 1 . 2 0 1 3 ‐ 2 9 . 1 2 . 2 0 1 7 0 1 . 0 1 . 2 0 1 0 ‐ 2 9 . 1 2 . 2 0 1 7 VOLATILITY
ANNUALIZED VOLATILITY
The question that is raised by this analysis is the following: how come Asian frontier markets have such a high level of volatility when the general MSCI Frontier Market Index has such a low level of volatility in comparison, even though they are all included in this index as well? The answer is that because frontier markets are different from one another, and are at different stages of development, they do not collaborate so much with neighboring countries (often also frontier markets) in order to develop internally, so they aren’t all impacted as a block when there is a crisis somewhere.
As a result, they are not correlated to one another (see section 2.4 for more information on correlation), which means that when putting all frontier markets together to create the MSCI Frontier Markets Index, the variations of results going in different directions cancel each other out, which results in the volatility being lower. In other words, the cumulated returns of all frontier markets is less volatile than the returns on individual frontier countries’ indices. This can also explain why Figure 3 shows that the frontier markets are less volatile than emerging markets.
This study focuses on Asian frontier markets, and is meant to compare the level of risk and performance in each country, and compare the results among them. Therefore, it is important to zoom in Asian frontier markets and see how volatility has evolved over the last 8 years at a country level.
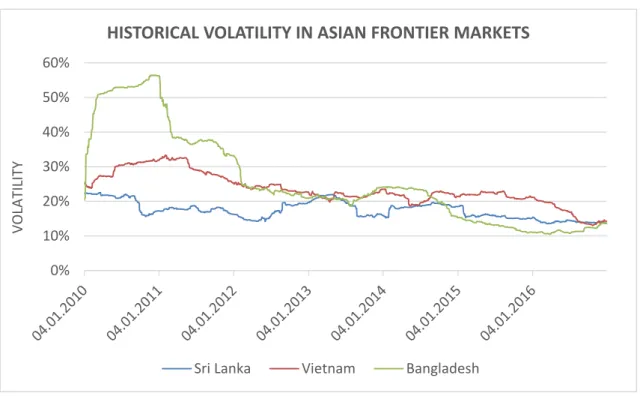
Figure 5 - Historical volatility of Asian frontier markets’ returns 2010-2016
Source: author’s calculation on data provided by MSCI (daily prices on each index) 0% 10% 20% 30% 40% 50% 60% VOLATILITY
HISTORICAL VOLATILITY IN ASIAN FRONTIER MARKETS
This graph (Figure 5) compares the volatility of returns on equity investments in each individual Asian frontier market over the last 8 years. The striking element is that the trend is has been decreasing for all indices, and there seems to be low correlation between these countries (section 2.4 discusses this in more details), as expected when comparing frontier markets. Based on this graph, it is not obvious which country has a higher level of risk based on volatility, so it is essential to study the annualized volatility. Figure 4 reported the volatility of Asian frontier markets’ returns over different periods, and showed that Sri Lanka and Vietnam have had a higher level of annualized volatility than Bangladesh at least from 2012, but over the whole period analyzed (8 years) Bangladesh still shows the highest annualized volatility. In the previous graph (Figure 5), it is clear why: the volatility of returns in Bangladesh rose sharply in 2010 and stayed very high until mid-2012, which means that this very high volatility – the highest in the whole graph – is only accounted for in the 8-year annualized volatility, which explains the large difference between the 8-year and the 5-year annualized volatility.
The conclusion drawn from this part of the analysis is that Asian frontier markets are putting upward pressure on the volatility of the MSCI Frontier Markets Index (i.e. they are more volatile than the average volatility of all frontier markets combined), so Asian frontier markets are more volatile – and thus more risky when considering the average risk – than the average of all frontier markets (including Asian ones).
Extreme Risk:
The max drawdown is the measure that this study uses to assess the extreme risk of investing in Asian frontier markets, and represents the largest historical decline. It is presented in the form of historical drawdown graphs because it is important to not only focus on one large drop, but also see how frequent large declines are and how fast it dropped, as well as how fast indices recover from large declines.
First, this study compares the drawdowns and time to recovery between frontier, emerging and developed markets to situate where frontier markets stand in a worldwide context.
Second, Asian frontier markets historical drawdowns are compared to the average of all frontier markets using the historical drawdown of the MSCI Frontier Markets Index, to see whether they present more or less extreme risks than what is usually expected from frontier markets.
Third, Asian frontier markets are compared to one another, to see which ones present the highest and lowest extreme risks, in order to see which country is the less risky when concluding on the overall level of risk (considering average and extreme risks).
Figure 6 - Historical drawdown comparative graph between frontier,
emerging and developed markets 2010-2017
Source: author’s calculation on data provided by MSCI (daily prices on each index) This graph (Figure 6) shows some correlation between indices: each index experiences a large drawdown at the same time as others, with more or less sensitivity and recovers more of less quickly from it.
For instance, emerging markets’ drawdowns are moving almost all the time in the same direction as that for developed markets, but with a clear added sensitivity: this is particularly visible from mid-2015 to early 2017. Also it is noticeable from this graph that emerging markets need more time than developed ones to recover from large declines. The drawdowns in both emerging and developed markets mid-2012 and early 2016 are showing this quite clearly.
‐40% ‐35% ‐30% ‐25% ‐20% ‐15% ‐10% ‐5% 0% DRAWDOWN %
HISTORICAL DRAWDOWN COMPARISON BETWEEN FRONTIER,
EMERGING AND DEVELOPED MARKETS
As far as frontier markets are concerned, there is visibly less correlation with the two other indices, but they do also suffer from particularly large losses at the same time. Investors tend not to initiate new investments in frontier countries during a financial crisis. The time to recovery seems to be longer as well, and it is particularly noticeable after the drawdown of early 2016.
The max drawdown for frontier markets occurred at the same time as that for emerging markets: the MSCI Frontier Markets Index experienced a drawdown of -33.7% in January 2016, and -35.7% for the MSCI Emerging Markets Index.
Developed markets also faced a large drawdown during that period, but not as substantial as the one from October 2011, when the MSCI World Index experienced a max drawdown of -22.0%.The MSCI Emerging Markets Index has faced the largest drawdown during the past 8 years among the 3 indices, followed by frontier markets and then developed ones.
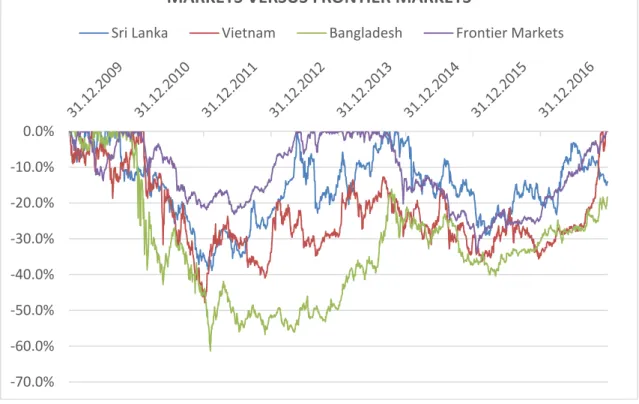
Figure 7 - Historical drawdown comparison between individual
Asian frontier countries and the MSCI Frontier Market Index 2010-2017
Source: author’s calculation on data provided by MSCI (daily prices on each index) ‐70.0% ‐60.0% ‐50.0% ‐40.0% ‐30.0% ‐20.0% ‐10.0% 0.0%
HISTORICAL DRAWDOWN OF INDIVIDUAL ASIAN FRONTIER
MARKETS VERSUS FRONTIER MARKETS
This graph (Figure 7) shows the drawdown in Asian frontier market individual indices as well as with frontier markets, to see whether the extreme risk is higher in Asian frontier markets than in frontier markets in general.
The correlation between the 4 indices compared is less obvious than between frontier, emerging and developed markets, but it is there: there are two noticeable phases where the curves are concaved down, one starting around mid-2011 and finishing around 2013-2014, the other one – which is a bit clearer – starting around the end of 2014 until the end of the graph.
The low correlation is precisely one of the attributes of frontier markets, which is why it makes sense that this graph doesn’t show clear correlation between these 4 indices. Bangladesh : This index has experienced the largest maximum drawdown of all in
January 2012, with a value dropping from 61.4%. Its drawdowns are largely below the ones from the Vietnam and Sri Lanka indices in the beginning of the analyzed period (2010 - mid 2014) and then, it isn’t clear anymore which one of Bangladesh or Vietnam is the most sensitive index until the end of the analyzed period (mid 2014 - 2017). This index takes the longest time to recover, and that, throughout the whole period. The MSCI Bangladesh Index has never managed to recover from the large and sharp decline in the beginning of 2011 throughout the period analyzed, which degenerated into a max drawdown in January 2012. Vietnam : This index experienced its max drawdown of -47.8% in January 2012,
which is a very large drop, but not as significant as Bangladesh’s. The MSCI Vietnam Index has taken a lot of time before finally recovering
from its max drawdown, but it finally managed to recover at the very end of the analyzed period, in November 2017, which means that it took a little bit less than 6 years to recover from this decline.
Sri Lanka : This index experiences drawdowns that are less significant than the two other Asian frontier market indices. The max drawdown for Sri Lanka is -38.9% in January 2012, which is relatively close to the max drawdown of the MSCI Frontier Markets Index (-33.7%).
In addition to apparently being relatively less vulnerable to crises, the MSCI Sri Lanka Index recovers faster than Bangladesh and Vietnam from large declines. It recovered from its max drawdown in May 2013 already, less than a year and a half after the maximum decline the index has experienced during this period.
Overall, Figure 7 shows that Asian frontier markets present more extreme risks than the average of all frontier markets combined (MSCI Frontier Markets Index). The most risky is Bangladesh and the less risky is Sri Lanka.
When it comes to recovering from a large decline, Asian frontier markets seem to take more time that the average of frontier markets, since the MSCI Frontier Market Index shows a recovery from its max drawdown in January 2016 already a little less than 2 years after, and from another large drawdown in June 2012 (-23.1%) in only 11 months. This means that Asian frontier countries are factors increasing the level of risk in the MSCI Frontier Markets Index, and they are overall more risky than other frontier markets when it comes to extreme risks.
Not only do Asian frontier markets present more extreme risks than other frontier markets and also more than emerging and developed markets, this study has also revealed a higher level of volatility (average risk) in Asian frontier markets than in any other indices analyzed in this paper. It is thus natural to conclude that Asian frontier markets are more risky than others based on this analysis.
The question that remains now, is whether the added risk is compensated by an additional return to make it worth investing. In order to answer this question, it is important to consider the performance level of each index, so that we can compare risk and performance later on.
2.3.2 Establishment
of
the performance level
In this section, the analysis starts on the evolution of the indices themselves, by commenting and comparing the movements of the Asian frontier markets’ indices, which helps to shape the context of the next part of this analysis.
Then, the daily returns of all the analyzed indices are annualized and compared over different periods, to establish the level of performance, before comparing the results of this section with those of the previous one (level of risk).
Evolution of the Asian frontier markets indices
This study is done on the performance of MSCI indices of the last 8 years (2010-2017). In order to compare the performance of each Asian frontier markets’ index as of 31.12.2017, it is important to see how it evolved during this period, and thus, to establish the growth as a percentage of the initial value of each index. The initial value is set at 100 for all indices, to allow better comparison.
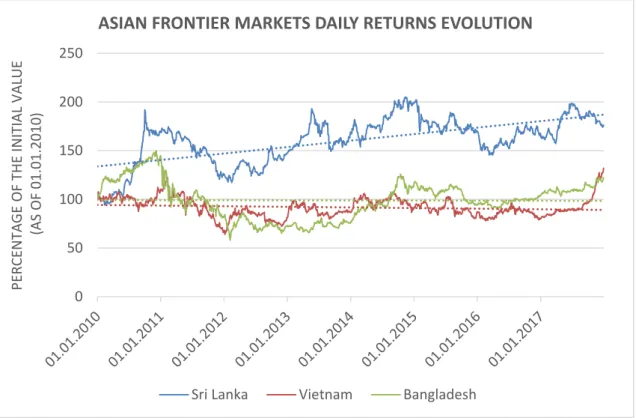
Figure 8 - Evolution of daily returns over 8 years in MSCI Asian frontier
markets’ indices in percentage of their initial value as of 01.01.2010
Source: author’s calculation on data provided by MSCI (daily prices on each index) 0 50 100 150 200 250 PERCENTAGE OF THE INITIAL VALUE (AS OF 01.01.2010)
ASIAN FRONTIER MARKETS DAILY RETURNS EVOLUTION
This graph (Figure 8) shows that investments in Sri Lanka have performed better over the last 8 years than those in Bangladesh and Vietnam, which stagnated a little. However, during the second semester of 2017, the Vietnam index shows a sharp increase, thus overpassing the growth of the Bangladesh index.
Annualized daily returns
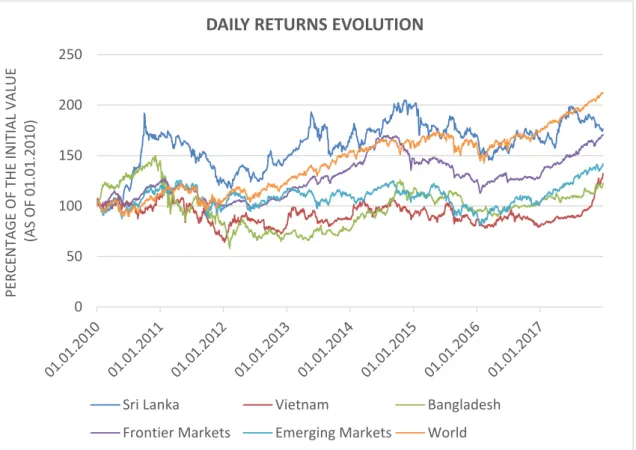
In order to critically analyze the performance level of investments in Asian frontier market, an analysis on the daily returns must be performed, not only on these 3 countries, but also on the average daily returns of all frontier markets combined – using the MSCI Frontier Markets Index – as well as on emerging and developed markets’ performance by using the MSCI Emerging Markets Index and the MSCI World Index.
This data is then used to compare the results from one index to the others, to have a critical view on the level of performance of Asian frontier market equity investments. To perform this analysis, daily returns have been annualized over different time periods, in order to push this analysis further. The graph below shows the annualized daily returns of equity investments in each relevant index, as described above.
Figure 9 - Annualized daily returns comparison of individual Asian frontier
markets and other relevant indices
Source: author’s calculation on data provided by MSCI (daily prices on each index)
7.78% ‐4.01% 3.59% 7.34% 64.86% 12.88% 10.23% 3.54% 17.45% 1.52% 10.97% 2.56% 32.03% 4.96% 9.27% 6.90% 37.35% 9.10% 4.34% 4.47% 22.27% 9.26% 11.64% 9.85% 1 Y E A R R E T U R N 3 Y E A R S A N N U A L I Z E D R E T U R N 5 Y E A R S A N N U A L I Z E D R E T U R N H I S T O R I C A L A N N U A L I Z E D R E T U R N ( 8 Y E A R S ) RETURNS %
ANNUALIZED DAILY RETURNS
The most striking element that comes out when analyzing the results reported on Figure 9 is that returns have wildly increased last year (2017) in all of the indices, especially in Vietnam, which had annualized daily returns of almost 65%. This can be seen on Figure 8 as well.
Sri Lanka : On Figure 8, it shows that Sri Lanka had the best evolution in the past 8 years among Asian frontier markets. However, on Figure 9, it is clear that investments in Sri Lanka haven’t had the best returns over the last 5 years, and that its current high level over Vietnam and Bangladesh shown on Figure 8 is mainly due to a sharp increase in the returns during 2010, which brings the historical annualized return (8 years) of Sri Lanka at a rate of 7.34%.
In other words, high daily returns on equity investments in Sri Lanka had their time in 2010, but since then, returns have been rather disappointing, even though the trend is bullish (as shown on Figure 8). Vietnam : When it comes to Vietnam, on Figure 8, the trend line is rather constant,
so it is interesting to see that annualized daily returns have been largely positive for the last 5 years when computing the annualized returns. However, when comparing Figure 8 with the results reported on Figure 9 for Vietnam, it is clear that the annualized returns over 5 years and 3 years is positive because of the sharp increase in returns in the second semester of 2017.
Vietnam hasn’t been returning much from 2010 to mid-2017, but returns are increasing in the last part of the graph, and this trend could be expected continue its way up.
Bangladesh : The MSCI Bangladesh Index also has a constant trend line over the last 8 years. It has a historical annualized return (8 years) of 2.56%, which indicates that from its value as of 01.01.2010, the index has barely gained anything. It has experienced a sharp decline from end of 2010 to early 2012, but since then, returns have been rather constant, with a slight improvement in the last year (2017), bringing annualized returns of 17.45%.