Publisher’s version / Version de l'éditeur:
Vous avez des questions? Nous pouvons vous aider. Pour communiquer directement avec un auteur, consultez la
première page de la revue dans laquelle son article a été publié afin de trouver ses coordonnées. Si vous n’arrivez
Questions? Contact the NRC Publications Archive team at
[email protected]. If you wish to email the authors directly, please see the first page of the publication for their contact information.
https://publications-cnrc.canada.ca/fra/droits
L’accès à ce site Web et l’utilisation de son contenu sont assujettis aux conditions présentées dans le site LISEZ CES CONDITIONS ATTENTIVEMENT AVANT D’UTILISER CE SITE WEB.
Structures Congress 2020, pp. 206-217, 2020-04-02
READ THESE TERMS AND CONDITIONS CAREFULLY BEFORE USING THIS WEBSITE. https://nrc-publications.canada.ca/eng/copyright
NRC Publications Archive Record / Notice des Archives des publications du CNRC : https://nrc-publications.canada.ca/eng/view/object/?id=f168068f-d879-49f8-a7ee-d254e5ed239f https://publications-cnrc.canada.ca/fra/voir/objet/?id=f168068f-d879-49f8-a7ee-d254e5ed239f
Archives des publications du CNRC
This publication could be one of several versions: author’s original, accepted manuscript or the publisher’s version. / La version de cette publication peut être l’une des suivantes : la version prépublication de l’auteur, la version acceptée du manuscrit ou la version de l’éditeur.
For the publisher’s version, please access the DOI link below./ Pour consulter la version de l’éditeur, utilisez le lien DOI ci-dessous.
https://doi.org/10.1061/9780784482896.020
Access and use of this website and the material on it are subject to the Terms and Conditions set forth at
Extreme load effects on structural performance of box girder bridges Mohammed, Amina; Almansour, Husham
Extreme Load Effects on Structural Performance of Box Girder Bridges
Amina Mohammed, Ph.D., P.Eng.1; and Husham Almansour, Ph.D., P.Eng.2 1Research Associate, Civil Engineering Infrastructure, National Research Council Canada,
Ottawa, ON, Canada. E-mail: [email protected]
2Senior Research Officer, Civil Engineering Infrastructure, National Research Council Canada,
Ottawa, ON, Canada; Professor, Univ. of Ottawa and Univ. of Toronto. E-mail: [email protected]
ABSTRACT
Potential continuation or acceleration of climate change could increase the risk of failure of critical bridge components or bridge systems. This paper present preliminary results of ongoing study investigating the impact of extreme climate loads, on the safety and serviceability of a curved-continue composite box-girders bridge. A four-span curved box-girder bridge was designed according to the Canadian Highway Bridge Design Code and simulated by a 3D nonlinear finite element model. The bridge is investigated for the effect of different levels of temperature and ice accretion combined with other gravity loads. The results show significant increases in the moments, high levels of stresses, and very large increase of longitudinal and vertical displacements at critical sections of the bridge superstructure. More research
investigations are required to further investigate the safety of the bridge elements, connections, and the integrity of the bridge system.
BACKGROUND
Climate change is a major challenge facing core public infrastructure in many countries, with expected increases in temperature and precipitation, changes in wind patterns, and increase in frequency and severity of extreme weather events such as heat waves, storms, and floods. The expected continuation or acceleration of climate change threaten the integrity and robustness of transportation infrastructure.
In this context, bridges, which are the most critical links of surface transportation
infrastructure, could be more vulnerable to extreme climate loads that could dramatically vary over short term and long terms. It has always been observed that bridge performance is highly affected by the weather (Nemry and Demirel 2013; Wang et al. 2010). Tong et al. (2001)
investigated the temperature distribution in steel bridges and highlighted that steel bridges might undergo significant temperature changes under the combined influence of solar radiation, daily air temperature variation, and wind speeds. Liu and DeWolf (2003) reported that the global temperature changes the natural vibration frequencies by affecting the stiffness of bridges. In their study, specific mechanisms were proposed to explain the reasons behind this phenomenon, such as: (i)Young’s modulus of concrete decreases with increasing temperatures, (ii) boundary conditions change due to temperature variation, and (iii) changes in the bridge deck asphalt layer when the temperature changes. They recommended additional research to gain a further
understanding of how changes structural stiffness are related to temperature variations so that this information can be incorporated into the bridge elements damage models.
Ervik and Fikke (1982a) claimed that the following weather parameters are significant for icing to occur and/or for the rate of growth of ice deposits: temperature, humidity, water content in liquid state in the air, distribution of droplet size, wind speed and direction, and precipitation.
However, it is not practical to obtain all necessary data on ice loading by direct measurements (Ervik and Fikke, 1982a). Knowledge gaps in the mechanical behavior of ice covers under loads, and effects of ice cover thickness and layering on bearing capacity of bridge performance are addressed (Ervik and Fikke 1982b).
Composite steel box girder bridges have become an effective alternative to more
conventional plate girder-and prestressed concrete girder bridges in North America in the past three decades. Although, this type of bridges has several advantages including high torsional rigidity and high vertical clearance, they could be highly affected by extreme climate loads. For instance, the high temperature variations, extreme temperatures, and ice accretion can seriously affect this type of bridge’s performance, specifically for curved long multi-span ones. The objective of this paper is to investigate the impact of extreme climate loads such as ambient temperatures, very high thermal gradients, and ice accretion on the safety and serviceability of a curved continuous composite box-girder bridge. The investigation is aimed at the development of a 3D nonlinear finite element model of a curved continuous box-girders bridge where the design is performed according to the Canadian Highway Bridge Design Code CHBDC, (CSA 2014). The focus is on investigating the structural performance of bridge superstructure of such bridges when subjected to different levels of temperature and ice accretion loads combined wit h other loads.
IMPACT OF EXTREME LOADS DUE TO CLIMATE CHANGES ON BRIDGES PERFORMANCE
Bridges could be significantly impacted by climate changes, mainly through the increase in the average temperatures, and increases in the temperature extremes such as during hot and cold days. Climate change could also be correlated to the observed increase in the frequency and the magnitude of extreme climatic events, and hence, resulting in a rise of extreme climatic loads on bridges (Wang et al. 2010). The changes in ambient and differential temperatures may lead to significant changes in the structural response of the bridges’ components and structural systems in terms of large deformations and high-stress levels that could exceed those levels allowed by existing design codes. Such effects could impact the structural integrity of the bridge system, for example, substantial differential temperature could result in damaging the composite action between the slab and the steel box-girders. The overall bridge deformations due to significant changes in the thermal stresses are induced due to the variations either in the temperature gradient over the cross-section or high changes in the overall extension due to uniform temperature (ambient temperature). Such thermal loading influences the design of the bridge structural elements and joints. Failure to allow effects like repeated cycles of heating and cooling may magnify the distress in various parts of the bridge (Tong et al. 2001). For instance, the elevated ambient temperature could severely damage the expansion joints and affects their functionality (Chang and Lee 2001).
Snow load has been referenced in literature for structures and specifically for roofing, the load would differ when considering bridges, where distribution of snow and ice loads may have significant effects on bridges performance. It is reported that potential bridge impacts are more frequent use of snowplows and de-icing measures, which may accelerate wearing of the road surface, and cause traffic delays or bridge closures. In the CHBDC Design Code (CSA 2014), ice thickness is based on anticipated freezing precipitation amount for a 20-year return period.
MODELING THE BRIDGE STRUCTURE
Bridge design codes permit the use of the finite element method for structural analysis of short and medium span bridges. The finite element model (FEM) for the bridge of this study is created using a commercial software (CSiBridge 2019), which is an integrated tool for
modelling, analysis, and design of bridge structures following different codes and specifications such as AASHTO and CHBDC among others. Using the software, a model is developed using thin shell elements for box-girders and deck components. The bridge structure is first discretized by the segment length along the longitudinal direction, and then the mesh size is established accordingly in the longitudinal and the transverse directions. A three dimensional (3D) finite element model (FEM) of the bridge is then fully generated using shell elements. The shell element is a three-dimensional element with either three or four-nodes, where each node has six degrees of freedom: three displacements (U1,U2, U3), and three rotations (φ1, φ2, φ3). In the 3D model, the vehicular traffic direction is along the X-axis of the bridge, while the Y-axis and Z-axis represent the bridge transverse direction (normal to the traffic direction), and the vertical (or the gravity) direction, respectively. The materials are assumed to be homogenous and isotropic. Cracking of the bridge’s deck is ignored, and the girders and the slab are assumed to act
compositely.
MODELING THE EFFECTS OF LOADS
To evaluate the bridge structural response when subjected to different loads including dead loads, the Canadian Highway Bridge Design truck loading (CHBDC truck CL-625) and lane loading are considered. Dead loads are comprised of the self-weight of the bridge structure, the pavement surface and side-walks. The live load on a bridge is the result of vehicular traffic. In this particular study, temperature loads and ice accretion are also considered in the nonlinear static and dynamic analysis of bridge structural systems.
The temperature loads are studied through two loading cases as: (i) combined with only dead load (no other loads); or (ii) acting together with other gravity loads according to CHBDC load combinations. The bridge is assumed to experience ample changes in climate loads where the ambient temperature could reach or exceeds -45ºC (coldest recorded temperature), and reached +30ºC (hottest recorded temperature).
The thermal loading is applied as a load case and is considered in two different cases: (i) ambient temperature and (ii) thermal gradients. The ambient temperature is applied on bridges as a uniform load on all the bridge elements, while the temperature gradient is applied over the bridge section. Temperature load (ambient or gradient) is combined with dead and live loads in the relevant load combination(s) of CHBDC S6-14 (CSA 2014). The load combinations for serviceability and ultimate limit states SLS and ULS of CAS 2014 are: (i) SLS Combination = 1.0 Dead Load + 0.9 Live Load; (ii) ULS Combination 1 = 1.2 Dead Load + 1.7 Live Load; and (iii) ULS Combination 2 = 1.2 Dead Load + 1.6 Live Load + 1.15 Thermal Load.
Available literature on identifying and describing the distribution of snow and ice loads on bridges is limited. Henceforward, with the increasing frequency and magnitude of extreme ice/snow storms, it is essential to investigate whether the operation approaches of clearing the ice/snow after a major winter storm would affect bridge performance in terms of safety and serviceability. Most of snow/ice removing approaches involve accumulating the ice/snow on the bridge (or road) side, which result in closing a sidewalk and possibly closing the adjacent lane, partially or fully. Therefore, in case of considering ice accretion as an extreme load that bridges
are subjected to, three cases of ice accretion load are considered: (i) ice load accumulated on exterior side of the bridge; (ii) ice load accumulated on interior side of the bridge; and (iii) the ice load accumulated on both sides of the bridge (exterior and interior sides). In the three cases of loading, the bridge dead load is included.
In order to verify the effectiveness of the FEM and to ensure the model suitability in performing the structural analysis when the bridge is subjected to thermal loading or ice accretion, the bridge is considered to act under dead load only, and then the thermal loading or the ice accretion is applied. Dead and live loads are defined in the software in accordance with CHBDC. Dead loads consist of the self-weight of bridge components (deck and girders) as well as superimposed loads (asphalt, barriers, rails, etc.). The live load consists of CL625 Trucks or lane loads.
CASE STUDY: RESULTS AND DISCUSSION
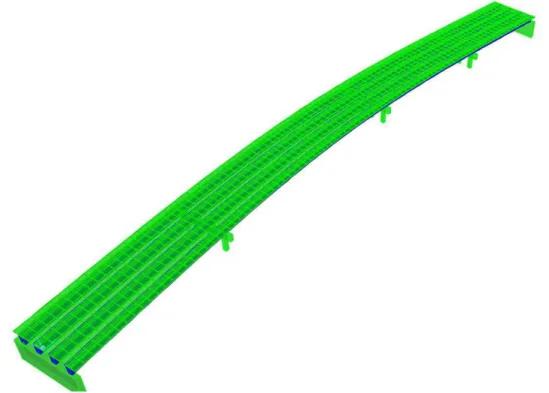
A 4-span, curved-continuous composite box girder bridge with span lengths equal to 60 m, 90 m, 60 m and 45 m is considered. The platform width is 23.75 m, which accommodates five lanes for a CL-625 Truck, where each lane is 4.75m wide. The superstructure consists of four steel U-girders integrated with a 0.25 m thick reinforced concrete slab. The girders are spaced at 5.45m c/c; .The girder dimensions are shown in Table 1. The substructure is assumed to be consisted of two abutments at both ends of the bridge and three interior piers (a beam cap resting on four columns), as shown in Figure 1.
Figure 1: The curved-continuous composite box-girders bridge. Impact of ambient temperatures on the bridge structural performance
Figure 2 shows the deformed shape of the bridge superstructure due to dead load only with maximum central deflection of 120 mm. Figure 3 shows the deformed shape of the bridge under dead load and ambient temperature of +30ºC with maximum defection equal to 130 mm at the
central span and longitudinal expansion of 36 mm at both end sides of the bridge. However, if the bridge is located in cold region (where the temperature may reach -45ºC), the bridge
deformed shape is slightly different where the maximum central deflection is 160 mm, and both end sides of the bridge moved longitudinally from their original position by 87 mm, see Figure 4.
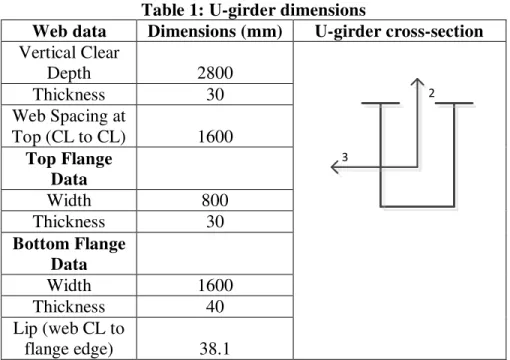
Table 1: U-girder dimensions
Web data Dimensions (mm) U-girder cross-section
Vertical Clear Depth 2800 2 3 Thickness 30 Web Spacing at Top (CL to CL) 1600 Top Flange Data Width 800 Thickness 30 Bottom Flange Data Width 1600 Thickness 40 Lip (web CL to flange edge) 38.1
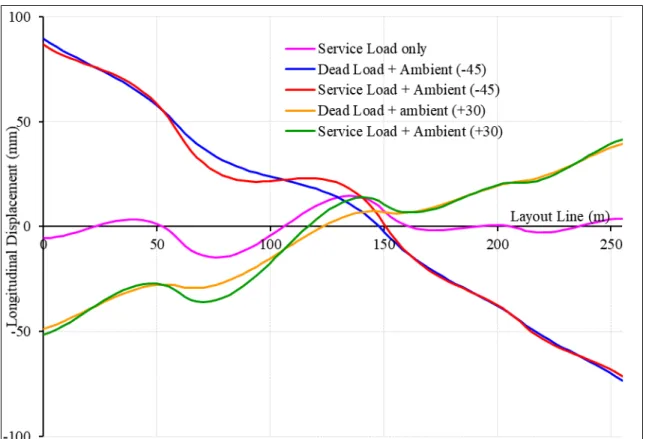
Figure 5 shows the longitudinal displacements of the web bottom of the interior and the exterior box girders along the bridge length due different load cases. The absolute value of the longitudinal displacements at both ends of the bridge increased compared to the correlated displacements of the bridge subjected to only service loads (dead and moving truck loads) which are close to zero. The absolute value of the longitudinal displacements are increased by 87 mm in the coldest region (-45 ºC) and decreased by 50 mm in the hottest region (+30 ºC).
Figure 2: Deformed shape of the bridge superstructure (mm) under dead load only.
Figure 3: Deformed shape of the bridge superstructure (mm) under dead load and temperature load (+30ºC).
Figure 4: Deformed shape of the bridge superstructure (mm) under dead load and temperature load (-45ºC).
Impact of nonlinear thermal gradients on the bridge structural performance
The thermal gradient is modelled as a piecewise linear gradient with up to four linear
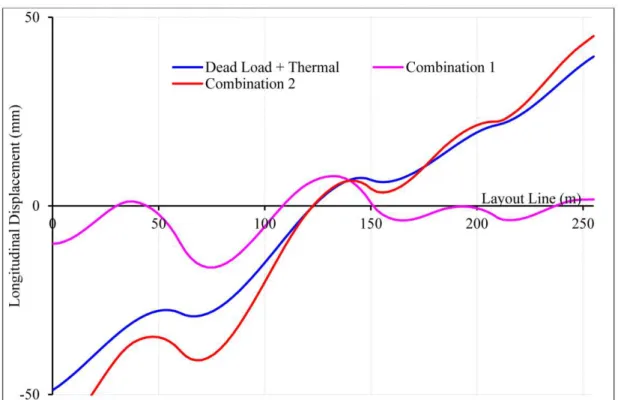
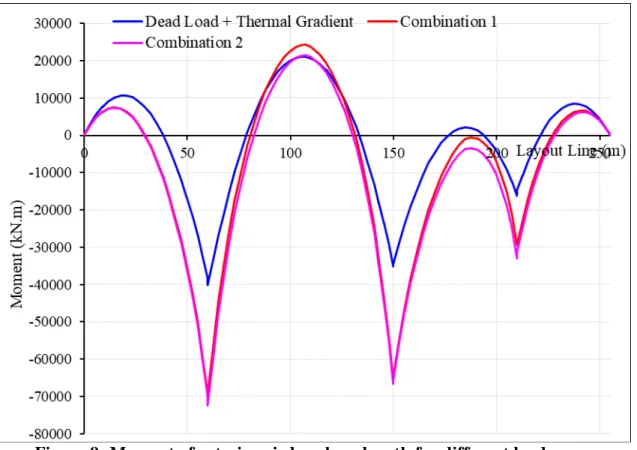
segments (CSi Bridge 2019) as shown in Figure 6. The following three load cases are considered where the bridge is either under: (i) thermal gradient load combined with dead load; or (ii) ULS combination1 (Combination1); or (iii) ULS combination 2 (Combination 2). In each load combination, the thermal gradient is applied as five linear segments ranged in-between 30ºC, 25ºC, 20ºC, and 15ºC. Figure 7 shows the deformed shape of the bridge superstructure due to the thermal gradient combined with dead load where the maximum vertical displacement is equal to 130.0 mm, and both ends of the bridge are shifted horizontally by 48.0 mm, Figures 8 shows the longitudinal displacement of the exterior girder along the bridge length for different load cases. The maximum moment caused by the thermal gradient and dead load is relatively low (40,000 kN.m) compared to the maximum moment resulting from the load combinations 1 and 2. It is observed that load combination 2 (1.2 Dead Load + 1.6 Live Load + 1.15 Thermal Load)
compared to load combination 1 (1.2 Dead Load + 1.7 Live Load) shows an increase in the absolute value of maximum negative moment over the interior supports of 43 % (see Figure 9). This increase reflects the impact of the thermal gradient on the critical moments.
Figure 5: Longitudinal displacements of interior and exterior girders of web bottom along length due to dead and ambient temperature loads.
Figure 6: Piecewise linear gradient with four linear segments (CSi Bridge 2019).
Impact of different distribution of ice accretion on the bridge structural performance
Figure 10 shows the deformed shape of the bridge superstructure under dead load and ice load accumulated on one side of the bridge (either the exterior side or the interior side) where the deformation ranged between 17 mm and 238 mm; however, in the case of the ice load
accumulated in both sides of the bridge (exterior and interior sides), the deformation ranged
between 26 mm and 364 mm (Figure 11). It is observed that the deformation patterns are slightly similar where the mid-central zone is wider in case of the ice load accumulated on one side only. This could result in (i) increased stresses (or forces) at the exterior girder up to a critical level; (ii) increases of the movements over the interior piers beyond the allowable ranges; and (iii) increase the displacement in the expansion joints beyond the acceptable values.
Figure 7: Deformed shape of bridge superstructure (mm) under dead load and thermal gradient.
Figure 8: Longitudinal displacement of exterior girder along the length for different load cases.
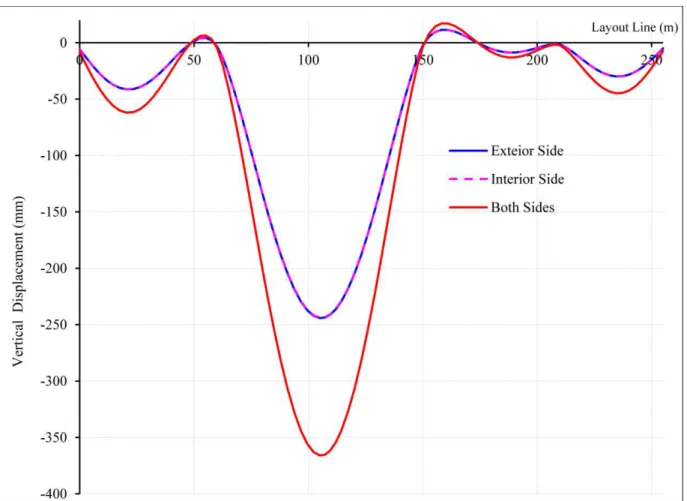
Figure 12 shows the vertical displacement of the exterior girder along its length for different load cases where the dead load is combined with ice load accumulated on exterior side, interior side, or both sides. As it can be seen in the figure, the central deflection does not noticeably changed in the case of the ice accumulated on one side of the bridge (either exterior side or
interior side); however, in the case of ice accumulated in both sides of the bridge, the central deflection increased up to 35%. Based on this large increase in the deformations, it is
recommended that the ice/snow clearing operations should avoid accumulating the ice/snow on the bridge; neither on any bridge side nor on both sides, specifically on the central span of such a continuous multi-span curved box-girder bridge.
Figure 9: Moment of exterior girder along length for different load cases.
Figure 10: Deformed shape of the bridge superstructure (mm) under dead load and accumulated ice load on one side.
Figure 11: Deformed shape of the bridge superstructure (mm) under dead load and accumulated ice load on both sides.
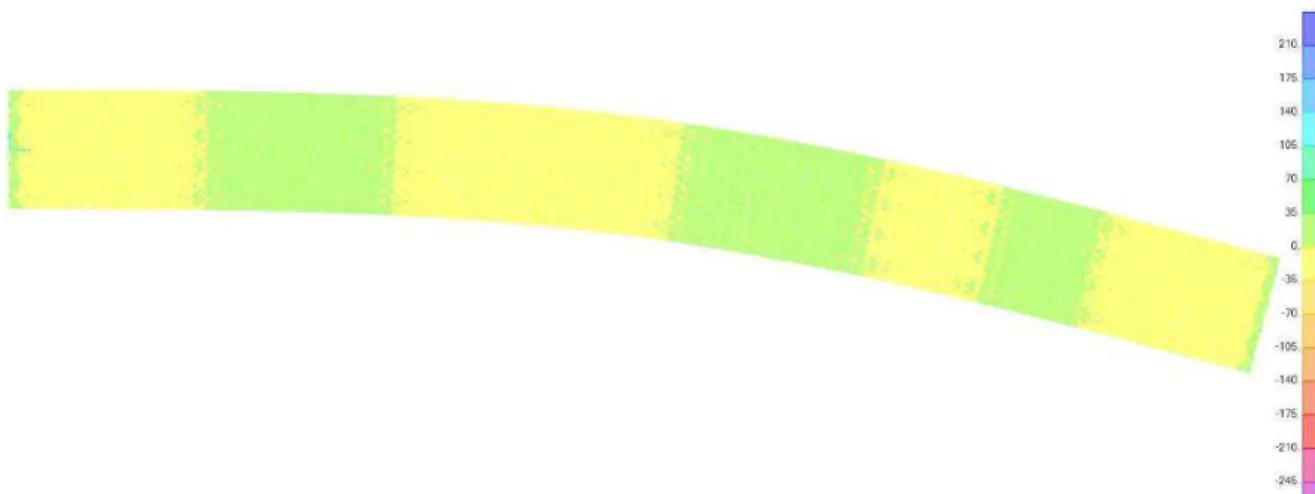
The variations of stresses over the bridge superstructure along the bridge due to different load combinations are shown in Figures 13 and 14. When the dead load is combined with the ice accumulated on one side, the stress distribution values range from -245 to 210 MPa. On the other hand, when the dead load is combined with the ice accumulated on both sides, the distribution patterns are similar and the stress values are range from -350 to 300 MPa.
Figure 12: Vertical displacement of exterior girder along length for different load cases.
Figure 13: Stresses distribution of the bridge superstructure (MPa) under dead load and accumulated ice load on one side.
Figure 14: Stresses distribution of the bridge superstructure (MPa) under dead load and accumulated ice load on both sides.
SUMMARY AND CONCLUSIONS
Among the many effects of the climate change on existing bridges, increases in temperature and precipitations, changes in wind patterns, and increase in frequency and severity of extreme weather events such as heat waves, storms, and floods are expected. The expected continuation or acceleration of climate change threaten the integrity and robustness of bridge infrastructure. This paper presents the preliminary results of on-going study that is investigating the impact of extreme climate loads such as ambient temperatures, high thermal gradients, and ice accretion on the safety and serviceability of a curved continuous composite box-girder bridges. The bridge is designed according to CHBDC and simulated using a three-dimensional nonlinear finite element model. The bridge is assumed to be subjected to different levels of temperature and ice accretion loads combined with other gravity loads. In the case of temperature, the bridge is assumed to be located in critical regions that are expected to experience large changes in climate loads where the temperatures range between +30ºC (as a maximum predicted average ambient temperature in a hot day) and -45 ºC (as a coldest predicted average ambient temperature). In the case of ice accretion, it is assumed that the bridge is subjected to three different load cases as the ice is assumed to be accumulated during the clearing operation in a severe ice storm. The three loading
cases are: (i) ice is accumulated on the exterior side of the bridge; (ii) ice is accumulated on interior side of the bridge; and (iii) the ice is accumulated in both sides of the bridge.
The structural performance of the bridge superstructure is examined when the bridge is subjected to different levels of temperatures or ice accretion combined with different loads. It is found that the extreme temperature loads would lead to large increases of the deformations and bending moments in critical sections of the interior and exterior girders. Moreover, when the bridge is subjected to different distributions of ice accretion, the results show large increases in deformations, and high-stress levels in the critical sections of the bridge superstructure.
In both loading cases (temperature or ice accretion), there are substantial increase in longitudinal displacements that exceed the CHBDC S6-14 allowable limits. The safety of the connections between the deck-slab and the steel girders should be further investigated in future studies. This study shows only the preliminary results of the ongoing research at the NRC Canada that focus on evaluating the impact of climate change on the bridge infrastructure. The potential aim is to propose modifications to the Canadian Highway Bridge Design Code adopting the climate change effects and maintaining the same levels of structural safety and serviceability.
REFERENCES
Chang. L., and Lee. Y. (2001). “Evaluation and policy for bridge deck expansion joints.” Final report: FHWA/IN/JTRP-2000/1; February.
CSA. (2014). “Canadian Highway Bridge Design Code, S6-14.” Canadian Standard Association, Toronto, Canada.
CSiBridge 2019. v. 20.2.0. (2019). “Computers and Structures.” Inc., Walnut Creek, CA. Ervik, M and Fikke, S (1982a). "Development of a mathematical model to estimate ice loading
on transmission lines by use of general climatological data," IEEE Transactions On Power Apparatus & Systems, Vol PAS- 101, No 6, pp 1497-1503.
Ervik, M and Fikke, S (1982b). "Attempts Toward Estimating Ice Loadings Based on General Climatological Data," Proc of the 1st Intern Workshop on Atmospheric Icing of Structures, Hanover, NH, USA, pp 33-40.
Liu. C., and DeWolf. J. (2003). “Effect of Temperature on Modal Variability of a Curved Concrete Bridge under Ambient Loads.” Journal of Structural Engineering. 12(133); PP 1742-1751.
Nemry. F., and Demirel. H. (2012). “Impacts of Climate Change on Transport: A focus on road and rail transport infrastructures.” European Commission, Joint Research Centre (JRC), Institute for Prospective Technological Studies (IPTS), PP 93.
Tong, M., Tham. L., Au. F., and Lee. P. (2001). “Numerical modelling for temperature distribution in steel.” Computer & structures; 6(30). PP 583-593.
Wang, X., Nguyen, M., Stewart, M. G., Syme, M., and Leitch, A. (2010). “Analysis of Climate Change Impacts on the Deterioration of Concrete Infrastructure Part 3: Case Studies of Concrete Deterioration and Adaptation.” CSIRO, Canberra. ISBN 9780643103672