HAL Id: hal-01576168
https://hal.archives-ouvertes.fr/hal-01576168
Submitted on 23 Aug 2017
HAL is a multi-disciplinary open access
archive for the deposit and dissemination of
sci-entific research documents, whether they are
pub-lished or not. The documents may come from
teaching and research institutions in France or
abroad, or from public or private research centers.
L’archive ouverte pluridisciplinaire HAL, est
destinée au dépôt et à la diffusion de documents
scientifiques de niveau recherche, publiés ou non,
émanant des établissements d’enseignement et de
recherche français ou étrangers, des laboratoires
publics ou privés.
EFFECT OF LINSEED OIL AND METAKAOLIN ON
THE MECHANICAL, THERMAL AND TRANSPORT
PROPERTIES OF HEMP-LIME CONCRETE
J Sheridan, M Sonebi, S Taylor, S Amziane
To cite this version:
J Sheridan, M Sonebi, S Taylor, S Amziane. EFFECT OF LINSEED OIL AND METAKAOLIN
ON THE MECHANICAL, THERMAL AND TRANSPORT PROPERTIES OF HEMP-LIME
CON-CRETE. ICBBM 2017, 2nd International Conference On Bio-Based Building Materials, Edited By
Sofiane AMZIANE And Mohammed SONEBI, Jun 2017, Clermont Ferrand, France. �hal-01576168�
EcoGRAFI
2nd International Conference on Bio-based Building Materials & 1st Conference on ECOlogical valorisation of GRAnular and FIbrous materials
June 21th - 23th 2017 Clermont-Ferrand, France
EFFECT OF LINSEED OIL AND METAKAOLIN ON THE MECHANICAL,
THERMAL AND TRANSPORT PROPERTIES OF HEMP-LIME CONCRETE
J. Sheridan¹, M. Sonebi¹, S. Taylor¹, S. Amziane²
1
Queen’s University Belfast, School of Natural and Built Environment, Belfast, BT7 1NN, UK
2
Université Blaise Pascal, Institut Pascal, Polytech Clermont-Ferrand, 63174, Aubière, France *Corresponding author; e-mail: jsheridan08@qub.ac.uk
Abstract
With the increasing concern given to pollution and climate change bio-based building materials have been pushed to the forefront of research in an effort to reduce the large carbon footprint of the construction industry in order to meet emission targets One of these materials is hemp concrete which is a bio-composite made up of the non-fibrous part of hemp called shiv, water and a lime binder. This study investigated two different binders; hydrated lime as a control and a composite binder containing 80% hydrated lime and 20% metakaolin. The effect of metakaolin is investigated on the mechanical, thermal and transport properties. The pre-treatment of the aggregate with linseed oil is also studied. It was found that the addition of metakaolin increased the compressive strength of the hydrated lime samples. It was also observed that for both binder types the addition of metakaolin into the binder increased the capillarity water absorption of the samples. The addition of metakaolin reduced the thermal conductivity of hydrated lime samples when the test was done in the direction perpendicular to the fibre orientation. Finally, the pretreatment of the aggregate with linseed oil increased the compressive strength and modulus of elasticity of the samples and greatly reduced the material’s capillarity absorption. Linseed oil pretreatment also lead to an increase in thermal conductivity of the samples.
Keywords:
Hemp; metakaolin; linseed oil; mechanical properties; thermal properties; capillarity.
1 INTRODUCTION
In recent decades things such as sustainability, carbon footprint and pollution are issues that have become very important and well known to everyone on a global scale. It is widely recognised that the human race needs to revise its stance on these issues as areas such as industry, construction and energy and transport cause degradation to the environment and the planet as a whole. Thus, sustainability across the globe has a necessary focus in research.
Energy use in the building sector can and needs to also be reduced. This has led to a focus in research on more sustainable building materials. Energy use in buildings can be greatly reduced simply by better insulation. It is reported by the European Environment Agency [2015] that 26.8% of all energy used in the European Union in 2013 was in households, slightly ahead of industry (25.1%) and behind only transport (31.6%). It is reported by the UK Department of Energy & Climate Change that in the UK the amount of household energy that is used in heating space amounted to 62% [Palmer & Cooper 2013]. Thus, based on these figures roughly 16.6% of all energy used was in the heating of space which is a number that has potential to be lowered in the form of new and
better building materials that are both sustainable to produce and also provide excellent levels of insulation. One such material that achieves these performances things is bio based building materials [Amziane & Sonebi 2016]. This concrete is most commonly made up of chopped hemp shiv, a lime binder and water. Hemp is well known to be a great insulator [Amziane & Sonebi 2015] but two of the biggest issues identified with bio-based building materials are their mechanical performance and their water absorption. Problems around the interfacial transition zone (ITZ) have been identified as the primary reason for these weaknesses as the binder and the aggregate do not interact well. This was investigated by Sedan [2008] who highlighted the ability of pectin to ‘trap’ and form complex molecules with calcium (Ca ions. Another factor in the complex ITZ of this material is again the aggregate’s ability to absorb large amounts of water. The high porosity of this material allows the aggregate to absorb water using capillarity forces and also diffuse it. Leading to a hydration deficit [Nozahic & Amziane 2012] which, combined with the trapping of calcium ions results in retarding of the binder hydration; thus limiting the mechanical performance of the material. Numerous techniques have been reported in the literature to try and overcome this problem; primarily
involving surface treatment or coating of the aggregate or additives into the mixture. Khazma [2008] investigated using sucrose as an aggregate pretreatment and Monreal [2011] investigated the use of linseed oil. Other things such as paraffin wax and calcium hydroxide [Nozahic & Amziane 2012], NaOH treatment [Sedan et al. 2008] and EDTA [Le Troedec et al. 2008] have been investigated. This paper aims to optimise and tackle the issues this material presents using four different mixes using two different lime binders; hydrated lime and prompt natural cement (PNC). Both of these mixes were then used as a control and were partially replaced with metakaolin. The replacement level was set at 20% for both mixes and metakaolin was chosen to be used due to its well known capacity to increase the durability of ordinary concrete (OC) by reducing its water absorption as well as its ability to increase the long term strength of OC [Abbas et al. 2010]. An aggregate pretreatment using linseed oil was investigated as it has been reported that pretreating the aggregate with linseed oil reduces its water absorption [Manh 2014].
2 MATERIALS, METHODS AND EXPERIMENTAL PROCEDURES
2.1 Materials
As mentioned above the aggregate that was used in this investigation was hemp shiv which was grown and packed in Driffield, East Yorkshire in the UK. The binders that were used were Vicat (PNC) and hydrated lime. The PNC is mined from a seam of argillaceous limestone in Grenobles France and the hydrated lime is manufactured by Clogrennane Lime Ltd. in Co. Carlow, Ireland. The linseed oil that was used was produced by Barretine Products in Bristol, UK and the metakaolin used was called Burgess Optipozz and was produced by Burgess Pigment Company in Sandersville, Georgia in the USA.
2.2 Methodology
The first thing that was conducted was the characterization of the aggregates. This was done by determining the bulk density, the water absorption and the particle size distribution (PSD) of the hemp straw. Prior to these tests being conducted, however, the aggregate was dried in an oven at 50°C until the mass variation was +/-0.1% of the day before. Then the aggregate was removed from the oven and stored in laboratory conditions (20°C and 50% humidity) for at least one day before anything else was done.
The PSD of the sample was determined using both the mechanical sieve method as well as the image analysis method proposed by Picandet [2012]. This involves using a computer software called ImageJ to analyse the individual particles for measurements like length, width, perimeter and area. In this investigation the major and minor axis were used as well as the equivalent diameter (ED) which was calculated using equation (1).
(1) The mechanical properties were also investigated and the properties chosen were the compressive strength and elastic modulus. The compressive strength of the samples were determined using 50mm cubes and a
Zwick Roell static materials testing machine with a 100kN load cell. Similarly the elastic modulus of the samples were also determined using the Zwick Roell machine but this time with 200x100Ømm cylinders. Both of these properties were tested at 7, 28 and 90 days.
All of the samples in this investigation used the same A:B:W ratio and that was 1:2:3. They were also cast using the same procedure and this was to add the aggregate and 65% of the mixing water first and mix for 2 minutes and 30 seconds. The binder was then added and mixed for a further 30 seconds before the remaining 35% of the mixing water and the additive (if one was used) was added. Mixing was done for a further 3 minutes to achieve homogeneity for a total mixing time of 5 minutes. The mixes were then cast in steel moulds in layers (3 for cylinders and 100mm cubes and 2 for 50mm cubes) using manual compaction hammers (Fig. 1) and were then allowed to mature in laboratory conditions for 3 days before demoulding. In regards to mechanical and thermal testing the samples were left in these conditions without cover until testing.
The water capillarity of the samples was also tested and these tests were conducted on 100mm cubes. The mixing and casting of the samples was exactly the same as for the mechanical property testing however the storage of the samples was slightly different. The test was adapted from the recommendations for ordinary concrete by the International Union of Testing and Research Laboratories for Materials and Structures [1994]. To this point, the samples were tested after 14 and 28 days and were stored in an oven with a temperature of 50°C for 14 days prior to testing.
Fig. 1 – Compaction Procedure [Page et al. 2015]
2.3 Experimental Procedure
Bulk Density
The test was carried out in laboratory conditions in order to ensure the bulk density results are reliable. 3 tests were conducted in order to analyse reliability The method is as follows:
1. Put an amount of the dried aggregate in a glass cylinder 10cm to 20cm in diameter and at least twice the diameter in height. The amount of material should be adjusted to be approximately half the volume of the container, at which point the mass should be taken.
2. Upend the cylinder 10 times.
3. Gently shake the cylinder in order to obtain a horizontal surface.
4. Mark the level.
5. Empty the cylinder and measure the marked volume with water.
6. Calculate the bulk density using equation (2).
ICBBM 2017 20 21 22 23 24 25 26 27 28 29 0 100 200 300 400 500 T e m p e ra tu re ( °C ) Time (s) PNC Untreated Water Absorption
These tests were conducted in order to analyse the repeatability of the test and prior to testing the aggregates were homogenized as in a 20kg bag the aggregate would naturally segregate. The method was as follows:
1. Completely wet the permeable bag that will be used in the experiment.
2. Spin the wet permeable bag in a salad spinner 100 times at roughly twice per second.
3. Note the weight of the bag.
4. Weigh 25g of dry sample (denoted ) and put in the bag.
5. Submerge the bag and sample in the water for 1 minute.
6. Return the bag to the salad spinner and spin 100 times.
7. Weigh the bag and note the value for .
8. Repeat steps 5-7 with increasing time intervals and calculate the absorption value using equation (3).
100 (3)
Compressive Strength and Elastic Modulus
1. Weigh the sample and measure the height, width and thickness to be able to calculate the density. 2. Position the sample in the Zwick machine and
lower the crosshead until the compression pad is in contact with the top surface of the sample.
3. The loading rate was set to 0.6 N/s and the samples were tested up to 20% strain. The strength of the sample was also noted at 5% strain for the purposes of serviceability limits.
4. In regards to elastic modulus the test was conducted using cyclic loading. Three cycles were used the first being loading from 0% to 1% strain and back to 0 N of force. The second cycle was up to 2% strain and back to 0 N of force and the third cycle was up to 3% strain and back to 0 N of force. Finally the samples were then loaded up to 20% strain.
5. Due to the fact that elastic modulus is defined as the change in stress over the change in strain it could be calculated using the resultant stress/strain graph from the cyclic experiment. The modulus was taken as the average of the three cyclic loading lines on the graph as detailed by Niyigena [2016]
Water Capillarity
1. 100mm cubes were prepared by applying a layer of waterproof tape around the circumference of the sample at the base to ensure the sample is only exposed to the water at its base.
2. A container of water was prepared and steel bars were set at the bottom of the container so as to prop up the samples. The amount of water in the container was also of the volume that an 8mm imbibition level was maintained between the top of the steel bar and the surface of the water (Fig. 2). 3. The samples were weighed when dry and then
added to the container and exposed to the water. The samples were removed from the water and weighed at set intervals of 1, 2, 3, 5, 10, 15, 30, 60, 120, 180 and 300 minutes.
4. It is critical to note that the level of the water was measured regularly to ensure the 8mm imbibition was maintained.
Fig. 2 – Water Capillarity test setup Thermal Testing
The thermal conductivity testing was adapted from BS EN 993-15:2005 [British Standards Institution 2005]. In order to investigate the thermal conductivity of the PNC and hydrated lime samples 100 mm samples were cast and then cut in half leaving 2 100x100x50 mm slabs. The transient hot wire method was chosen over the hot plate method because it is much quicker to repeat and gives equally good results and this method works by generating a heat flux by Joule effect and measures the variation in temperature as a function of time using a thermocouple. The rise in temperature was limited to 20 °C, the test duration was 50 seconds and the power inputted to the system was 0.1 W. The equation for calculating the thermal conductivity is presented in equation (4) and Fig. 3 illustrates an example of a thermograph that is produced by the machine which is used to calculate the thermal conductivity (λ) using the long slope of the graph (ξ), time (t), temperature (T), the electrical power of the machine (P) and the wire length (L). In this case it is the inside faces of an untreated PNC sample that were studied.
# $% ∆'( ∆) $%* (4) The thermal conductivity measurement was done in the perpendicular casting direction and was measured on both the outer faces of the samples and the inner faces. The average was then taken and those are the results presented.
Fig.3 – An Example of a Temperature/Time Graph for PNC Untreated Sample
0 20 40 60 80 100 0.1 1 10 100 1000 C u m a la ti v e F re q u e n cy ( % ) Log(Particle Size) (μm) Hydrated Lime Metakaolin Vicat 0 50 100 150 200 250 300 350 400 450 0 500 1000 W a te r A b so rp ti o n ( % ) Time (mins) Untreated Linseed Oil y = 23.904ln(x) + 217.69 y = 12.572ln(x) + 156.79 0 50 100 150 200 250 300 350 400 450 1 10 100 1000 W a te r A b so rp ti o n ( % ) Log(time) (Mins) Untreated Linseed Oil
3 RESULTS AND DISCUSSION 3.1 Aggregate Characterisation
Bulk Density
The bulk density of the aggregate and the binders were first calculated and the results can be seen in Tab. 1 below.
Tab. 1 – Bulk Density of the Aggregate and Binder
Sample Bulk Density (kg/m^3)
Hemp 102.4
Vicat PNC 2894.3
Hydrated Lime 2220.9
Metakaolin 2064.1
Particle Size Distribution
Particle size distribution was conducted on both the aggregate and the binders used and also a comparison study was conducted regarding the effectiveness of the ImageJ electronic method and the traditional mechanical sieve method. It was found that the ImageJ method gave much more essential information on the aggregate whereas the mechanical sieve method only separates the particles in to set widths (Sheridan et al. 2017).
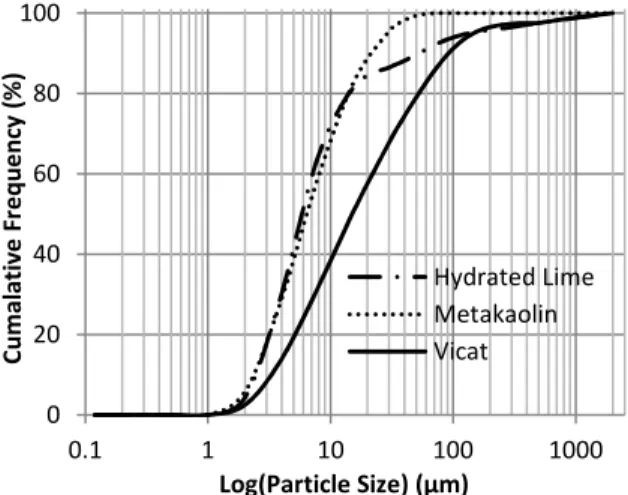
Particle size distribution was also completed for the binders that were used in this investigation. As Fig. 4 illustrates, overall the metakaolin had the smallest particle size although the metakaolin and hydrated lime distribution was roughly the same up to around 15 µm. The hydrated lime was actually marginally smaller to that point, however there were a lot more larger particles in the hydrated lime sample over 15 µm which can be seen in Fig. 4 and lead to the distribution destabilizing the way it has. In contrast, the normal distribution continued for the metakaolin sample.
Fig. 4 – PSD of the Binders Water Absorption
The water absorption of the hemp aggregate with and without linseed oil pretreatment was also tested as part of the characterization process as described previously. This can be seen in Fig. 5.
Fig. 5 – Water Absorption of Untreated and Treated Aggregate
It can be seen in Fig. 5 that both aggregates absorb most of their water over the 24 hour testing period in the first minute. This is the initial rate of absorption (IRA) and is the amount of water that is absorbed after 1 minute of exposure and represents the initial water suction from a free water surface [Groot 1999]. It can be seen that the pretreatment of the aggregate with linseed oil greatly reduces the amount of water absorbed when compared with untreated; after 24 hours the untreated sample has absorbed 394 % of its own weight in water whereas the linseed oil-treated hemp absorbed 242 %. These results are obviously very high but the addition of linseed oil does reduce the amount of water absorbed by 39 %. The results were then plotted against the log of time and expression (5) was used to describe the absorption characteristics of both materials.
+,- + / 012 (5) The IRA is the amount of water that is absorbed after 1 minute of exposure as described previously and the diffusion rate within cells is described by the term K . This is more related to the secondary absorption or internal adsorption step of capillarity; it is this term that is closely linked to the essential porosity of the material.
Fig. 6 – Sorption Coefficients for Untreated and Pretreated
In addition to once again showing that the IRA of the untreated sample was much higher than that of the
ICBBM 2017 400 450 500 550 600 650
Untreated Untreated MK Linseed Oil Linseed Oil MK D e n si ty ( kg /m ³) Vicat Hydrated Lime 400 420 440 460 480 500 520 540 560 Untreated Untreated MK
Linseed Oil Linseed Oil MK D e n si ty ( kg /m ³) Vicat Hydrated Lime 0.00 0.05 0.10 0.15 0.20 0.25 0.30 0.35 0.40 0.45 0.50 Untreated Untreated MK
Linseed Oil Linseed Oil MK C o m p re ss iv e S tr e n g th ( M P a ) Vicat Hydrated Lime pretreated equivalent Fig. 6 also shows that the
addition of linseed oil also reduces the amount of water that is absorbed on the macro and micro scale.
3.2 Mechanical Properties
Cube Density
As mentioned previously mechanical performance of all the binders, treated and untreated, were studied. And prior to testing the density of the cubes were calculated and are presented below in Fig. 7.
Fig. 7 – Density Comparison for all Binders Treated and Untreated at 7 days
As can be seen in all cases the hydrated lime binder leads to a higher density than the equivalent PNC mix. Fig. 7 also illustrates that the pretreatment of the aggregate with linseed oil increases the density of the sample. This increase in density, according to the literature, leads to an increase in mechanical performance and reduces the amount of water absorbed by the samples however reduces the thermal performance of the material (Elfordy et al. 2008) so this will form part of the rest of the investigation. It can also be seen that the partial replacement of the binder with metakaolin resulted in a reduction of the density. This is due to the bulk density of the material as is presented in Tab. 1. When analyzing the density of the samples after 28 days (Fig. 8) the first thing that is noticed is the vast reduction in density for all of the samples. All of the untreated samples still follow the trends set in the 7 day samples and the pretreatment of the aggregate with linseed oil again leads to an increase in the density however the partial replacement with metakaolin leads to an increase in density for both binder types. This will need to be investigated further, and could be attributed to the nature of metakaolin; it adds strength to the concrete in the long term. This may provide the explanation to this pattern.
Fig. 8 – Density Comparison for all Binders Treated and Untreated at 28 days
Compressive Strength
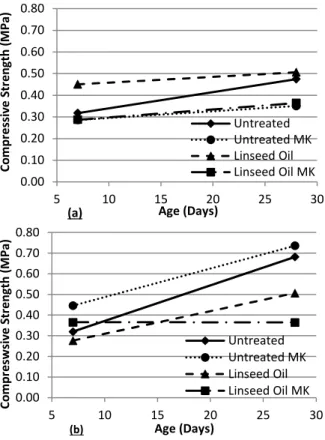
As can be seen in Fig. 9 the hydrated lime samples are stronger at the age of 7 days when compared to the PNC samples. It can also be seen that the addition of metakaolin into the mix resulted in a lower strength after 7 days. Although this is less of a concern at this age as metakaolin does not improve the short term strength of the material; rather it improves the long term strength. Indeed it is plausible that the addition of metakaolin into the PNC mixes would not cause an increase in strength in either case. This is because the PNC is naturally high in pozzolanic material (around 17% SiO2 and 7% Al). So in comparison to the hydrated lime samples there may not be enough free lime to react with the added pozzolan. Finally it can be seen that using linseed oil as a pretreatment results in an increase in compressive strength for the binders that have not been replaced. However we can see, particularly in the case of the hydrated lime-partially replaced samples, using linseed oil results in a loss in strength.
Fig. 9 – Compressive Strength of all Mixes after 7 days
Fig. 10 shows the same patterns for the 28 day samples. Again the hydrated lime samples are stronger than the equivalent PNC samples. And treating the aggregate in the PNC samples with linseed oil causes an increase in compressive strength similar to the 7 day strengths. It can also be seen that once again the addition of metakaolin into the mix causes a
0.00 0.10 0.20 0.30 0.40 0.50 0.60 0.70 0.80
Untreated Untreated MK Linseed Oil Linseed Oil MK
C o m p re ss iv e S tr e n g th ( M P a ) Vicat Hydrated Lime 0.00 0.10 0.20 0.30 0.40 0.50 0.60 0.70 0.80 5 10 15 20 25 30 C o m p re sw si v e S tr e n g th ( M P a ) Age (Days) (b) Untreated Untreated MK Linseed Oil Linseed Oil MK 0.00 0.10 0.20 0.30 0.40 0.50 0.60 0.70 0.80 5 10 15 20 25 30 C o m p re ss iv e S tr e n g th ( M P a ) Age (Days) (a) Untreated Untreated MK Linseed Oil Linseed Oil MK 0 5 10 15 20 25 Untreated Untreated MK
Linseed Oil Linseed Oil MK M o d u lu s o f E la st ic it y ( M P a ) Vicat Hydrated Lime 0 5 10 15 20 25 30 35 40 45 Untreated Untreated MK
Linseed Oil Linseed Oil MK M o d u lu s o f E la st ic it y ( M P a ) Vicat Hydrated Lime reduction in strength for all samples. Further testing
will be conducted at 90 day maturity to investigate if metakaolin has any benefits in the long term in regards to compressive strength as this is what was expected [Sonebi et al. 2013].
Fig. 10 – Compressive Strength of all Mixes after 28 days
In order to compare how the binders gain strength with time, Fig. 11 is presented. It shows that the PNC samples do not gain a lot of strength between 7 and 28 days. In contrast, the hydrated lime samples gain significant strength. It can be seen that the compressive strength of the PNC and hydrated lime samples start at roughly the same value, but with the PNC samples not gaining much strength they appear to be significantly weaker overall. This trend will be investigated further to see if the strength of either binder type gains strength and at what rate.
Fig. 11 – Strength Development of all Mixes (a) PNC (b) Hydrated Lime
Elastic Modulus
As was previously mentioned the specimen size that was chosen for the elastic modulus investigation was 200x100Ø mm cylinders. The modulus of elasticity results after 7 days are presented in Fig. 12.
Fig.12 – Modulus of Elasticity of all Mixes after 7 days
The figure clearly shows that for all mixes the Vicat counterparts have the higher modulus of elasticity. This is interesting when these results are looked at in conjunction with the compressive strength results. For all the mixes except the linseed oil pretreated mixes it was found that the compressive strength was higher for the hydrated lime mixes. This indicates that the hydrated lime samples are stronger and yet more ductile; whereas the Vicat mixes are weaker but stiffer. The relative ductility of the hydrated lime samples is not necessarily a negative thing however, particularly in regards to failure situations and serviceability. Indeed the ductility can be seen as a positive, as an element approaching a failure state will exhibit signs earlier of potential failure which leaves time for the element to be repaired or replaced if need be. Whereas if these warning signs do not appear and the failure of the element occurs without warning much larger problems could ensue when you consider an entire building envelop. Early indication of failure possibility can often be critical to minimizing damage to the hypothetical building as a whole.
Fig. 13 – Elastic Modulus of all Mixes after 28 days
As Fig. 13 indicates, the trends exhibited in Fig. 12 are largely consistent after 28 days. The only inconsistency is found in the hydrate lime samples
ICBBM 2017 0 5 10 15 20 25 30 35 40 0 1 2 3 4 5 M a ss o f W a te r A b so rb e d (% ) Time (hrs) (a) Untreated Untreated MK Linseed Oil Linseed Oil MK 0 5 10 15 20 25 30 35 40 0 1 2 3 4 5 M a ss o f W a te r A b so rb e d (% ) Time (hrs) (b) Untreated Untreated MK Linseed Oil Linseed Oil MK 0 5 10 15 20 25 30 35 40 45 50 0 1 2 3 4 5 M a ss o f W a te r A b so rb e d ( % ) Time (hrs) (a) Untreated Untreated MK Linseed Oil Linseed Oil MK 0 5 10 15 20 25 30 35 40 45 50 0 1 2 3 4 5 M a ss o f W a te r A b so rb e d ( % ) Time (hrs) (b) Untreated Untreated MK Linseed Oil Linseed Oil MK where the partial replacement of the lime with
metakaolin leads to a lower strength than the hydrated lime sample without the metakaolin. It can also be noted that after 28 days it is clear that the hydrated lime samples are gaining stiffness faster than the Vicat samples. This will be investigated further as to see if the samples are left for longer will the modulus of elasticity for the hydrated lime samples become greater than the equivalent Vicat samples. Testing will be conducted after 90 days to investigate this.
3.3 Water Capillarity
As mentioned previously the water capillarity test was done after 14 and 28 days. This was to determine if the maturity of the binder had any impact on the porosity of the concrete; in this case most likely through the mechanism of carbonation. The results are presented in two different ways; by percentage of weight and also in kg/m^3. This represents the fact that due to the test setup water could only be absorbed with capillary forces through the bottom face of the cube only. Fig. 14 shows the amount of water absorbed by percentage of mass for both binder types. It can be seen that for all mixes for both binders the addition of metakaolin causes an increase in the amount of water absorbed. Which is not ideal as it is well known that the addition of metakaolin into an ordinary concrete mixture reduces water absorbance and so aids durability resistance. This is one of the reasons why metakaolin was chosen as an additive in this project. The figure also illustrates that the PNC samples absorb less water than their hydrated lime equivalents. There is up to a 20% reduction in the percentage of water absorbed by weight for the untreated binder counterparts. It can also clearly be seen that the addition of linseed oil results in a drastic reduction in water absorption of all the samples, which is promising for its use in the future and also gives hope for the materials weathering resistance capabilities.
Fig. 14 – Percentage of Water Absorbed by Mass at 14 days (a) PNC (b) Hydrated Lime
All of the same patterns exist for the samples tested after 28 days as is shown in Fig. 15. However it can be observed that as the concrete matures, it allows more water to be absorbed. The untreated samples absorb 40 and 25% (untreated with metakaolin replacement and untreated) of their weight in water after 28 days whereas at 14 days they only absorb 30 and 15%. This pattern is the also the same for the hydrated lime samples. It can also be seen that if the data is extrapolated the samples are clearly not fully saturated. This has implications for weathering testing and the test should be repeated to determine how long it takes for the samples to saturate in order to conduct durability testing on the material.
Fig. 15 – Percentage of Water Absorbed by Mass at 28 days (a) PNC (b) Hydrated Lime
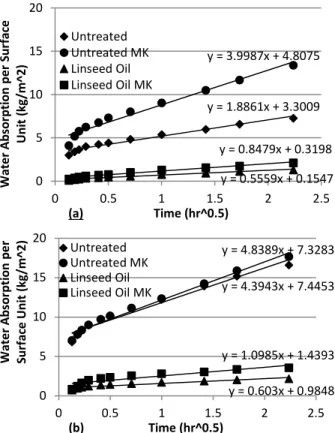
Fig. 15 highlights the sorption coefficient of the material. As recommended by Amziane et al. [2017] the results of the capillarity test are converted into kg/m^3 using the known dimensions of the bottom face of the cube and plotted against log(time). This allows a best fit line to be plotted for the data set and this can be used to find the amount of water absorbed, W, at a specified time, t, using expression (5);
y = 1.8861x + 3.3009 y = 3.9987x + 4.8075 y = 0.5559x + 0.1547 y = 0.8479x + 0.3198 0 5 10 15 20 0 0.5 1 1.5 2 2.5 W a te r A b so rp ti o n p e r S u rf a ce U n it ( kg /m ^ 2 ) Time (hr^0.5) (a) Untreated Untreated MK Linseed Oil Linseed Oil MK y = 4.3943x + 7.4453 y = 4.8389x + 7.3283 y = 0.603x + 0.9848 y = 1.0985x + 1.4393 0 5 10 15 20 0 0.5 1 1.5 2 2.5 W a te r A b so rp ti o n p e r S u rf a ce U n it ( kg /m ^ 2 ) Time (hr^0.5) (b) Untreated Untreated MK Linseed Oil Linseed Oil MK 0 100 200 300 400 500 600 0 0.02 0.04 0.06 0.08 0.1 0.12 0.14 0.16 U U MK Lin Lin MK D e n si ty ( kg /m ^ 3 ) λ ( W /m K ) (a) Conductivity Density 0 100 200 300 400 500 600 0 0.02 0.04 0.06 0.08 0.1 0.12 0.14 0.16 U U MK Lin Lin MK D e n si ty ( kg /m ^ 3 ) λ ( W /m K ) (b) Conductivity Density
Fig. 16 – Sorption Coefficients for all Samples at 14 days (a) PNC (b) Hydrated Lime
Fig. 16 breaks down the water capillarity test in more detail as described previously. The figure illustrates that the hydrated lime samples are more susceptible to water absorption in both of the absorption steps. It is more susceptible to capillarity forces as well as diffusion of water through the cell wall of the aggregate. The figure also shows the same patterns as in Fig. 14. An interesting observation to note is the effect of metakaolin on the untreated hydrated lime samples. The untreated metakaolin sample actually has a higher IRA than the untreated sample however has a lower K1 value. And it is the higher K1 value that makes the metakaolin replaced sample more susceptible to water.
3.4 Thermal
As mentioned previously the thermal conductivity testing was done using a 100 mm cube that was cut in half. Fig. 17 shows the conductivity results for the PNC and hydrated lime samples plotted alongside density. As can be seen for both binder types the addition of metakaolin into the mix causes a reduction in thermal conductivity. Pretreating the aggregate with linseed oil was found to increase the thermal conductivity; however this effect is more exaggerated for the hydraulic lime samples. The thermal conductivity is known to be closely linked to the density of the samples [Elfordy et al. 2008] and so this may be the cause for the increase in conductivity for the linseed oil samples. As the figure shows, using linseed oil leads to an increase in density and so most likely also causes the increase in conductivity. In regards to the comparison of the two binder types; the results are fairly similar. Particularly between the untreated samples the results are almost the same however for the linseed oil samples the hydraulic lime samples exhibit a higher thermal conductivity. Thus when
discussing thermal performance it can be seen that the PNC binder is the more preferable.
Fig. 17 – Thermal Conductivity of PNC and Hydrated Lime Samples (a) PNC (b) Hydrated Lime
4 CONCLUSION
Two different binder types were studied as well as an aggregate pretreatment of linseed oil and a binder replacement with metakaolin for any effects on the mechanical, transport and thermal properties. It can be concluded that overall the treatment of linseed oil is a positive addition to the field of bio-based building materials as it lead to an increase in compressive strength, elastic modulus and a drastic reduction in water absorption. This is a step in the right direction of countering the two biggest weaknesses of the material. And somewhat overcomes the fact that the pretreatment causes a slight increase in the thermal conductivity. It is true that the tremendous insulation capabilities of hemp concrete is one of the primary reasons for its prominence in the field of bio-based building materials however the increase in conductivity is marginal (0.007 W/mk for the PNC samples and 0.039 W/mk for the hydrated lime samples) and even with this increase the material is still a very good insulator.
In contrast the addition of metakaolin lead to mixed results. It caused a reduction in compressive strength for the PNC samples at 7 and 28 days however caused an increase in the strength for the hydrated lime samples both after 7 and 28 days. In addition to this the partial replacement with metakaolin caused wholly negative results in regards to water capillarity. For all samples at both 14 and 28 days the amount of water absorbed increased with the addition of metakaolin which is a concern and causes hesitation in recommending it for future use. It must be kept in
ICBBM 2017
mind, however, that this addition is more beneficial in the long term. And thus will be studied further at later ages for its effects.
Finally to directly compare the PNC and hydrated lime binder; it is concluded that both are viable for use in the field. However, it would seem that the PNC binder should, at this point, be more highly recommended. This is simply due to the water capillarity results where the PNC binder performed better. Although the hydrated lime samples exhibited the higher strength; the application of this material dictates the importance of the property. The most successful application of this material is as an insulation in a timber frame, thus making the compressive strength of the material slightly less important that its resistance to water absorption. The PNC samples also fared better in thermal testing where it produced lower results with more consistency; particularly after linseed oil pretreatment.
Future work will include longer term testing of the effect of metakaolin replacement, as well as the design and investigation of weathering resistance experiments, which is the key to promoting this material for use on a more global scale.
5 REFERENCES
[Abbas 2010] Abbas, R., A Abo-el-enein, S., and El-sayed, E. “Propiedades Y Durabilidad Del Cemento Con Adición de Metacaolín : Mortero Y Hormigón Properties and Durability of Metakaolin Blended Cements : Mortar and Concrete” 2010, 60: 33–49. [Amziane 2017] Amziane, S., Collet, F., Lawrence, M., Picandet, V., et al. “Round Robin Test for Hemp Shiv Characterisation: Committee Report of TC - 236 Bio-Based Building Materials.” 2017.
[Amziane 2015] Amziane, S., and Sonebi, M. 1st
International Conference on Bio-Based Building Materials. 2015
[Amziane 2016] Amziane, S., and Sonebi, M. “Overview on Bio-Based Building Material Made with Plant Aggregate,” 2016, 31–38.
[British Standards Institution 2005] British Standards Institution. “BS EN 993-15:2005 Methods of Test for Dense Shaped Refractory Products - Part 15: Determination of Thermal Conducitivty by the Hot-Wire (Parralel) Method.” 2015
[Elfordy 2008] Elfordy, S., Lucas, F., Tancret, F., Scudeller, Y. et al. “Mechanical and Thermal Properties of Lime and Hemp Concrete (‘hempcrete’) Manufactured by a Projection Process.” Construction
and Building Materials2008, 22 (10): 2116–23.
[European Energy Agency 2015] European Energy Agency. “Final Energy Consumption by Sector and Fuel.” European Energy Agency. 2015
[Groot 1999] Groot, C. “The Influence of Water Flow ( Reversal ) on Bond Strength Development in Young Masonry” 1999, 44 (2): 63–78.
[International Union of Testing and Research Laboratories for Materials and Structures 1994] International Union of Testing and Research
Laboratories for Materials and Structures. “Absorption of Water by Concrete by Capillarity.” In RILEM
Technical Recommendations for the Testing and Use of Construction Materials, 1994, 34–35. Taylor and
Francis.
[Khazma 2008] Khazma, M., El Hajj, N., Goullieux, A., Dheilly, R. M., et al. “Composites : Part A Influence of Sucrose Addition on the Performance of a Lignocellulosic Composite with a Cementious Matrix.”
Composites Part A 2008, 39 (12). Elsevier Ltd: 1901–
8.
[Le Troedec 2008] Le Troedec, M., Sedan, D., Peyratout, C., Bonnet, J. P., et al. “Influence of Various Chemical Treatments on the Composition and Structure of Hemp Fibres.” Composites Part A: Applied
Science and Manufacturing 2008, 39 (3): 514–22.
[Manh 2014] Manh, D. T. “Contribution to the Development of Precast Hempcrete Using Innovative Pozzolanic Binder.” University of Toulouse. 2014 [Monreal 2011] Monreal, P., Mboumba-Mamboundou, L. B., Dheilly, R. M., and Queneudec, M.. “Effects of Aggregate Coating on the Hygral Properties of Lignocellulosic Composites.” Cement and Concrete
Composites 2011, 33 (2). Elsevier Ltd: 301–8.
[Niyigena 2016] Niyigena, C., Amziane, S., Chateauneuf, A., Arnaud, L., et al. “Variability of the Mechanical Properties of Hemp Concrete.” Materials
Today Communications. 2016
[Nozahic 2012] Nozahic, V., and Amziane, S.. “Influence of Sunflower Aggregates Surface Treatments on Physical Properties and Adhesion with a Mineral Binder.” Composites Part A: Applied Science
and Manufacturing 2012, 43 (11). Elsevier Ltd: 1837–
49.
[Page 2015] Page, J., Sonebi, M., and Amziane, S.. “Experimental Investigation on the Performance of Hybrid Hemp-Flax Composite Materials.” In First
International Conference on Bio-Based Building Materials, 2015, 243–50. Clermont-Ferrand, France:
RILEM.
[Palmer 2013] Palmer, J. (DECC), and Cooper, I. (DECC). “Housing Energy Fact File.” Department of
Energy & Climate Change, 2013.
[Picandet 2012] Picandet, V., Tronet, P., and Baley, C. “Caractérisation Granulométrique Des Chènevottes.” 2012.
[Sedan 2008] Sedan, D., Pagnoux, C., Smith, A., and Chotard, T. “Mechanical Properties of Hemp Fibre Reinforced Cement : Influence of the Fibre / Matrix Interaction” 2008, 28: 183–92.
[Sheridan 2017} Sheridan, J., Sonebi, M., Taylor, S., and Amziane, S.. “Effect of Viscosity Modifying Agent on the Mechanical and Transport Properties of Hemp and Rapeseed Straw Concrete.” In 2nd International
Conference on Bio-Based Building Materials & 1st Conference on ECOlogical Valorisation of GRAnular and FIbrous Materials. 2017.
[Sonebi 2013] Sonebi, M, Lachemi, M., and Hossain, k. M. A.. “Optimisation of Rheological Parameters and Mechanical Properties of Superplasticised Cement Grouts Containing Metakaolin and Viscosity Modifying Admixture.” Construction and Building Materials 2013, 38. Elsevier Ltd: 126–38.
![Fig. 1 – Compaction Procedure [Page et al. 2015]](https://thumb-eu.123doks.com/thumbv2/123doknet/14593376.542775/3.892.461.772.647.768/fig-compaction-procedure-page-al.webp)