M
ULTIDIMENSIONAL MANAGEMENT AND ANALYSIS
OF QUALITY MEASURES FOR
CRM
APPLICATIONS IN AN
E
LECTRICITY
C
OMPANY
(Practice-Oriented Paper) Verónika Peralta
LI, Université François Rabelais Tours, France – PRISM, Université de Versailles, France [email protected]
Virginie Thion-Goasdoué
LAMSADE, Université de Paris Dauphine, France [email protected]
Zoubida Kedad
PRISM, Université de Versailles, France [email protected]
Laure Berti-Équille
IRISA, Université de Rennes 1, France [email protected]
Isabelle Comyn-Wattiau CNAM-CEDRIC, Paris, France
[email protected] Sylvaine Nugier EDF R&D, France [email protected] Samira Si-said-Cherfi CNAM-CEDRIC, Paris, France
Abstract: This paper presents an approach integrating data quality into the business intelligence chain in the context of customer-relationship management (CRM) applications at EDF (Electricité de France), the major electricity company in France. The main contribution of this paper is the definition and instantiation of a generic multi-dimensional star-like model for storing, analyzing and capitalizing data quality indicators, measurements and metadata. This approach is illustrated through one of EDF’s CRM applications, implementing domain-specific quality indicators and providing quality-driven information management as a business intelligence chain. The role of the data quality expert is highly emphasized. Key Words: Data Quality, CRM, Business Intelligence, Meta-model, Multidimensional Analysis.
1
I
NTRODUCTION
In the past few years, information quality management has become a very hot topic both in academic research and in industrial context. Researchers attempt to provide formal definitions of information quality enabling measures and automatic approaches. Companies use market software tools to compute quality measures from their data, their programs and their automatic and manual processes. Metrics and tools computing these measures are plethoric, leading to a huge amount of data and metadata. The problem is to exploit these data comparing different measures and thus deciding the most appropriate actions to improve the quality at various levels from the quality of data to the quality of the information systems (IS).
Capitalizing on the quality meta-model proposed in [2], we argue that it is useful and relevant to combine and jointly explore a variety of measures characterizing different perspectives of quality, i.e., from the quality of data to the quality of the system and the information supply chain and to provide users, designers and developers with a better understanding of the transversal notion of quality. We propose a multidimensional model gathering all quality measures computed from data and data models. These measures are defined according to relevant dimensions that are organized into a flexible and extensible multidimensional model.
In our on-going project [17], we have conducted experiments in various application contexts. One of these contexts is the commercial context at EDF (Electricité de France, the major electricity company in France), more specifically in a CRM (Customer Relationship Management) information system. In this paper, we describe an application scenario and illustrate the use of our approach to help fulfilling some of EDF’s CRM quality goals.
The contribution of this paper is twofold: (1) we present a multidimensional model for the analysis of quality measures aiming at being used in a data quality business intelligence chain, and (2) we describe our experience on quality analysis in the CRM context.
The rest of this paper is organized as follows. Section 2 introduces data quality issues in a CRM information system. This discussion leads us to propose a decisional framework for analyzing data quality in a multi-source IS, presented in Section 3. Finally, we illustrate our approach in such a CRM context at EDF in Section 4. We present related work in Section 5. Finally, we conclude in Section 6.
2
A
CRM
APPLICATION SCENARIO
The EDF Group is an integrated energetic utility company managing all aspects of the electricity business. In this paper, we focus on a commercial aspect of the group. EDF has a strong footing in Europe, with a total of 40.2 million customers worldwide (including 28 million in France).
Inside EDF organization, it is now understood that data quality management is not the exclusive domain of the IT department. Indeed, competences of IT actors are not sufficient to address this problem impacting technical applications, and business processes and even the whole company organization. A new role has been promoted in the company: the data quality expert. These actors have a solid multidisciplinary background in Statistics, IS and database (DB) engineering, or IT and good practical experience on data quality issues meaning that they know:
– how to lead and motivate the specifications of data quality requirements,
– how to choose tools, methods and best practices for data quality management (monitoring and improvement),
– how to insert a data quality management task in an IT project,
In EDF, data quality experts argue that they have to lead the elicitation of data quality requirements. For this purpose, an expert (or a group of experts) “stands” between business users and the IT division. This position is well accepted. Usually, data quality experts organize meetings with -and between- business users and IT division. Classically, they extract from discussions:
– Functional constraints, goals and data quality requirements associated to these goals (e.g., data quality measures and associated thresholds),
– Technical constraints related to data quality (e.g., technical constraints for possible software integration).
They possibly estimate costs caused by poor quality and costs of quality improvement. They bring all necessary information to managers for deciding highest priorities in terms of data quality management1. At EDF, CRM databases treat a large amount of multi-source information. The database chosen for purpose of validating our approach supports the management of major and small business French markets (these markets represent 2.3 million customers). This database results from the integration of several heterogeneous operational databases and some external databases (e.g., geographical referential databases for postal addresses2). In this context, even if some data quality controls are performed during the integration process, resulting data quality is not perfectly characterized. From the IT point of view, further data quality controls have to be done. Data quality problems are due either to a poor data quality in sources or to integration difficulties (e.g., schema mapping, data reconciliation). IT controls usually concern format constraints (e.g., syntactic coherence, null values, etc).
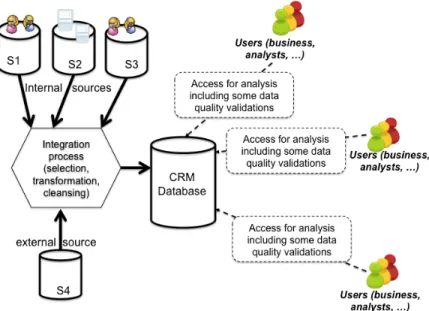
Business users often need information stored in the CRM database in order to perform data analyses (e.g., marketing studies). When such users access the CRM database, they first and foremost need to characterize the quality of accessed (or retrieved) information. They often need to check complex data quality business rules that were not controlled by the IT team. If there is no centralization of data quality measurement, each user has to individually perform the computation of business rules (see Figure 1 for illustration).
Figure 1 - CRM IS without centralization of data quality
This organization had several disadvantages:
– As a same measure can be completed several times, this is a lack of time and effort for the analysts. This also infers useless access and additional information to the system, leading to the deterioration of database performance (in particular its accessibility);
– Data quality experience is not shared. Thus, by lack of familiarity on specific data, an analyst could “forget” to check an important quality dimension;
1 They can also recommend best practices for organization (of projects or company) around data quality.
– Some data quality measures cannot be executed by an individual analyst (e.g., check postal addresses accuracy using a postal referential) because expertise on domain and high computing power are needed.
For these reasons, a large CRM database has to be able to centralize and automatically monitor the quality of its data. We will detail in Section 3.3 the required organizational changes that have been conducted to successfully implement data quality awareness in the business intelligence chain.
In the application scenario considered in this paper, CRM databases are used to extract information in order to support a survey, planned by EDF’s marketing service, about the energy load curves of its individual customers3. A set of target customers has to be extracted from the data of CRM applications, and then contacted by phone. One major problem is to minimize wrong calls, that is, calls to customers that are not relevant for the purpose of the survey. Wrong calls may occur if the client is not an individual customer, or if the contact information is not up-to date, or if the information related to the energy load curves is not complete. Therefore, the operational goal of our scenario is to produce the largest possible set of contacts ensuring that the number of wrong calls is minimal. To achieve this goal, we will mainly focus on the quality of the customers’ contact information on the one side, and on the quality of the information about the customers’ energy load on the other side. In the following, we will describe our quality evaluation approach and associated tools and illustrate how they can help in fulfilling the quality requirements of the considered context.
3
D
ECISIONAL SUPPORT FOR
CRM
QUALITY ANALYSIS
In this section we present our data quality evaluation approach, we propose a multidimensional model for analysis of quality metrics and we describe quality analysis as a business intelligence process.
3.1
An approach for data quality evaluation
Our quality evaluation approach is based on the Goal-Question-Metric (GQM) paradigm [3]. It proposes analyzing quality at three abstraction levels: (i) at functional level, identifying high-level quality goals (e.g., “reducing the number of returns in customer mails”), (ii) at operational level, enouncing a set of questions that characterize the way to assess each goal (e.g., “which is the amount of syntactic errors in customer addresses?”), and (iii) at quantitative level, defining a set of quality measures that quantify the way to answer to each question (e.g., the percentage of data satisfying a syntax rule) and a set of measurement methods for computing them.
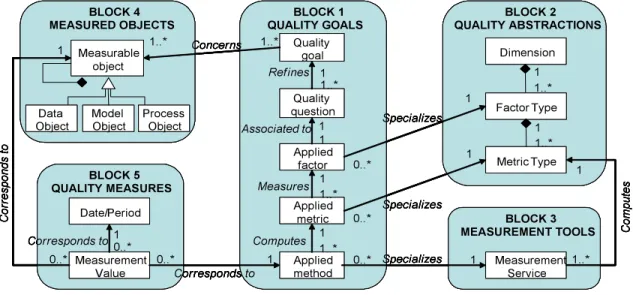
The core of the approach is a quality assessment meta-model, which allows understanding and reasoning about quality concepts. Figure 2 gives a synthesized picture of this meta-model.
The central block (Block 1) deals with quality goals following the GQM approach. Quality goals represent high-level quality needs, which are refined and decomposed into a set of quality questions. The answer to a quality question is defined by choosing and refining a quality factor which best characterizes the question, a set of quality metrics which are appropriate to measure this factor and a set of methods of measurement of this metric. Quality factors and metrics are chosen from a library of generic quality concepts (Block 2 of the meta-model); measurement methods are chosen from a library of available quality tools (Block 3 of the meta-model) and bound to the corresponding IS objects (Block 4 of the meta-model). The second block constitutes an extensible library of abstract data types which will be used to characterize specific quality goals. The main abstractions are: quality dimensions which capture a high-level facet of data quality, quality factors which represent particular aspects of quality dimensions and quality metrics which are the instruments used to measure quality factors. The third block constitutes a library of quality tools. It is decoupled from the second block in order to manage a large collection of external tools, listed in a service registry. The fourth block refers to the information system model and to
the processes that operate on the instances of this model. Each object type being either a datum, a model or a process, is called a measurable object if it is subject to a qualitative evaluation within a quality goal. The fifth block deals with quality measures that are necessary for evaluating quality questions and diagnosing quality. Measurement values represent the result of executing a measurement method (for evaluating a quality goal), for a measurable object, at a given instant or during a period of time. Results of successive quality measurements serve to analyze behaviors and trends of the measured objects. Generally, improvement actions are decided based on this analysis. A detailed description of the meta-model can be found in [7].
Figure 2 - Quality assessment meta-model
3.2
A generic multidimensional model for analyzing quality measures
Measurement results (Block 5 of the meta-model) are stored in a star-like database schema which allows the aggregation of measures, the computation of complex indicators or the analysis of correlations among measures. This sub-section describes the storage of measurement results in a multidimensional model and sub-section 4.2 presents the spectrum of analysis techniques provided by this model.
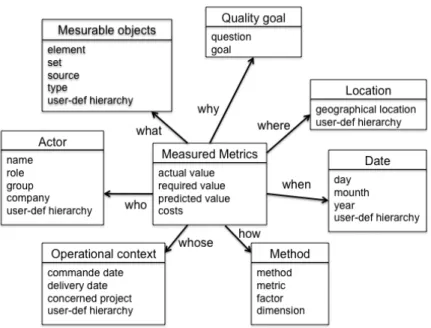
The quality meta-model, presented in Figure 2, explicitly shows that each quality measure is associated to a date (or period), a measurable object of the IS and an applied method. The latter determines quality metrics, factors and dimensions, as well as quality questions and goals. In addition, a context can be derived from the business process (e.g., the project which commanded the quality survey) and user information can be obtained from goals (e.g., who defined each goal).
Figure 3 presents a star schema directly derived from these relationships. A star schema, often used as a relational model for data warehouse design, handles three kinds of concepts: facts corresponding to real-world events to be studied (e.g., electricity consummation, sales), measures corresponding to numeric indicators about facts (e.g., KWatts consumed, sales quantity), and dimensions corresponding to axis of analysis (e.g., dates, customer types, geographical locations). Dimensions are represented in dimension tables containing dimension attributes (e.g., the seven tables in the periphery in Figure 3) and facts are represented in fact tables containing measures and references to dimension tables (e.g., the central table of Figure 3). One or several hierarchies can be associated to each dimension: a hierarchy is a defined data aggregation over the analysis axis. A classical hierarchy concerning the Dates dimension contains several aggregation levels like Day<Month<Quarter<Year (see [18] for details).
Figure 3 - Multidimensional model
The proposed multidimensional schema contains the following dimensions:
– Dates: Indicates when quality measures were taken. This dimension includes the classical day-month-year hierarchy as well as additional user-defined periods. This dimension is particularly important for monitoring data quality evolution in time.
– Measurable objects: Indicates what is measured, i.e., which objects are examined for computing their quality. The main hierarchy consists of elements (e.g. cells in a table or attributes of a model entity), sets (sets of cells, e.g. tables, table attributes, entities, packages) and sources (e.g. database, model and application). A secondary hierarchy indicates the type of object (data, model or process). Other hierarchies can be introduced for grouping objects according to domain-specific relationships.
– Quality methods: precises the measurement method used for quality evaluation. The dimension hierarchy corresponds to blocks 2 and 3 of the meta-model (method, metric, factor and dimension). – Quality goals: Indicates why these measures were taken, i.e., the purposes of quality analysis. The
dimension hierarchy corresponds to blocks 1 of the meta-model (goal, question).
– Locations: Indicates, if any, the geographical location to which measures are associated to. This location is generally deduced from measurement objects, for example, a datum representing the electricity consumption of a house can be associated to the geographical location of the house. Location hierarchy is domain-dependent.
– Actors: Gives information concerning actors involved in the quality surveys. An actor can be, for example: (i) the sponsor of the quality survey, (ii) the quality expert who conducts data quality requirements interviews, defines quality goals, chooses quality methods and tools, etc., (iii) the person (or software engineering company) who conducts metrics measurements, (iv) the business actor who points which data to collect in the IS (see the Measurable objects dimension for details) and decides the required and predicted values. Typical hierarchies include role, group and company, but may be personalized for a specific application.
– Operational contexts: Indicates the operational context to which a quality goal is linked (concerning a business problem or business goal). Typical hierarchies contain request date, deliverable date, operational constraints, etc.
The multidimensional schema contains the following measures:
– Actual value: Refers to the quality measure that is actually computed by the measurement method. – Required value: Refers to the quality bounds that are tolerated by users. These bounds are usually
indicated by a business actor when expressing and refining a quality goal. An actual value is said to be good if it does not overflow required values.
– Predicted value: Refers to the quality value that users expect to obtain or the value estimated by other profiling tools. It is generally compared to the actual value in order to reassert or contradict a hypothesis about data quality.
– Costs: Refer to the costs (e.g., money, time, human resources) caused by poor quality objects and assumed by the company. Cost estimation is application-dependent. It may be defined when expressing and refining quality goals. It may include non-quality cost, quality improvement cost, data quality measurement cost [6].
Even though the multidimensional model is quite small and simple, three major problems have to be considered:
1. Additivity. Quality values can be averaged, but in most cases, domain-specific roll-ups are desired. For example, we may use weights for aggregating a value for a quality factor from the values of different quality metrics. Analogously, a quality question may indicate how to aggregate individual quality values in order to answer it. These specialized roll-ups may be different for each type of object, quality factor, goal, location and user. This forces roll-ups to be computed on query time. 2. Dynamic dimensions. As previously discussed, many dimensions should be analyzed by
user-defined hierarchies (having varied complexity and size). An implementation of the model must support the management of dynamic dimensions.
3. Amount of data. As several quality measures may be taken for individual data elements (e.g., each cell of a table), storage constraints have to be taken into account.
3.3
Business Intelligence Chain for Data Quality
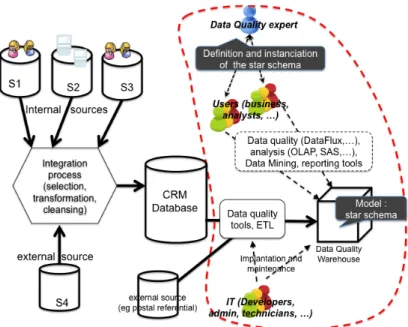
Star-like database schema presented in previous sub-section is part of a more global architecture around data quality monitoring. In fact, given a database, our goal is to be able to implement a data quality warehouse containing quality measures stored in an implementation of our star-like database schema. As external referential sources are needed (e.g., postal referential, thresholds defined by business actors, etc.), our solution can be seen as part of a simple Business Intelligence Chain for Data Quality, called DQBIC in
the following, illustrated in Figure 4. Note that the chain described in Figure 4 is simplified, as views over the data quality warehouse can be defined with respect to users’ needs (implementation of views can be made in the database management system and/or in reporting tools connected to the data warehouse). Such a solution, of course, brings several questions around the definition of data quality requirements (during the design phase of the DQBIC). This problem was partially discussed in Section 2 introducing a new actor: the data quality expert that supervises the data quality requirements elicitation phase. Our approach provides a more technical-colored skill to the data quality expert for two reasons:
1. As our goal is the implementation of a BI chain leading to a data quality warehouse, data quality expert works closely with the IT division: he/she must understand some concepts of development process in order to define the data warehouse with the IT (e.g., via the definition of UML diagrams).
2. The data quality expert also supports the IT division in some technical choices during the implementation phase (in particular, for choosing ETL tools or data quality softwares, for software configuration choices like parameters for de-duplication algorithms, etc).
Figure 4 - Business Intelligence Chain for Data Quality (DQBIC)
4
I
LLUSTRATION OF THE APPROACH IN A
CRM
APPLICATION
In this section we present the instantiation of the quality meta-models presented above for a CRM application at EDF, in particular in its Research and Development Division (EDF R&D).
As presented in Section 2, the operational goal of our scenario is to produce the largest possible set of contacts ensuring that the number of wrong calls is minimal. In order to achieve this goal, the customers having an active contract in 2007 are first identified and checked to make sure that they are individuals and not companies. For each of these customers, the information about the corresponding energy load curves is considered and only the customers with a complete history of load curves are kept. The information about the clients is then controlled (e.g., phone numbers or customer price code), and the consistency between the invoices corresponding to this customer and the records of consumed energy is checked. The size of the resulting set has to be above a certain threshold set by experts in order to be a meaningful basis for the survey. The sponsor of this quality survey is the marketing service. We used this scenario to instantiate the multidimensional meta-model described in Section 3.2.
4.1
Multidimensional model instantiation
The method described in Section 3, allows us to define an instantiation of the multidimensional model. In order to achieve the operational goal (producing the largest possible customers dataset that minimizes wrong calls), we define the following quality goals:
– G1: Checking that customers’ contact information is good enough for marketing requirements – G2: Checking that customers’ energy load curve has a sufficiently complete and coherent history Six quality questions are defined in order to refine both quality goals; they are listed in Table 1. The first question deals with the need of isolating individual customers from companies; this information is not always available in source databases and leads to wrong classifications of customers. Questions Q1.2 and Q1.3 are concerned with the validity of customers’ information. Question Q1.4 aims at quantifying the portion of clients that are taken into account. Question Q2.1 deals with the availability of data for computing the history of customers’ energy load curves in a given period. The last question aims at
verifying the coherence of energy load information. We instantiate the Quality goals dimension with these values.
Goal Question
Q1.1: Have customers an ongoing contract? Are they individuals or companies? Q1.2: Are customers’ phone numbers valid?
Q1.3: Are customers’ contracts valid? G1
Q1.4: Are all the individual customers present in the resulting set?
Q2.1: Which are the clients with complete recorded history of consumed loads of energy? G2
Q2.2: Are the invoice and the consumed load of energy consistent? Table 1 - Instantiation of the Quality goals
Quality questions are declined in terms of quality dimensions and quality factors of our meta-model. A set of eight quality metrics were defined for answering each question, and a set of measurement methods were used for assessing such metrics, as illustrated in Table 2. The concerned quality factors are described in Table 3.
Quest. Factor Metric Method
QM1: Ratio of individuals among the
customers
Comparing customer information with companies’ directories Q1.1 Semantic correctness (accuracy)
QM2: Ratio of records that are unlikely to be
individuals
Checking that the denomination neither contains usual status (Ms, Mrs…) nor legal enterprise status (Group, Holding, Corp….) Q1.2 Syntactic correctness
(accuracy)
QM3: Ratio of phone numbers having the
required format
Method provided by the DataFlux tool
Q1.3 Syntactic correctness (accuracy) QM4: Ratio of customers with a valid tariff
code in their contract
Comparison of the attribute to the content of a dictionary
Q1.4 Coverage (completeness)
QM5: Difference between the expected
number of customers and the size of the resulting set
Counting the total of customers and computing the difference
Density (completeness)
QM6: Ratio of NULL energy load values for
each customer’s record SQL query on the database Q2.1
Coverage (completeness)
QM7: Number of records of energy load for
each customer SQL query on the database Q2.2 Consistency
(accuracy)
QM8: Ratio of customers for which the
difference between invoice and consumed energy load exceeds a threshold
Queries on the database Table 2 - Instantiation of the Quality Methods
Factor Description
Coverage Describes whether all required entities are present in the IS [14]
Density Describes whether all data values are present (not null) for required attributes [14] Semantic correctness Describes how well data represent states of the real-world [24]
Syntactic correctness Expresses the degree to which data is free of syntactic errors such as misspellings and format discordances [12]
Consistency Expresses the degree to which data satisfies a set of integrity constraints [20] Table 3 – Quality factors
The measurable objects dimension in our scenario follows the classical element-set-source hierarchy, where element represents a table cell (a value of a record describing a customer), set represents a table attribute and source represents the source database where data was extracted from. Several operational and external databases are used as sources. The accessed tables and attributes depend on the quality metrics to be computed, for example, for quality metric QM2, we access to two attributes of the Customers table of a given source (namely civility and name). A user-defined hierarchy enables aggregating elements by customer and type of customer.
The Location dimension is instantiated with a user-defined hierarchy, consisting of France geographical locations and EDF-defined zones.
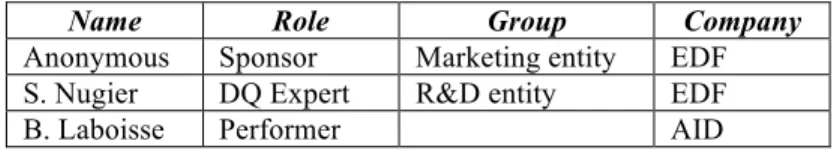
Three major actors are involved in this survey: a sponsor (from the EDF marketing service), a data quality expert (from the EDF R&D entity) and an external performer (from the AID company). We instantiate the Actors dimension with these values, as illustrated in Table 4. These actors are common to all quality metrics.
Name Role Group Company
Anonymous Sponsor Marketing entity EDF S. Nugier DQ Expert R&D entity EDF B. Laboisse Performer AID
Table 4 - Instantiation of the Actors
The Operational context dimension is instantiated with information about the concerned quality survey (sponsored by the marketing service). Finally, the Date dimension is instantiated with all dates in the analyzed period (2007).
The crossing of previous dimensions corresponds to a set of facts that are stored in the fact table. We register four measures: actual quality value, required quality value, predicted quality value and, when possible, the non-quality cost. A non-quality cost is usually difficult to measure in terms of monetary and human costs but it can be expressed in terms of custom indicators, for example, the number of NPAI4 (return to sender) for incorrect postal addresses.
The Date dimension allows us to store these values for different moments in time and thus to follow their evolutions in time. This is a good way to detect impacts of an improvement action or, more generally, of an IS modification (new source addition, conceptual model modification, etc).
In addition, the source attribute of the Measurable Object dimension allows us to compare quality measures per data source. It can help to improve the CRM database feeding process either by choosing most reliable sources or detecting data feed problems.
Among all analyses proposed in Section 4.2, EDF is especially interested in being able to perform quality diagnosis and IS improvement recommendation. For example, if phone numbers are almost all invalid in a specific table, this could mean that the data feeds process and/or the schema have to be re-examined. Other key studies are the correlation of the operational context to quality measures and costs (e.g., the biggest quality measurement costs are often associated to one sponsor) and the evolution of measured values (quality measures or data management indicators).
4.2
Advanced analysis of quality metrics
The rationale of the multidimensional quality model is threefold: First, it has been designed for the purpose of quality exploration including various analytic tasks based on the computed metrics. Second, it can be used for scoring data with respect to user-defined or application-driven quality requirements and prioritizing tasks for quality improvement. Finally, it can be used for quality prediction and forecasting:
1. Quality exploration includes three tasks described as follows:
– Quality diagnosis: once the metrics are computed and thus instantiate the multidimensional model, the quality diagnosis task can be achieved by browsing among quality measures and indicators in order to diagnose, visualize and understand the quality of the information system, both at the instance (data quality) and schema levels (model quality),
– Metric selection: based on the data quality cube displayed by the multidimensional model, the metric selection task allows the user to experimentally compare a variety of metrics in order to choose the most appropriate ones for highlighting a suspected or known phenomenon.
– Metric correlation: the metric correlation task analyzes the relationships between the various stored quality measures or instantiated quality factors.
2. Quality scoring includes two tasks described as follows:
– Data recommendation: based on the highest quality measures computed from the data managed by the IS, the data recommendation task provides and associates quality guarantees to the data queried by the users.
– Task recommendation: based on the lowest quality measures computed from the data, the model and the system, the task recommendation provides priorities for scheduling cleaning and corrective actions to improve overall quality of the IS.
3. Quality prediction aims at computing the trend and forecasting IS quality over time based on the history of quality measures and input prediction models.
Among all these analyses, EDF is especially interested in being able to perform quality diagnosis and IS improvement recommendation. For example, if phone numbers are almost all invalid in a specific table, this could mean that the data feeding process and/or the schema have to be re-examined. Other key studies are the correlation of the operational context to quality measures and costs (e.g., the biggest quality measurement costs are often associated to one sponsor) and the evolution of measured values (quality measures or data management indicators).
4.3
Technical choices
Several open-source and third-party tools are used for the measurement of data quality and the construction of the multi-dimensional model. These tools include data quality tools, such as DataFlux5, Informatica Data Quality6 and BDQS7, and extraction, transformation and loading (ETL) tools, such as Informatica Power Center8, Talend9 and Kettle10. We point the reference [9] that presents an evaluation framework for data quality tools, which is used at EDF for data quality tools choices.
In order to perform analysis over data quality measures, data stored in the multidimensional model can either be accessed by statistical tools (e.g., SAS11, R12) or delivered to users via reporting tools (e.g., OLAP reports13 like Microsoft Analysis Services14). These tools naturally plug on a star-like schema. This architecture enables:
– sophisticated statistical calculus,
– the creation, management and delivery of traditional, reports and interactive Web-based forms, – the implementation of automatic alerts (e.g., if an actual value overflows a required value).
5 DataFlux. http://www.dataflux.com/
6 Informatica Data Quality. http://www.informatica.com/products_services/data_quality 7 BDQS. http://www.bdqs.com/
8 Informatica Power Center. http://www.informatica.com/products_services/powercenter 9 Talend: http://www.talend.com
10 Kettle: http://kettle.pentaho.org/ 11 SAS. http://www.sas.com/ 12 R. http://www.r-project.org/
13 The OLAP Report. http://www.olapreport.com/
5
R
ELATED WORK
The topic of information quality has increasingly generated many research works. It is a very interesting domain balancing various research works [23], challenging theoretical issues for which formalization is more and more needed, and practical solutions where the domain expertise and pragmatic guidelines are crucial [6,20] for understanding and improving information quality. Data quality is a crucial problem in companies and organizations, where investments for the IS must be justified, appreciated, and re-evaluated day after day in conjunction with the costs associated to data quality. Comprehensive surveys on data quality can be found in [4, 5, 15]. Data quality is generally described through a large set of quality dimensions, attributes or factors. Literature aims at defining quality factors and metrics [24, 20], proposing quality models including these factors and metrics [21, 10], enabling the quantitative evaluation of quality factors [16, 13], proposing taxonomies of factors and metrics [23, 12], and so on. Several research projects propose methodologies and experience recommendations for dealing with quality assurance in business information systems (e.g., The Total Data Quality Management (TDQM) [23], The Total Quality data Management (TQdM) system that evolved into The Total Information Quality Management (TIQM) Quality System [6]). More recently, several research projects have proposed quality assessment and improvement techniques in database and data warehousing systems (e.g., DWQ [10], DaQuinCis [22], Trio [25]). Our meta-model can be related to the DWQ meta-model regarding Quality Abstractions (see Block 2 in Figure 2) but it notably extends the aforementioned one since it supports and refines the whole quality measurement process. It is also currently instantiated and tested in various operational contexts [2]. Very few papers mention experimentations and/or validations on the measurement of quality factors. We claim that data quality factors are not independent from each others; this leads to a real difficulty to define a limited set of metrics to be computed in order to assess or target a given data quality level. The meta-model we proposed in our project aims at supporting this specific analysis of interdependencies among data quality factors.
In software engineering, quality models are mainly hierarchical, thus allowing a structured approach of quality. Relatively few papers mention non-hierarchical models. Let us mention (i) the quality cube model, based on three dimensions: Users/clients, Product/Process and Efficiency/Effectiveness [19], (ii) the star model, containing three significant elements: the procurer, the producer and the product, is not structured in a multidimensional form. It is interesting in the way it presents multiple viewpoints [8], (iii) the multidimensional model for web-based applications quality, based on three dimensions: application domain (e-learning, e-commerce, etc.), lifecycle processes (development, exploitation, maintenance) and quality characteristics (functionality, reliability, usability, etc.). It aims at assessing the quality of applications depending on their respective domains [11]. To the best of our knowledge, there exist no multidimensional model gathering the main dimensions of quality and the different ways to measure it even in software design and engineering. This paper is a step forward in this direction.
6
C
ONCLUSION
This paper presented an approach integrating data quality into a business intelligence chain for measuring and analyzing data quality. The main contribution of this paper is the definition of a generic multi-dimensional star-like model for storage, analysis and capitalization of data quality measurements. The paper also illustrates how this star-like model can be instantiated and used in a data quality business intelligence chain at EDF. We believe that small adaptations have to be made in order to use this model for another specific application. For the sake of the presentation, our approach has been illustrated and simplified from the CRM information system of EDF, implementing data quality as a part of the business intelligence chain conducted by EDF data quality experts.
Further research will be conducted to validate the predictive approach. This requires complete quality values (i.e., the actual, required and predicted values), the application of the predictive model based on these values and then perform quality measurements to validate the predicted values.
The intensive population of the elaborated model with measures is on-going in order to conduct specific statistical analysis to detect dependencies and trends between quality factors and manage quality goals evolution.
ACKNOWLEDGEMENTS
This research was supported by the ANR ARA Masses de Données Program (2005-2008), “Grant ARA-05MMSA-0015” (QUADRIS project).
R
EFERENCES
[1] Agosta L. 2000. Definitions of Data Quality, IdeaByte, July 14, 2000.
[2] Akoka, J., Berti-Equille, L., Boucelma, O., Bouzeghoub, M., Comyn-Wattiau, I., Cosquer, M., Goasdoué-Thion, V., Kedad, Z., Nugier, S., Peralta, V. and Sisaid-Cherfi, S. 2007. A Framework for Quality Evaluation in Data Integration Systems. 9th International Conference on Enterprise Information Systems (ICEIS’2007).
[3] Basili, V., Caldiera, G. and Rombach, H.D. 1994. The Goal Question Metric Approach. Encyclopedia of Software Engineering, 528-532, John Wiley & Sons, Inc.
[4] Batini C. and Scannapieco, M. 2006. Data Quality: Concepts, Methodologies, Techniques, Springer Verlag.
[5] Berti-Équille L. 2007. Quality Awareness for Data Managing and Mining, Habilitation à Diriger des Recherches, Université de Rennes 1, Juin 2007 (Chapter 1), http://www.irisa.fr/Laure.Berti-Equille/Habilitation-Laure-Berti-Equille.pdf
[6] English L. 1999. Improving data warehouse and business information quality: methods for reducing costs and increasing profits, John Wiley & Sons, Inc.
[7] Etcheverry, L., Peralta, V. and Bouzeghoub, M. 2008. Qbox-Foundation: a Metadata Platform for Quality Measurement. In proceeding of the 4th Workshop on Data and Knowledge Quality (QDC’2008).
[8] Fitzpatrick R. 1996. Software Quality: Definitions and Strategic Issues, Staffordshire University, School of Computing Report.
[9] Goasdoué, V., Nugier, S., Duquennoy, D. and Laboisse, B. 2007. An evaluation framework for data quality tools, 2007. In Proceedings of the International Conference for Information Quality, 2007 (ICIQ'07).
[10] Jarke, M. and Vassiliou, Y. 1997. Data Warehouse Quality: A review of the DWQ project. Proc. of the 2nd Conf. on Information Quality (IQ’1997).
[11] Malak, G., Badri, L., Badri, M. and Sahraoui, H. 2004. Towards a Multidimensional Model for Web-Based Applications Quality Assessment. K. Bauknecht, M. Bichler, B. Pröll (Eds.): EC-Web 2004, LNCS 3182.
[12] Naumann, F., Leser, U. and Freytag, J.C. 1999. Quality-driven Integration of Heterogeneous Information Systems. Intl. Conf. on Very Large Databases (VLDB'99), Edinburgh, Scotland [13] Naumann, F. and Rolker, C. 2000. Assessment methods for Information Quality Criteria.
[14] Naumann, F., Freytag, J.C. and Leser, U. 2003. Completeness of Information Sources. Int. Workshop on Data Quality in Cooperative Information Systems (DQCIS’03), Siena, Italy. [15] Peralta, V. 2006. Data Quality Evaluation in Data Integration Systems. PhD thesis, Université
de Versailles, France and Universidad de la República, Uruguay. http://tel.archives-ouvertes.fr/docs/00/32/51/39/PDF/these.pdf.
[16] Pipino, L.L., Lee, Y.W. and Wang, R. 2002. Data Quality Assessment. Communications of the ACM, 45(4), 2002.
[17] QUADRIS project. 2009. Quality of Data and Multi-source Information Systems. http://deptinfo.cnam.fr/xwiki/bin/view/QUADRIS
[18] Ramakrishnan, R. and Gehrke J. 2008. Database Management Systems (Third edition). McGraw Hill Higher Education. ISBN 978-0072465631.
[19] Rawashdeh A. and Matalkah B. 2006. A New Software Quality Model for Evaluating COTS Components, Journal of Computer Science, 2(4).
[20] Redman, T. 1996. Data Quality for the Information Age. Artech House Inc.
[21] Strong, D., Lee, Y. and Wang, R. 1997. Data Quality in Context. Communications of the ACM, 40(5), May 1997.
[22] De Santis, L., Scannapieco, M. and Catarci, T. 2003. Trusting Data Quality in Cooperative Information Systems. Proc. of CoopIS’2003, OTM Confederated International Conferences. [23] Wang, R.Y., Storey, V.C. and Firth, C.P. 1995. A Framework for Analysis of Data Quality
Research. IEEE Trans. Knowl. Data Eng., 7(4), 623-640.
[24] Wang, R. and Strong, D. 1996. Beyond accuracy: What data quality means to data consumers? J. on Management of Information Systems, Vol. 12 (4):5-34, 1996
[25] Widom, J. 2005. Trio: A System for Integrated Management of Data, Accuracy, and Lineage. Proc. of 2nd Biennial Conference on Innovative Data Systems Research.