HAL Id: tel-01428908
https://tel.archives-ouvertes.fr/tel-01428908
Submitted on 6 Jan 2017HAL is a multi-disciplinary open access
archive for the deposit and dissemination of sci-entific research documents, whether they are pub-lished or not. The documents may come from teaching and research institutions in France or abroad, or from public or private research centers.
L’archive ouverte pluridisciplinaire HAL, est destinée au dépôt et à la diffusion de documents scientifiques de niveau recherche, publiés ou non, émanant des établissements d’enseignement et de recherche français ou étrangers, des laboratoires publics ou privés.
Frequencies
Laura Pometcu
To cite this version:
Laura Pometcu. Innovative materials and forms for attenuation at Hyper Frequencies. Electronics. Université Rennes 1, 2016. English. �NNT : 2016REN1S044�. �tel-01428908�
THÈSE / UNIVERSITÉ DE RENNES 1
sous le sceau de l’Université Bretagne Loire
pour le grade de
DOCTEUR DE L’UNIVERSITÉ DE RENNES 1
Mention : Traitement de signal et Télécommunications
Ecole doctorale Matisse
présentée par
Laura Pometcu
Préparée
à l’unité de recherche IETR (UMR CNRS 6164)
Institut d’Electronique et de Télécommunications de Rennes
Université de Rennes 1
Matériaux et formes
innovants pour
l'atténuation en
Hyper Fréquences
Thèse soutenue à Rennes
le 8/09/2016
devant le jury composé de :
Valérie VIGNERAS
Professeur des Universités, Bordeaux INP / rapporteur
Xavier BEGAUD
Professeur à TELECOM ParisTech / rapporteur
Philippe POULIGUEN
Responsable du Domaine Scientifique « Ondes Acoustiques et Radioélectriques » - DGA / examinateur
Marc HELIER
Professeur des Universités, Université Pierre & Marie Curie / examinateur
Vincent LAUR
Maître de Conférences à l'Université Bretagne Occidentale / examinateur
Pierre BRUGUIERE
Ingénieur chercheur à CEA Gramat / examinateur
Ala SHARAIHA
Professeur à l'Université de Rennes 1 - IETR / directeur de thèse
Ratiba BENZERGA
Maître de Conférences à l'Université de Rennes 1 / co-directeur de thèse
"If you can't explain it simply, you don't understand it well enough."
The work presented in this manuscript was carried out at Institute of Electronics and Telecommunications of Rennes with the financial support of the Direction Générale de l'Armement (DGA).
First I would like to present my gratitude to Prof. Valérie Vigneras and Prof. Xavier Begaud for doing me the honor to be rapporteurs of my PhD thesis. I appreciated the precise and efficient reviewing of the manuscript that helped me improve my thesis. I would like also to thank Prof. Marc Helier who has agreed to be the president of my thesis committee and I am deeply grateful to all jury members, namely, Dr. Pierre Bruguiere, Dr. Vincent Laur and Dr. Philippe Pouliguen, for agreeing to read the manuscript.
I would like to express my sincere gratitude to my supervisor Prof. Ala Sharaiha for his continuous support of my PhD study and research, for his patience, motivation, and immense knowledge. I could not have imagined having a better advisor and mentor for my PhD study.
Besides, I would like to thank my co-supervisor Dr. Ratiba Benzerga, an extraordinary person who helped me resolve problems. Without her guidance and persistent help this thesis would not have been possible.
I express my gratitude to Dr. Philippe Pouliguen for his insightful comments and encouragement which helped me broaden my knowledge.
I am also grateful for all the support that I've received from all the members from the lab: especially Prof. Eric Pottier, the IETR director, the secretaries and mechanics that without their help I wouldn't have been able to get this far.
In my daily work I've been blessed with having friendly colleges at National Institute of Applied Sciences of Rennes, especially Mister Jean-Marie Floch and Mister Jerome Sol that helped me with my measurements and provided me with all the materials needed so that I can obtain accurate results.
I thank my fellow lab mates for all the fun we have had in the last three years. Also I want to thank all my friends who inspired me and supported me all this time. Special thanks go to Chloé Mejean, a wonderful colleague who always helped me even if it went beyond her call of duty.
Last but not least, I would like to thank my family, especially my mother for supporting me spiritually throughout writing this thesis and in life in general.
I dedicate this thesis to them.
7 Quote 3 Acknowledgments 5 Contents 7 Acronyms 11 List of Tables 13 List of Figures 15
Introduction
25
1. Material Characterization in a Non-anechoic Environment
29
1.1 Introduction... 29
1.2 Methods of material characterization in literature... 29
1.3 The characterization techniques used in this work... 31
1.3.1 Waveguide measurement technique... 31
1.3.2 Open ended coaxial probe method... 33
1.3.3 Free-space method... 35
1.3.3.1 Monostatic and bistatic measurements... 36
1.4 A proposed method for material characterization in a non-anechoic environment... 39
1.4.1 Proposed approach and measurement setup... 40
1.4.2 Permittivity extraction... 42
1.4.3 Measurement results... 43
1.4.3.1 Teflon... 43
Time gating technique... 44
Mean value technique... 45
1.4.3.2 Commercial absorbing material... 48
1.5 Conclusion... 51
2
New Rigid Composite Materials for Anechoic Chamber Applications
53
2.1 Introduction... 532.2 Absorber materials composition... 53
2.3 New absorber material... 57
2.3.1 Absorber material composition... 57
2.3.2 Elaboration method... 57
2.4 Characterization results of the epoxy composite absorbers... 58
2.4.1 Non-anechoic environment technique... 63 2.5 Pyramidal absorber prototype based on the epoxy foam loaded with carbon
fibers... 65
2.5.1 Simulation results... 65
2.5.2 Prototype characterization... 67
2.6 Ideal absorber material... 74
2.7 Conclusion... 79
3. Absorber Geometry Optimization for Anechoic Chambers
81
3.1 Introduction... 813.2 Standard absorber shapes used in anechoic chambers... 81
3.2.1 Twisted pyramidal absorber... 81
3.2.2 Double pyramidal absorber... 82
3.2.3 Hollow pyramidal absorber... 82
3.2.4 Cylinder pyramidal absorber... 83
3.2.5 Triangular pyramidal absorber... 83
3.2.6 Hexagonal pyramidal absorber... 84
3.2.7 Convoluted microwave absorber... 84
3.2.8 Pyramidal absorber... 85
3.2.9 Truncated pyramidal absorber... 87
3.2.10 Wedge microwave absorber... 88
3.2.11 Oblique wedge microwave absorber... 88
3.2.12 Wedge arrays... 89
3.3 Comparison in between the different shapes using commercial materials... 89
3.4 Optimization of the wedge absorber geometry... 92
3.4.1 Introduction and state of art... 92
3.4.2 Absorber optimization... 94
3.4.2.1 Optimized wedge geometry concept 1... 94
3.4.2.2 Optimized wedge geometry concept 2... 98
3.4.2.2.1 Simulation results... 99
Used material: epoxy foam loaded with 0.5% carbon fibers... 99
Used material: commercial material ECCOSORB LS 24... 104
3.4.2.3 Optimized wedge geometry concept 3... 105
3.5 Optimization of pyramidal geometry using genetic algorithm... 108
3.6 Optimization of hexagonal geometry... 111
3.6.1 Prototype of the optimized shape... 116
3.6.1.2 Measurement results... 119
3.7 Conclusion... 121
4. Optimization of Microwave Absorbers Using Metamaterials
123
4.1 Introduction... 1234.2 Metamaterial types and their association with natural absorber materials... 123
4.3 Metamaterial structure... 126
4.3.1 Geometry of the metamaterial... 126
4.3.2 Influence of the size of the metamaterial... 135
4.3.3 Measurement results... 137
4.3.4 Absorber associated with metamaterial... 141
4.3.5 Symmetrical metamaterial... 151 4.4 Broadband metamaterial... 158 4.5 Conclusion... 163
General conclusion
165
Perspectives... 167Annexes
169
A. Electromagnetic wave propagation in lossy multilayer structures... 169A.1 Reflection coefficient for a single dielectric slab... 170
A.2 Reflection coefficient for two dielectric slabs... 172
A.3 Infinite number of layers... 173
A.4 Reflection and transmission coefficients for propagation at oblique incidence... 174
A.4.1 Total transmission and Total reflection... 175
A.4.1.1 Total transmission... 175
A.4.1.2 Total reflection... 176
B. Review of material characterization techniques... 177
B.1 Introduction... 177
B.2 Characterization of ε... 177
B.3 Characterization of μ... 179
C. Nicolson - Ross - Weir (NRW) method... 181
Communications and publications
183
11
1D One-dimensional
APM Absorbeur Pyramidaux (Pyramidal Absorber)
CNT Carbon NanoTubes
CP Conducting Polymers
CST Computer Simulation Technology
EM Electromagnetic
EMC Electromagnetic Compatibility
EMI Electromagnetic Interference
FSS Frequency Selective Surface
GA Genetic Algorithm
HPBW Half Power Beam Width
IMA Interleaved Metamaterial Array
MMA Microwave Material Absorber
MUT Material Under Test
MUT - MP Material Under Test - Metallic Plate
NRL Naval Research Laboratory
NRW Nicolson - Ross - Weir
OSLT Open, Short circuit, Load and Through line
PEC Perfect Electric Conductor
PU Polyurethane
PS Polystyrene
RCS Radar Cross Section
RF Radio Frequency
SiC Silicon Carbide
TE Transverse Electric
TEM Transverse Electromagnetic
TGM Time Gating Method
TM Transverse Magnetic
UV Ultraviolet
UWB Ultra Wideband
13
TABLE 1.1 Waveguide specifications depending on frequency [8]... 32
TABLE 3.1 Comparison in between different geometries used in anechoic chambers for the size X1... 90
TABLE 3.2 Comparison in between different geometries used in anechoic chambers for the size APM12... 91
TABLE. 3.3 Sizes of the commercial wedges... 95
TABLE. 3.4 Dimensions of the optimized wedge... 106
TABLE. 3.5 Dimensions of the optimized pyramid... 108
TABLE. 3.6 Sizes of the new shape... 111
TABLE 3.7 Pyramid dimensions... 114
TABLE 4.1 Sizes of the pyramidal shapes... 141
15
FIG. 1.1 Summary of techniques for material characterization a) depending on the frequency
and losses and b) comparison in between methods... 30
FIG. 1.2 Calibration for waveguide... 31
FIG. 1.3 S parameters: a) Magnitude and b) Phase for a Teflon sample of 9.7 mm thickness with the permittivity r=2.1-j0.02 and permeability μr=1.00-j0.001... 32
FIG. 1.4 Complex parameters of the Teflon sample: a) Real part of the permittivity, b) Imaginary part of the permittivity, c) Real part of the permeability and d) Imaginary part of the permeability... 33
FIG. 1.5 Illustration of the coaxial probe setup... 33
FIG. 1.6 Coaxial probe used... 34
FIG. 1.7 Open ended coaxial probe real part of the permittivity measurement for a Teflon material sample... 34
FIG. 1.8 a) Reflection mode configuration, b) Transmission mode configuration………... 36
FIG. 1.9 a) Monostatic and b) Bistatic measurements... 37
FIG. 1.10 Measurement results obtained using the monostatic and bistatic method... 37
FIG. 1.11 Arc length approximations... 38
FIG. 1.12 a) Frequency domain response for a Teflon material sample, b) Time domain response, c) Frequency domain response for a Teflon material sample after using TGM, d) Time domain filtered response... 38
FIG. 1.13 Measurement configuration with the horn antennas... 40
FIG. 1.14 Measurement configurations in a) a multipath environment and b) in anechoic chamber... 41
FIG. 1.15 Reduction of the effect of moving items in a non-anechoic environment: the entire setup is moved but keeping the same distance between the antennas and the sample... 42
FIG. 1.16 a) Measured reflection coefficient in dB for a Teflon material sample in non-anechoic environment compared to simulation before TGM, b) S11 magnitude after applying TGM and c) Phase after applying TGM... 44
FIG. 1.17 a) Measured reflection coefficient in dB for a Teflon material sample backed by a metallic plate in non-anechoic environment compared to simulation before TGM, b) S11 magnitude after applying TGM and c) Phase after applying TGM... 44
FIG. 1.18 Measurement and simulation results of the reflection coefficient a) mean value in red and the superposition of all measurements, b) magnitude and c) phase for a Teflon sample... 46 FIG. 1.19 Measurement and simulation results of the reflection coefficient a) mean value in red
and the superposition of all measurements, b) magnitude and c) phase for a Teflon sample backed with a metallic plate... 47 FIG. 1.20 Permittivity of Teflon... 48 FIG. 1.21 Measured and simulated results for the reflection coefficient of a) ECCOSORB LS 22 without a metallic plate and b) ECCOSORB LS 22 backed with a metallic plate, c) Phase of ECCOSORB LS 22 without a metallic plate and d) Phase of ECCOSORB LS 22 backed with a metallic plate... 49 FIG. 1.22 Permittivity of Commercial foam ECCOSOLB LS 22... 50 FIG. 1.23 Losses for the absorbing commercial material ECCOSORB LS 22... 50 FIG. 2.1 Different forms of carbon used for absorber materials: a) particles, b) fibers and c) nanotubes [52]... 54 FIG. 2.2 a) Multilayer absorber [70] and b) Commercial multilayer absorber (ECCOSORB-AN) [77]... 56 FIG. 2.3 a) PS based pyramidal absorbers [81] and b) Rice husk based pyramidal absorbers [87]... 56 FIG. 2.4 a) The mixture composite put in the mold and b) the mixture composite after foaming step... 58 FIG 2.5 Representation of the air holes inside the material samples... 59 FIG. 2.6 Material samples for free space measurement depending on the carbon loading... 59 FIG. 2.7 Photo of measurement configuration for normal incidence in anechoic chamber of IETR localized at INSA, Rennes, France... 59 FIG.2.8 Simulated and measured reflection coefficient with and without metallic plate, permittivity, tan and skin depth extracted from the anechoic chamber measurement of the unloaded epoxy foam (0% wt.)... 60 FIG.2.9 Simulated and measured reflection coefficient with and without metallic plate, permittivity, tan and skin depth extracted from the anechoic chamber measurement of the epoxy foams loaded with carbon fibers a) 0.25% wt., b) 0.5% wt., c) 0.75% wt. d) 1% wt. and e) Permittivity and losses comparison for all load rate composites... 61 FIG. 2.10 Measured and simulated results for the reflection coefficient of the a) foam without a metallic plate mean value, b) foam without a metallic plate, c) foam backed with a metallic plate mean value and d) foam backed with a metallic plate... 64 FIG. 2.11 Permittivity of the Polymer foam loaded with 0.25% wt. carbon fibers... 65 FIG. 2.12 Size of the pyramidal geometry... 65 FIG. 2.13 Simulated reflection coefficients of the APM12 geometry with properties of the epoxy foams loaded with different rates of carbon fibers (0.25% wt., 0.5% wt., 0.75% wt. and 1% wt.) for a) normal incidence 00, b) oblique incidence of 300 and c) oblique incidence of
450... 66 FIG. 2.14 Simulated reflection coefficients of the APM12 geometry with the SIEPEL material (G1) and 0.5% wt. carbon fibers loaded epoxy foam for a) normal incidence 00, b) oblique incidence of 300 and c) oblique incidence of 450... 67 FIG. 2.15 a) Absorber prototype made of pyramidal epoxy foam loaded with 0.5% carbon fibers and b) APM12 commercial absorber made of G1 material... 68 FIG. 2.16 Measurement setup in the anechoic chamber for the pyramidal prototypes made of a) 0.5% wt. carbon fibers loaded epoxy foam and b) SIEPEL commercial material G1... 68 FIG. 2.17 Measurement results of APM12 geometry prototypes made with the SIEPEL PU foam (G1) and the 0.5% wt. carbon fibers loaded epoxy foam at a) normal incidence and b) oblique incidence 300... 69 FIG. 2.18 CHEOPS Anechoic chamber of CELAR (DGA), France... 69 FIG. 2.19 Radar cross section of the metallic plate for a) horizontal polarization and b) vertical polarization and SIEPEL absorber for c) horizontal polarization and d) vertical polarization and for the 0.5% carbon fibers loaded epoxy foam prototype for e) horizontal polarization and f) vertical polarization... 70 FIG. 2.20 Reflection coefficient of the prototypes made of a) SIEPEL absorber for horizontal polarization, b) SIEPEL absorber for vertical polarization, c) 0.5%wt. carbon fibers loaded epoxy for horizontal polarization and d) 0.5%wt. carbon fibers loaded epoxy for vertical polarization... 71 FIG. 2.21 Calculated reflection coefficient (from RCS measurements) for SIEPEL absorber and for the epoxy prototype for a) normal incidence and horizontal polarization, b) normal incidence and vertical polarization, c) oblique incidence of 30° and horizontal polarization, d) oblique incidence of 30° and vertical polarization, e) oblique incidence of 45° and horizontal polarization, d) oblique incidence of 45° and vertical polarization... 72 FIG. 2.22 Single dielectric slab... 74 FIG. 2.23 Study as a function of the increased losses of epoxy foam loaded with 0.5% carbon fibers... 75 FIG. 2.24 Study as a function of the decreased losses of epoxy foam loaded with 0.5% carbon fibers... 75 FIG. 2.25 Study as a function of the increased permittivity of epoxy foam loaded with 0.5% carbon fibers... 76 FIG. 2.26 Study as a function of the decreased permittivity of epoxy foam loaded with 0.5% carbon fibers... 76 FIG. 2.27 Study as a function of a lower permittivity and increased losses of epoxy loaded with 0.5% wt. carbon fibers... 77
FIG. 2.28 Study us a function of a higher permittivity and increased losses of epoxy loaded
with 0.5% wt. carbon fibers... 78
FIG. 3.1 Geometry of a standard twisted pyramidal absorber... 81
FIG. 3.2 Geometry of a standard double pyramidal absorber... 82
FIG. 3.3 Geometry of a standard hollow pyramidal absorber... 82
FIG. 3.4 Geometry of a standard cylinder pyramidal absorber... 83
FIG.3.5 Geometry of a standard triangular pyramidal absorber... 83
FIG. 3.6 Geometry of a standard hexagonal pyramidal absorber... 84
FIG. 3.7 Geometry of a standard convoluted microwave absorber... 84
FIG. 3.8 Geometry of a standard pyramidal absorber... 85
FIG. 3.9 a) Normal incidence reflectivity performance of pyramidal absorbers, b) Effect of the carbon loading on the performance of the pyramidal absorber [100] and c) Wide-angle performance of pyramidal absorbers [100]... 85
FIG. 3.10 Possible reflection paths from regular pyramids... 87
FIG. 3.11 Geometry of a standard truncated pyramidal absorber... 87
FIG. 3.12 Geometry of a standard wedge microwave absorber... 88
FIG. 3.13 Different wedge arrangements for the absorber... 88
FIG. 3.14 Geometry of a standard oblique wedge microwave absorber... 88
FIG. 3.15 Geometry of a standard wedge arrays absorber... 89
FIG. 3.16 Comparison between the different reflection coefficients at normal incidence for the different geometries X1... 90
FIG. 3.17 Comparison between the different reflection coefficients at normal incidence for the different geometries APM12... 91
FIG. 3.18 a) Initial pyramidal structure and b) Optimized structure... 92
FIG. 3.19 Reflection coefficient of the optimized pyramidal structure [78]... 93
FIG. 3.20 a) Arbitrary curved pyramidal geometry built from 10 truncated linear pyramids and b) Comparison in between a traditional pyramidal absorber (red curve) and the optimized geometry in the frequency range 1 - 2 GHz [106]... 93
FIG. 3.21 Natural evolution... 94
FIG. 3.22 Realization process of the wedge: a) Original commercial wedge, b) Angle cut of the wedge and c) Polarization... 94
FIG. 3.23 Characteristics of the commercial materials a) G1 and b) G2 from Siepel... 95
FIG. 3.24 Comparison in between different cut angles for the commercial a) ADM3 and b) ADM5... 96
FIG 3.25 Simulation results for the commercial wedges using a cut angle of 600 at normal and oblique incidence (450) for a) ADM5, b) ADM9 and c) ADM12... 96
FIG. 3.26 Straight wedge absorber in a) Side view and b) Top view... 98 FIG. 3.27 Characteristic of the epoxy foam... 99 FIG. 3.28 Choosing the best arrangement for the wedges... 100 FIG. 3.29 Influence of the polarization... 100 FIG. 3.30 Proposed optimized wedge geometry... 101 FIG. 3.31 Simulation results at normal incidence for the epoxy foam... 101 FIG. 3.32 Rotation at 450 of the wave around the asymmetrical structure at a) 00, b) 600, c) 1000 and d)1800... 102 FIG. 3.33 Comparison between the original geometry and the optimized one for the epoxy foam at a) Vertical polarization at oblique incidence (300), b) Horizontal polarization at oblique incidence (300), c) Vertical polarization at oblique incidence (450) and d) Horizontal polarization at oblique incidence (450)... 102 FIG. 3.34 Comparison between the original geometry and the optimized one at oblique incidence (300) for phi=00 - 3600 using the epoxy foam material... 103 FIG. 3.35 Comparison between the original geometry and the optimized one at oblique incidence (450) for phi=00 - 3600 using the epoxy foam material... 103 FIG. 3.36 Characteristic of the commercial absorber ECCOSORB LS 24... 104 FIG. 3.37 Simulation results at normal incidence for the commercial material ECCOSORB LS 24... 104 FIG. 3.38 Comparison between the original geometry and the optimized one at oblique incidence (300) for phi=00 - 3600 using the commercial ECCOSORB LS 24 material... 105 FIG. 3.39 Comparison between the original geometry and the optimized one at oblique incidence (450) for phi=00 - 3600 using the commercial ECCOSORB LS 24 material... 105 FIG. 3.40 Original commercial wedge... 105 FIG. 3.41 Size of the optimized wedge... 106 FIG. 3.42 Simulation results for the optimized wedge in comparison with the original wedge at a) Normal incidence, b) Oblique incidence (300) and c) Oblique incidence (450)... 107 FIG. 3.43 Pyramidal geometry chosen... 108 FIG. 3.44 Size of the optimized pyramid... 109 FIG. 3.45 Simulation results for the optimized pyramid (red curve) in comparison with the original pyramid at a) Normal incidence, b) Oblique incidence (300) and c) Oblique incidence (450)... 110 FIG. 3.46 a) Dimensions of the new geometry for APM12, b) Perspective view of the new shape, c) Plan view of the new shape... 111 FIG. 3.47 E-field comparison between pyramid and optimized shape at specific frequencies and different parts of the structures... 112
FIG. 3.48 Comparison in between the simulation results obtained for the new shape (red and blue curves) and the pyramidal form (black curve) using the polyurethane foams G2 and G1 for the sizes a)APM9, b)APM12, c)APM20... 115 FIG. 3.49 TE polarization... 117 FIG. 3.50 TM polarization... 117 FIG. 3.51 Comparison in between the simulation results obtained for the new shape (blue curve) and the pyramidal form (black curve) using the carbon fibers loaded epoxy foam with a)0.25% carbon fibers, b)0.5% carbon fibers, c)0.75% carbon fibers, d)1% carbon fibers... 117 FIG. 3.52 a) Pyramidal shape made of epoxy foam loaded with 0.5% carbon fibers and b) New optimized shape made of epoxy foam loaded with 0.5% carbon
fibers... 119 FIG. 3.53 Measurement setup in the anechoic chamber for the a) pyramidal materials and b) new optimized shape... 120 FIG. 3.54 Simulation and measurement results for the pyramidal shape and the new shape made of epoxy loaded with 0.5% carbon fibers 3 mm at a) Normal incidence and b) Oblique incidence (300)... 120 FIG. 4.1 Examples of broadband metamaterials... 123 FIG. 4.2 Examples of incorporating an artificial material on natural pyramidal absorber... 125 FIG. 4.3 The two resonators: Reflection coefficient versus frequency for vertical and horizontal polarization for a) Snake shape cell and b) Spiral shape cell... 126 FIG. 4.4 Periodicity of the small resonators... 127 FIG. 4.5 a) Interleaved metamaterial array, b) Photo of the fabricated sample... 128 FIG. 4.6 Simulated results for the final IMA at normal incidence depending on polarization... 128 FIG. 4.7 Optimal distance in between the two small cells... 128 FIG. 4.8 Current distribution for the top layer of the IMA for horizontal polarization at 4.74 GHz... 129 FIG. 4.9 Current distributions for the top layer of the IMA for vertical polarization at a) 7.149 GHz, b) 8.89 GHz, c) 9.78 GHz and d) 14.04 GHz... 129 FIG. 4.10 Different configurations of the IMA... 130 FIG. 4.11 Only snake shaped metamaterial configuration 1... 131 FIG. 4.12 Only snake shaped metamaterial configuration 2... 132 FIG. 4.13 Only spiral shaped metamaterial configuration 1... 132 FIG. 4.14 Only spiral shaped metamaterial configuration 2... 132 FIG. 4.15 Rotated snake shaped IMA... 133 FIG. 4.16 Rotated spiral shaped IMA... 133
FIG. 4.17 Reversed place in between the cells of the IMA... 134 FIG. 4.18 Double layer IMA with the top layer rotated at 900... 134 FIG. 4.19 Triple layer IMA with the two top layers rotated at 900... 135 FIG. 4.20 a) Half size proposed IMA b) Original proposed IMA and c) Double size IMA... 135 FIG. 4.21 Simulation results at normal incidence for the miniaturization and maximization of the IMA depending on polarization... 136 FIG. 4.22 a) Anechoic chamber measurement at IETR of Rennes, France and b) CHEOPS Anechoic chamber from CELAR (DGA), France... 137 FIG. 4.23 Simulated and measured reflection coefficient of the IMA at a) vertical polarization and b) horizontal polarization... 137 FIG. 4.24 Simulated and measured results for the IMA at oblique incidence depending on polarization for a)150, b) 300, c) 450 and d) 600... 138 FIG. 4.25 Radar cross section of a) A perfect electric conductor (metallic plate of 2 mm thickness), b) Metamaterial for vertical polarization and c) Metamaterial for horizontal polarization... 139 FIG. 4.26 Reflection coefficient of the metamaterial depending on the angle of incidence between -600 - 600 and frequency for a) Vertical polarization and b) Horizontal polarization... 140 FIG. 4.27 Pyramidal absorber loaded with metamaterial... 141 FIG. 4.28 Chosen size of the pyramidal geometry... 141 FIG. 4.29 Skin depth and attenuation of the natural absorber G1... 142 FIG. 4.30 Measurement and simulation results at Vertical polarization for the pyramidal absorber APM12 with IMA at a) Normal incidence and b) Oblique incidence (450)... 142 FIG. 4.31 Measurement and simulation results at Horizontal polarization for the pyramidal absorber APM12 with IMA at a) Normal incidence and b) Oblique incidence (450)... 143 FIG. 4.32 a) Simulations and b) measurements at oblique incidence between 150 - 600 for APM12 + IMA... 143 FIG. 4.33 Measurement and simulation results at Vertical polarization for the pyramidal absorber X1 with IMA at a) Normal incidence and b) Oblique incidence (450)... 144 FIG. 4.34 Measurement and simulation results at Horizontal polarization for the pyramidal absorber X1 with IMA at a) Normal incidence and b) Oblique incidence (450)... 145 FIG. 4.35 Measurements at oblique incidence between 150 - 600 for X1 + IMA... 146 FIG. 4.36 Radar cross section results obtained in the CHEOPS anechoic chamber from CELAR (DGA) for a) Pyramidal geometry APM12, b) Pyramidal geometry APM12 with MM at Vertical polarization and c) Pyramidal geometry APM12 with MM at Horizontal polarization... 147
FIG. 4.37 Reflection coefficient of a) Pyramidal geometry APM12, b) Pyramidal geometry APM12 with metamaterial at Vertical polarization, c) Pyramidal geometry APM12 with metamaterial at Horizontal polarization, d) Pyramidal geometry APM12 with metamaterial at Vertical polarization (curve representation) and e) APM12 with metamaterial at Horizontal polarization (curve representation)... 148 FIG. 4.38 Radar cross section results obtained in the CHEOPS anechoic chamber from CELAR (DGA) for a) Pyramidal geometry X1, b) Pyramidal geometry X1 with MM at Vertical polarization and c) Pyramidal geometry X1 with MM at Horizontal polarization... 149 FIG. 4.39 Reflection coefficient of a) Pyramidal geometry X1, b) Pyramidal geometry X1 with metamaterial at Vertical polarization, c) Pyramidal geometry X1 with metamaterial at Horizontal polarization, d) Pyramidal geometry X1 with metamaterial at Vertical polarization (curve representation) and e) X1 with metamaterial at Horizontal polarization (curve representation)... 150 FIG. 4.40 The two resonators: Reflection coefficient versus frequency for vertical and horizontal polarization for a) Symmetrical snake shape cell and b) Symmetrical spiral shape cell... 151 FIG. 4.41 a) Interleaved metamaterial array... 152 FIG. 4.42 Simulated and measured results for the final IMA at normal incidence depending on polarization: a) Vertical polarization and b) Horizontal polarization... 152 FIG. 4.43 Chosen size of the pyramidal geometry... 153 FIG. 4.44 Simulation and measurement results for the pyramidal absorber X1 with IMA for Vertical polarization at a) normal incidence and b) oblique incidence (450)... 153 FIG. 4.45 Simulation and measurement results for the pyramidal absorber X1 with IMA for Horizontal polarization at a) normal incidence and b) oblique incidence (450) ... 154 FIG. 4.46 Simulation results for the pyramidal absorber X1 with 2 layers IMA for Vertical polarization at a) Normal incidence and b) Oblique incidence (450)... 155 FIG. 4.47 Simulation results for the pyramidal absorber X1 with 2 layers IMA for Horizontal polarization at a) Normal incidence and b) Oblique incidence (450)... 155 FIG. 4.48 Simulation results for the pyramidal absorber X1 with 2 layers IMA with the top layer rotated to 900 for Vertical polarization at a) Normal incidence and b) Oblique incidence (450)... 156 FIG. 4.49 Simulation results for the pyramidal absorber X1 with 2 layers IMA with the top layer rotated to 900 for Horizontal polarization at a) Normal incidence and b) Oblique incidence (450)... 157 FIG. 4.50 Simulation results for the broadband polarization independent metamaterial... 158 FIG 4.51 Natural absorber placement on the broadband metamaterial... 159
FIG. 4.52 Simulation results for the optimized metamaterial... 159 FIG 4.53 Simulation results for the pyramid APM12 in combination with the broadband metamaterial placed: a) under the pyramidal base and b) inside the pyramidal base... 160 FIG. 4.54 Simulation results at oblique incidence using the metamaterial inside the pyramidal base of APM12... 161 FIG. 4.55 Simulation results at normal and oblique incidence for the optimized bottom layer of the metamaterial... 161 FIG. 4.56 Simulation results for the optimized metamaterial that has resonant frequencies from 1.9 GHz... 162 FIG. 4.57 Simulation results for the pyramidal absorber APM12 in combination with the optimized metamaterial... 162 FIG. A.1 Orientation of the electric field... 169 FIG. A.2 Single dielectric slab... 170 FIG. A.3 Single dielectric slab backed by a metallic plate... 171 FIG. A.4 Two dielectric slabs... 172 FIG A.5 Infinite number of dielectric slabs... 173 FIG A.6 Propagation at oblique incidence... 174 FIG. B.1 Frequency dependence of permittivity in the microwave field [24]... 177 FIG. B.2 Frequency variation of complex permeability in a ferrite (ω=20π GHz, ωm=11.2π GHz, α=0.05) [24, 139]... 179 FIG. C.1 Process for the NRW method... 181
1
Les matériaux absorbants des ondes électromagnétiques sont des éléments importants pour l'évaluation de nombreux systèmes électroniques militaires mais également civils. Ces matériaux sont utilisés, par exemple, pour la réduction des interférences électromagnétiques (EMI) dans divers composants sans fils, la réduction de la surface équivalente radar (SER) ou comme absorbants à l'intérieur des chambres de mesures. C’est cette dernière application qui est visée par les travaux de cette thèse. L’objectif de mes travaux de thèse est d’optimiser des matériaux absorbants utilisés dans les chambres anéchoïques. La géométrie et la composition du matériau absorbant sont les deux paramètres qui influencent la capacité d’absorption de l’onde électromagnétique par un matériau. Ce seront donc les deux pistes d’optimisation explorées durant cette thèse. Notre but est d’obtenir les absorbants présentant les plus faibles coefficients de réflexion et de transmission, soit une absorption élevée, ceci dans une large bande de fréquence.
Le premier chapitre de cette thèse sera dédié aux techniques de caractérisation diélectriques des matériaux. Un bref état de l’art des différentes techniques existantes sera tout d’abord effectué. Une nouvelle technique de caractérisation large bande, et en milieu non anéchoïque, sera proposée et validée par la caractérisation de matériaux commerciaux aux caractéristiques diélectriques connues. Dans le second chapitre, un nouveau matériau absorbant (à base de mousse époxy chargée avec des fibres de carbone) sera étudié. La caractérisation diélectrique d’échantillons avec différents taux de charge sera tout d’abord menée. Dans le but de sélectionner la composition présentant les meilleurs performances d’absorption, on simulera ensuite un absorbant pyramidal en utilisant les caractéristiques diélectriques expérimentales. Un prototype sera alors réalisé, caractérisé et comparé à l’absorbant du commerce de même dimensions.
Dans le chapitre trois, l’optimisation de la forme de l’absorbant sera étudiée. Des simulations numériques utilisant l’algorithme générique seront tout d’abord menées afin d’obtenir la forme présentant la meilleure absorption. Un prototype présentant une des formes optimisées sera réalisé en utilisant le nouveau matériau absorbant à base de mousse époxy. Ce prototype sera mesuré et comparé au premier prototype pyramidal à base de mousse époxy.
Dans le dernier chapitre de cette thèse, l’optimisation des performances d’absorption sera étudiée par l’association des absorbants pyramidaux du commerce à des métamatériaux. Trois structures (deux structures 2D et une structure 3D) seront étudiées par simulation. Des prototypes des matériaux hybrides « absorbant pyramidal du commerce + métamatériaux 2D » seront réalisés, caractérisés et comparés à l’absorbant pyramidal seul.
Ce résumé de la thèse présente les principaux résultats des différents travaux cités auparavant. Quatre paragraphes détaillent les quatre chapitres de la thèse, rédigée en anglais, suivis par une conclusion et des perspectives.
Le Chapitre 1 est dédié aux techniques de caractérisation des matériaux. Un état de l’art des différentes techniques utilisées pour la détermination des propriétés diélectriques des matériaux est d’abord présenté. Pour chaque méthode, les avantages et les inconvénients sont spécifiés.
Dans ce même chapitre, une nouvelle méthode de caractérisation diélectrique des matériaux, réalisable dans un environnement non-anéchoïque (souvent nécessaire pour les caractérisations en large bande) est proposée et détaillée. Cette technique permet l'extraction du coefficient de réflexion du matériau caractérisé. Comme cette technique est utilisée en milieu non-anéchoïque, et afin de réduire les effets de la propagation par trajets multiples, une mesure bistatique est réalisée à différentes distances Antennes - Matériaux en champ lointain. Par la suite, la méthode de « de-embedding » est utilisée afin de déterminer les paramètres S et la permittivité complexe du matériau.
Afin de valider la nouvelle méthode de mesure, deux matériaux commerciaux ont été testés. Le premier est un matériau sans pertes, le Téflon, et le second un matériau à pertes, l’ECCOSORB LS22. Les coefficients de réflexion simulés à partir des données commerciales sont très proches de ceux obtenus par mesure en milieu non anéchoïque et en chambre anéchoïque. En utilisant le paramètre de réflexion mesuré en milieu non anéchoïque, la partie réelle des permittivités est extraite (FIG. 1). Ces valeurs sont très proches des valeurs théoriques et de celles obtenues par la caractérisation en guide d'ondes et en chambre anéchoïque.
Les incertitudes de mesure pour les techniques large bande sont estimées à 5% pour la partie réelle de la permittivité ε’ (et de la perméabilité μ’) et à 10% sur les pertes (Tan ). Cette dernière incertitude est relativement élevée et est due à l'incertitude de la phase mesurée des paramètres S. Au final, les différentes simulations et mesures permettent de dire que les matériaux à faibles pertes (Tan < 0.01) ne peuvent pas être caractérisés correctement en utilisant cette méthode. Dans notre cas et pour le matériau Téflon, les pertes n’ont pas pu être extraites, alors que pour le matériau absorbant ECCOSORB LS22, nous avons extrait des pertes très proches de celle annoncées par le commercial.
a) b)
FIG. 1 Permittivités du a) Téflon et b) ECCOSORB-LS22 extraites de la mesure en chambre non-anéchoïque 2 4 6 8 10 12 14 16 18 0 1 2 3 4 5 Fréquence (GHz) e p s ' - Te fl o n
Mesure - Env ironnement non-anéchoïque Mesure - Chambre anéchoïque Matériau Data sheet Mesure - Sonde coaxiale Mesure - Guide d'onde
2 4 6 8 10 12 14 16 18 0 1 2 3 4 5 e p s ' E C C O S O R B L S 2 2 Fréquence (GHz)
Mesure - Env ironnement non-anéchoïque Mesure - Chambre anéchoïque Matériau Data sheet Mesure - Sonde coaxiale Mesure - Guide d'onde
Le Chapitre 2 présente l’étude menée sur un nouveau matériau absorbant, élaboré dans l’équipe Matériaux Fonctionnels de l’IETR située à St Brieuc, dans le but de mettre en évidence son potentiel d’utilisation en tant qu’absorbant en chambre anéchoïque.
Actuellement, les absorbants les plus utilisés en chambres anéchoïques sont les absorbants de forme pyramidales composés d’une mousse polyuréthane imprégnée d’une solution carbonée. Ces mousses présentent l’avantage d’une faible densité et d’un faible cout, mais présente également des inconvénients. En effet, la mousse polyuréthanne est très souple et induit un usinage difficile et non reproductible des absorbants. De plus, cette souplesse ne permet pas d’envisager l’utilisation de formes complexes qui pourrait améliorer les performances d’absorption de ces matériaux.
Le nouveau matériau absorbant, développé dans le cadre de la thèse de Chloé Méjean, est composé d’une mousse époxy chargée en fibres de carbone de 3 mm de long. Ce matériau permet, grâce à la rigidité de la mousse époxy, une découpe plus facile et reproductible. Des composites avec différents pourcentages massiques en fibres de carbone (FIG. 2) ont été réalisés et caractérisés en chambre anéchoïque pour déterminer leurs propriétés diélectriques.
Taux de fibres de
carbone (% wt.) 0% 0.25% 0.5% 0.75% 1%
Echantillons
FIG. 2 : Photos d’échantillons mousses époxy chargées avec différents taux massiques en fibres de carbone
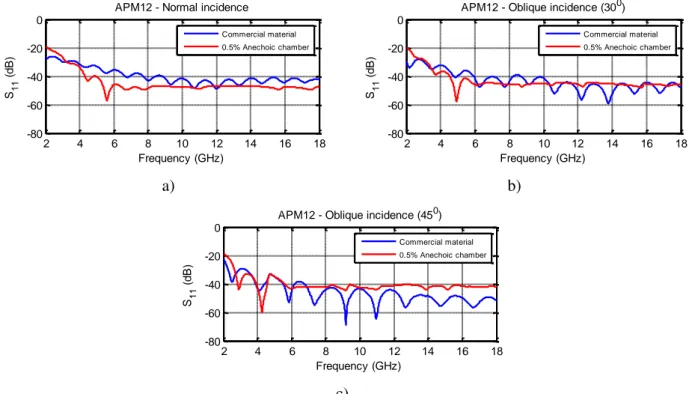
Par la suite, les propriétés diélectriques de ces composites, extraites à partir des mesures, ont été utilisées pour la simulation du coefficient de réflexion d’un absorbant pyramidal. Suivant les propriétés diélectriques des composites, la géométrie des absorbants commerciaux APM9 ou APM12 de SIEPEL a été privilégiée pour la simulation et a permis d’estimer le potentiel d’utilisation de ces composites autant qu’absorbant en chambres anéchoïques. Les différents résultats montraient un fort potentiel d’absorption, comparable aux matériaux du commerce, voire meilleur pour certaines fréquences.
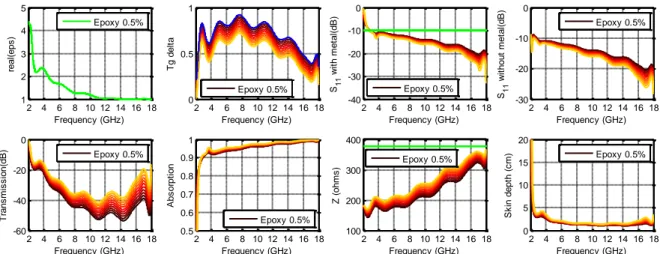
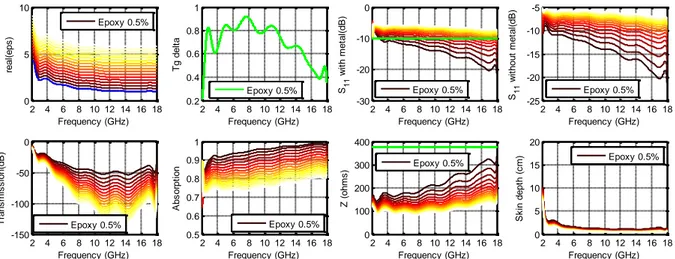
Afin de confirmer ces résultats et de valider le potentiel de ces matériaux composites, un prototype a été réalisé avec le composite mousse époxy chargée avec 0.5% en fibres de carbone. Ce dernier taux de charge a été choisie car il présente le meilleur compromis : faible permittivité (afin de minimiser la réflexion à l’interface air / matériau), fortes pertes diélectriques (afin de maximiser l’absorption dans le matériau) et une bonne homogénéité du matériau. Les propriétés diélectriques de
ce composite (’ et Tan ), extraites à partir de la mesure en chambre anéchoïque, sont présentés FIG. 3.
a) b)
FIG. 3 : Permittivité a) et pertes diélectriques b) du composite mousse époxy chargée avec 0.5% de fibres de carbone extraites à partir de la mesure en chambre anéchoïque
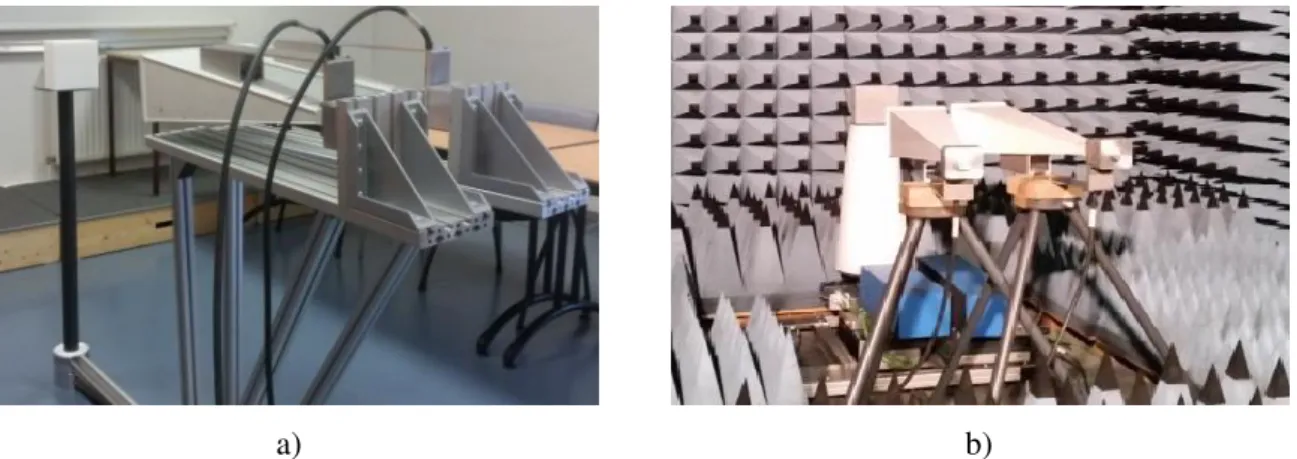
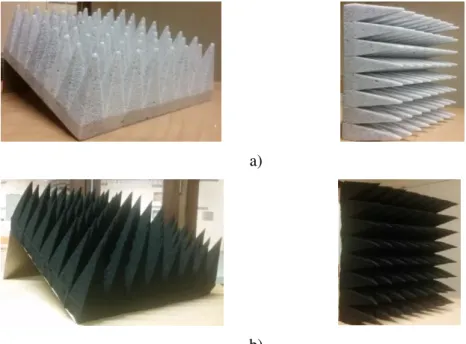
La géométrie retenue pour ce prototype, et qui est la plus adaptée au composite choisie (0.5% de fibres de carbone), est celle de l’absorbant commercial APM12. La FIG. 4. montre la photo du prototype réalisé ainsi que l’absorbant commercial utilisé pour cette étude. Ces deux absorbants sont constitués de 64 pyramides positionnés côte à côte.
a) b)
FIG. 4 : a) Prototype mousse époxy chargé avec 0.5% de fibres de carbone b) Absorbant commercial APM12
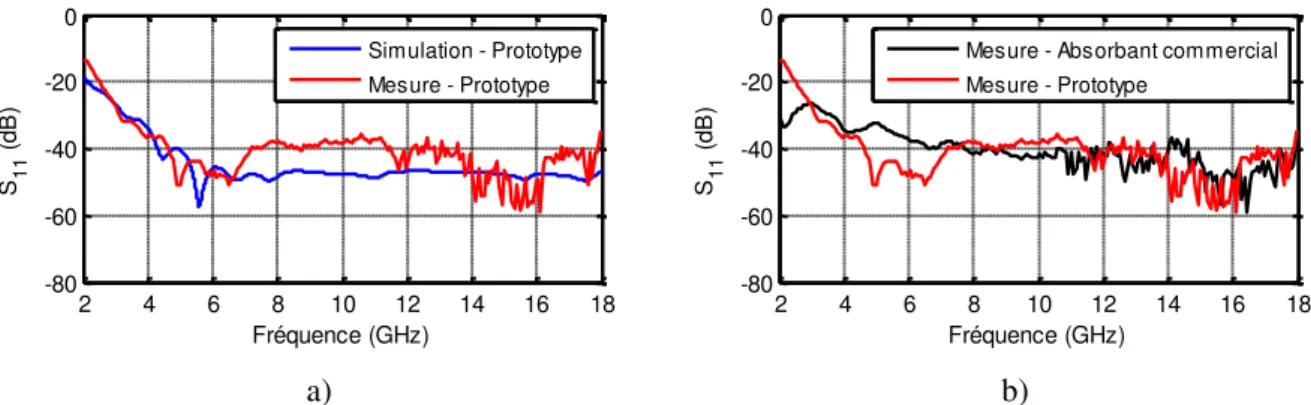
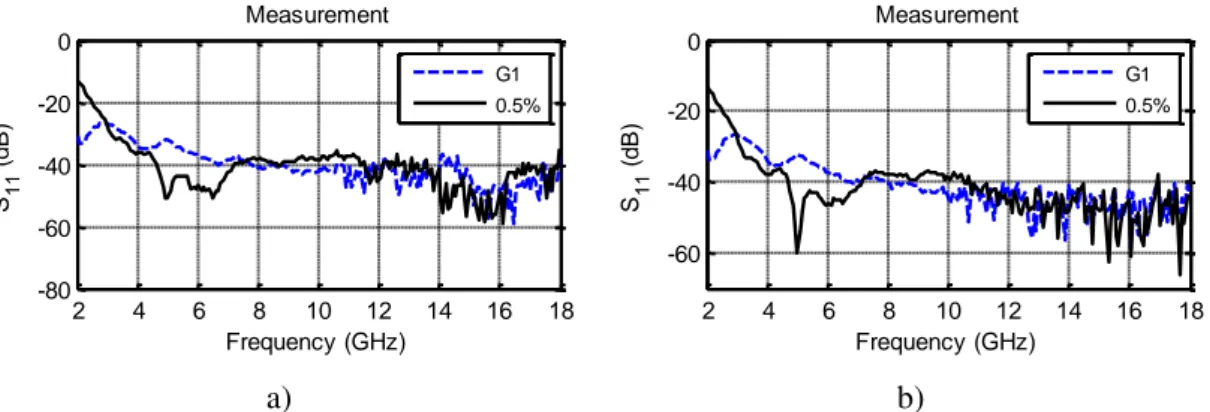
La FIG. 5.a montre la simulation du prototype (à partir des caractérisations obtenues en chambre anéchoïque) ainsi que le résultat de mesure, en chambre anéchoïque de ce prototype. Une bonne concordance est à noter entre ces deux résultats. Ceci valide, par ailleurs, la technique d’extraction des propriétés diélectriques pas la mesure en chambre anéchoïque. La FIG. 5.b compare la mesure du prototype époxy chargée en fibres de carbone à l’absorbant du commerce APM12. Les deux absorbants montrent des résultats comparables sur toute la gamme de fréquence étudiée, voire meilleurs pour le prototype époxy dans la gamme de fréquence allant de 3 à 7 GHz. Les mêmes résultats ont été constatés en incidence oblique (30°).
2 4 6 8 10 12 14 16 18 0 1 2 3 4 5 Fréquence (GHz) E p s ' 0.5% 2 4 6 8 10 12 14 16 18 0 0.5 1 Fréquence (GHz) Ta n d e lt a 0.5%
a) b)
FIG. 5 : a) La mesure du prototype comparée à la simulation b) la mesure du prototype comparée à la mesure du matériau commercial APM12
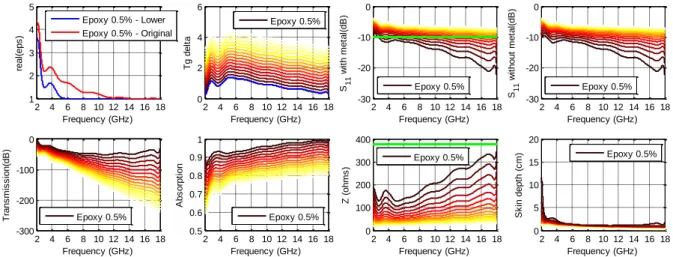
Dans ce même chapitre, des simulations ont été menées, à partir des propriétés des matériaux composites élaborés, mais également en utilisant les caractéristiques des matériaux absorbants du commerce, afin de déterminer les propriétés de l’absorbant idéal. Cette étude a montré que la partie réelle de la permittivité doit être la plus proche possible de l’air (espace libre) afin d’éviter la discontinuité du milieu et ainsi éviter la réflexion (comme dit auparavant). Par ailleurs, les pertes doivent être élevées pour pouvoir absorber l’onde, mais si celles-ci sont trop élevées (Tg >> 1), la partie imaginaire de la permittivité sera très élevée (ε’’>>1) résultant en une forte conductivité électrique σ = ωε" >> 1, ce qui va au final induire une grande réflexion.
Le Chapitre 3 traite des différentes géométries des absorbants utilisées en chambres anéchoïques. Selon le type de caractérisation réalisée en chambre anéchoïque ainsi que la bande de fréquences de caractérisation (qui peut varier de 300 MHz à 300 GHz), différentes géométries et compositions peuvent être utilisées pour atténuer l'énergie des ondes électromagnétiques incidentes. Un état de l’art des géométries d’absorbants est tout d’abord présenté dans ce chapitre, suivi par la proposition, la réalisation et la mesure d’une nouvelle géométrie adaptée aux nouveaux matériaux composites (rappelons que ces derniers présentent l’avantage d’être usinable sous des formes complexes). Dans ce chapitre, les méthodes théoriques d’optimisation ainsi que quelques résultats (formes optimisées) sont présentées.
Actuellement, différentes géométries d’absorbants sont utilisées en chambres anéchoïque, néanmoins, la géométrie la plus répandue et qui montre les meilleures performances jusque-là est celle de l’absorbant pyramidal. Dans ce chapitre, nous avons présenté une nouvelle géométrie, inspirée de la géométrie pyramidale classique et de la géométrie hexagonale, et qui permet d'augmenter l'absorption et ainsi améliorer les performances de réflexion (minimiser ce paramètre) dans une chambre anéchoïque. La nouvelle géométrie ainsi que le prototype réalisé sont présentés en FIG. 6. Pour ce second prototype, la même composition (mousse époxy + 0.5% de fibres de carbone) a été utilisée afin de pouvoir comparer les deux prototypes réalisés.
2 4 6 8 10 12 14 16 18 -80 -60 -40 -20 0 Fréquence (GHz) S1 1 ( d B ) Simulation - Prototype Mesure - Prototype 2 4 6 8 10 12 14 16 18 -80 -60 -40 -20 0 Fréquence (GHz) S1 1 ( d B )
Mesure - Absorbant commercial Mesure - Prototype
a) b)
FIG. 6 a) Schéma de la géométrie optimisée et b) photo du prototype réalisé suivant cette géométrie
Les résultats de mesure de ce nouveau prototype sont comparés à la mesure du premier prototype pyramidal sur la FIG. 7. Celle-ci montre une nette diminution du coefficient de réflexion et cela suivant les deux polarisations TM et TE. Un gain moyen, calculé sur toute la gamme de fréquence, d’environ 8 dB et 9 dB est à noter, respectivement pour la polarisation TE et TM. De plus, un bon accord a été observé entre les résultats de simulations et ceux de mesures.
FIG. 7 Comparaison de la mesure du prototype optimisé et du prototype pyramidal à base de mousse époxy chargée en fibres de carbone
Dans la dernière partie de ce chapitre, l'optimisation des structures d'absorbants électromagnétiques, utilisant l'algorithme génétique, a été étudiée. En effet, la nécessité d'obtenir des formes plus parfaites et aussi de meilleurs résultats d’absorption pour des applications spécifiques devient évidente et a conduit au développement de différents outils d'optimisation.
Dans cette partie, et après avoir expliqué les différentes méthodes d’optimisation des formes ainsi que le processus d'optimisation basé sur l’algorithme génétique, différentes formes optimisées obtenues sont montrées et expliquées. Une optimisation de l’absorbant dièdre, utilisé également en chambres anéchoïques mais qui souffre d’une forte réflexion pour les incidences obliques de l’onde électromagnétique, a été réalisée. L’algorithme génétique a permis d’obtenir une forme avec un faible coefficient de réflexion dans une large bande de fréquence.
2 4 6 8 10 12 14 16 18 -80 -60 -40 -20 0 Fréquence (GHz) S 1 1 ( d B )
Mesure Chambre anéchoïque - Incidence normale (00) Pyramid
Nouveau prototype TE Nouveau prototype TM
Le Chapitre 4 présente une autre possibilité d’optimisation des absorbants par leur association avec des métamatériaux. Au cours de ma thèse, j’ai tout d’abord étudié l’impact de l’association de deux métamatériaux de structure 2D sur les performances d’absorption d’un matériau du commerce. Les structures 2D ont été réalisées et caractérisées (toute seule et en association avec un matériau absorbant du commerce). Par la suite, j’ai étudié, par simulation numérique, l’impact de l’association d’une troisième géométrie de métamatériau, avec une structure 3D, au même absorbant naturel du commerce.
Les métamatériaux ont attiré l'attention et ont été intensément étudiés autant qu’absorbants au cours des dix dernières années. Dans ce chapitre, un matériau hybride, associant un métamatériau (matériau artificiel) à un absorbant naturel (absorbant du commerce) afin d'améliorer sa compacité et ses propriétés d'absorption, a été étudié. Le premier Absorbants Microondes à base de Métamatériaux (AMM) que nous avons choisie pour cette étude est constitué de deux cellules unitaires résonnantes (FIG. 8.a et 8.b) imprimées sur un substrat commercial (Arlon) d’une épaisseur de 1,5 mm et de permittivité ε = 2,2. Le dos du substrat est métallisé et considéré comme un plan de masse. Les deux cellules de métamatériau sont composées chacune d’un résonateur rectangulaire fonctionnant dans des gammes de fréquences distinctes. La première cellule (inspirée de la bibliographie), référencée A, possède une forme de méandre qui résonne à 2 GHz. La seconde cellule, référencée B, est de forme spirale et résonne à 6 et à 10 GHz. La structure finale, constituée d’un damier associant ces deux cellules unitaires (FIG. 8.c) fonctionne à différentes gammes de fréquences. Un prototype de cette structure périodique de dimensions 19 x 19 cm², a été réalisé (FIG. 8.d) et caractérisé en chambre anéchoïque.
a) b) c) d)
FIG. 8 Géométrie du premier métamatériau utilisé : a) cellule unitaire A, b) cellule unitaire B, c) Structure globale et d) Photo du prototype réalisé
Les FIG. 9.a et 9.b présentent les résultats de simulation et de mesure de la première structure AMM seule (avant son association au matériau naturel) pour une polarisation de l’onde électromagnétique horizontale et verticale. Sur ces figures nous retrouvons les absorptions attendues à plusieurs bandes de fréquences prévues par la simulation (fréquences de résonances des cellules seules et de leur association). La différence entre la mesure et la simulation est principalement dû au fait que
nous avons utilisé une structure finie du métamatériau pour la mesure alors qu’elle est infinie pour la simulation.
a) b)
FIG. 9 Coefficient de réflexion simulé et mesurée de l’AMM tout seul pour une polarisation de l’onde a) verticale et b) horizontale
Afin de valider le principe d’utilisation d’un matériau artificiel pour optimiser l’absorption d’un matériau naturel, deux matériaux absorbants pyramidaux naturels sont utilisés. Ces absorbants pyramidaux sont à base de mousse de polyuréthane imprégnée d’une solution carbonée (Absorbants SIEPEL). Le premier matériau utilisé est l’APM12 et le second (qui sera noté ici X1) est composé du même matériau que l’APM12 mais les dimensions des pyramides de celui-ci sont diminuées (Tableau 1) par rapport à l’APM12. Pour le matériau hybride, la structure AMM est placée au dos du matériau absorbant (colée à la base rectangulaire de chaque pyramide) comme montré en TABLEAU 1.
L’absorbant pyramidal dimensions Géométrie A (mm) B (mm) C (mm) X1 38 13 89 APM12 38 25 115
TABLEAU 1 Tailles des absorbants pyramidaux utilisés
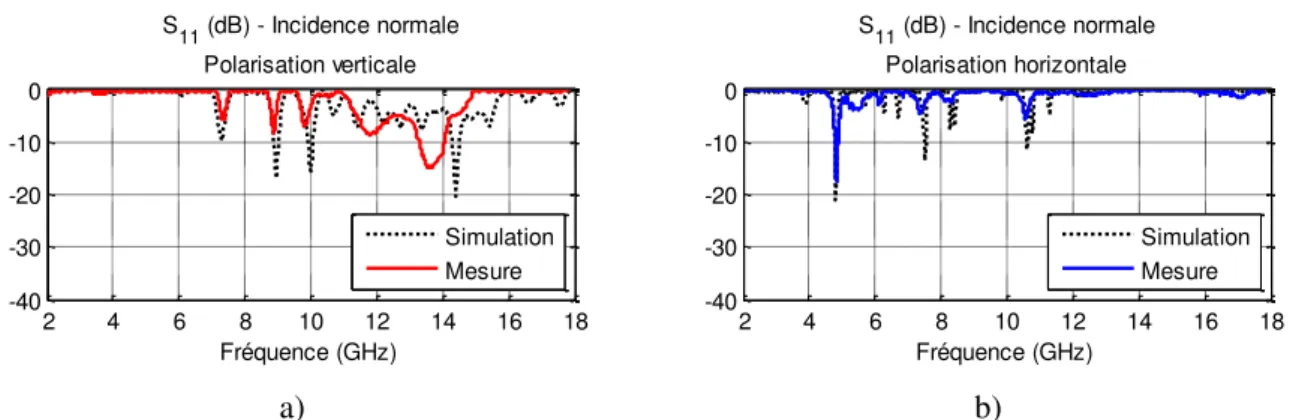
Les résultats de simulation (réalisée avec CST Microwave Studio en utilisant le domaine (ou réponse) fréquentiel et les conditions aux limites de Floquet) ainsi que les mesures du matériau hybride à base de l’absorbant APM12 ont montré une très faible amélioration du coefficient de réflexion lors de l’ajout du métamatériau, alors que le second matériau hybride (à base de l’absorbant X1) montre une nette amélioration du coefficient de réflexion. En effet, une amélioration de l’absorption avec un gain maximum de 20 dB est mesurée entre 8 et 15 GHz en incidence normale et pour une polarisation verticale de l’onde électromagnétique (FIG. 10.a). Ce gain était de 5 dB pour le premier matériau hybride à base de l’APM12. Pour une polarisation horizontale de l’onde
2 4 6 8 10 12 14 16 18 -40 -30 -20 -10 0 Fréquence (GHz) S11 (dB) - Incidence normale Polarisation verticale Simulation Mesure 2 4 6 8 10 12 14 16 18 -40 -30 -20 -10 0 Fréquence (GHz) S11 (dB) - Incidence normale Polarisation horizontale Simulation Mesure Couche de cuivre continue A B C IMA
électromagnétique, l’optimisation de l’absorbant « X1 + Métamatériau » est obtenue dans la gamme de fréquence entre 4 et 6 GHz et le gain ici est d’un maximum de 15 dB alors qu’aucun gain n’a été observé sur le matériau hybride à base de l’APM12. En incidence oblique, des gains aussi intéressants qu’en incidence normale, ont été observés avec la structure « X1 + Métamatériau ». La FIG. 10 montre les résultats de la structure AMM associée au matériau naturel X1.
a)
b)
FIG. 10 Résultats de simulation et de mesure en incidence normale pour l’absorbant pyramidal X1 associé à l’AMM pour une polarisation a) verticale et b) horizontale
Nous pouvons conclure, à partir des différents résultats de simulation et de mesures obtenues pour ce premier matériau hybride (naturel + artificiel) réalisé avec la première géométrie AMM proposée, que l’association du métamatériau 2D à un absorbant ayant la composition et la géométrie optimale (ce qui est le cas des absorbants du commerce et de l’APM12 utilisé) n'apporte pas d’amélioration sur le coefficient de réflexion de l’absorbant pyramidal car l’onde électromagnétique sera complètement absorbée avant d’atteindre le métamatériau. Par contre, cette association aura tout son intérêt si les dimensions de l’absorbant sont diminuées (le cas du matériau X1 étudié ici). Dans ce cas, le métamatériau permettra de diminuer la réflexion du matériau en absorbant la partie de l’onde qui n’a pas été absorbée par le matériau et qui a atteint le dos de la pyramide. Par contre, nous avons remarqué que le gain obtenu ici est fonction de la polarisation : optimisation dans la gamme des fréquences basses (entre 4 et 6 GHz) pour une polarisation horizontale, et dans la gamme des fréquences hautes (au-delà de 8 GHz) pour une polarisation verticale. Ceci est dû à l’asymétrie de la
2 4 6 8 10 12 14 16 18 -50 -40 -30 -20 -10 0 Fréquence (GHz)
S11 (dB) - Incidence normale - Polarisation verticale
Simulation - X1 + Plaque métallique Simulation - X1 + MM 2 4 6 8 10 12 14 16 18 -50 -40 -30 -20 -10 0 Fréquence (GHz)
S11 (dB) - Incidence normale - Polarisation verticale
Mesure - X1 + Plaque métallique Mesure - X1 + MM 2 4 6 8 10 12 14 16 18 -50 -40 -30 -20 -10 0 Fréquence (GHz)
S11 (dB) - Incidence normale - Polarisation horizontale
Simulation - X1 + Plaque métallique Simulation - X1 + MM 2 4 6 8 10 12 14 16 18 -50 -40 -30 -20 -10 0 Fréquence (GHz)
S11 (dB) - Incidence normale - Polarisation horizontale
Mesure - X1 + Plaque métallique Mesure - X1 + MM
géométrie AMM proposée résultant d’un fonctionnement mono polarisation. Afin de contourner cet effet et d’avoir une optimisation de l’absorption sur les deux polarisations de l’onde EM, une seconde géométrie d’AMM, cette fois ci à double polarisation, a été proposée en modifiant les cellules unitaires A et B. Nous aboutissons à deux nouvelles structures de deux cellules unitaires référencées C et D de forme, respectivement, méandre et spirale modifiées (FIG. 11.a et b). La structure finale constituée également d’un damier associant ces deux nouvelles cellules unitaires et fonctionnant dans la gamme de fréquence entre 2 et 18 GHz est présentée en FIG. 11.c. Un prototype de cette structure de dimensions 19 x 19 cm² a été réalisé (FIG. 11.d) en utilisant le même substrat et la même épaisseur métallique que précédemment (premier prototype).
a) b) c) d)
FIG. 11 Géométrie du deuxième métamatériau (symétrique) utilisé : a) cellule unitaire C, b) cellule unitaire D, c) Structure globale et d) Photo du prototype réalisé
Les FIG. 12.a et 12.b présentent les résultats de simulation et de mesure (en chambre anéchoïque) de la nouvelle structure AMM seule (avant son association au matériau absorbant naturel) pour une polarisation horizontale et verticale de l’onde électromagnétique.
a) b)
FIG. 12 Coefficient de réflexion simulé et mesurée de l’AMM symétrique tout seul pour une polarisation de l’onde a) verticale b) horizontale
Pour une polarisation verticale de l’onde EM, la nouvelle géométrie montre le même comportement que l’AMM original présenté auparavant. Une absorption large bande est ici observée entre 9 et 18 GHz (FIG. 12.a) en plus des deux résonances aux alentours de 3,5 et 5 GHz. Pour une
2 4 6 8 10 12 14 16 18 -40 -30 -20 -10 0 Fréquence (GHz) S11 (dB) - Incidence normale Polarisation verticale Simulation Mesure 2 4 6 8 10 12 14 16 18 -40 -30 -20 -10 0 Fréquence (GHz) S11 (dB) - Incidence normale Polarisation horizontale Simulation Mesure C D
polarisation horizontale de l’onde EM, l’AMM montre des pics de résonance entre 3 et 7 GHz mais également une absorption large bande entre 9 et 18 GHz, contrairement à la première géométrie AMM étudiée (FIG. 9.b). Il faut noter ici que le coefficient de réflexion S11 simulé ou mesuré pour cette nouvelle géométrie est plus faible que celui observé sur le premier AMM (FIG. 9).
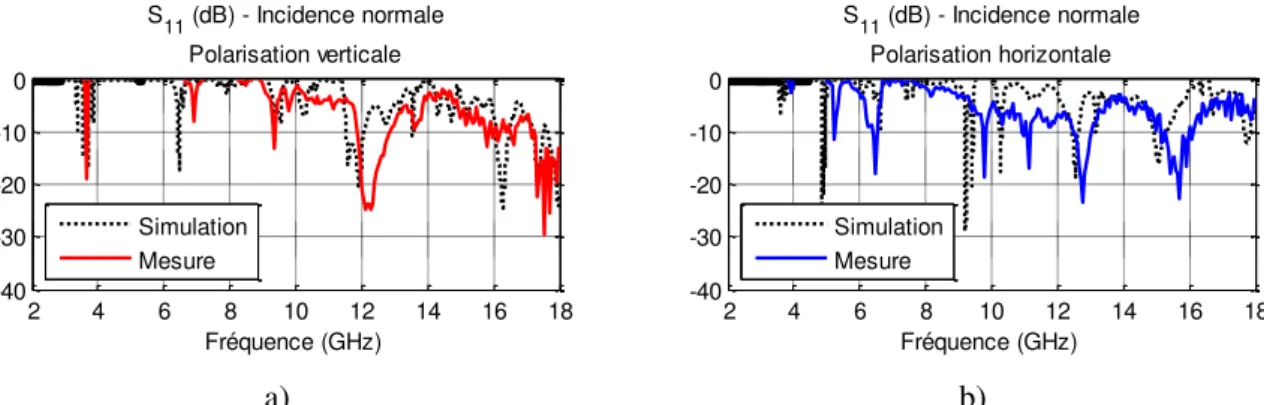
Les résultats de simulation et de mesure du nouveau matériau hybride (absorbant naturel + nouvelle géométrie AMM) sont présentés dans la FIG. 13. L’absorbant pyramidal naturel X1 (TABLEAU 1) a été utilisé pour cette étude.
a)
b)
FIG. 13 Résultats de simulation et de mesure en incidence normale pour l’absorbant pyramidal X1 associé à l’AMM symétrique pour une polarisation a) verticale et b) horizontale
Les simulations de la FIG. 13 montrent un gain sur toute la gamme de fréquence étudiée, lorsque l’AMM symétrique est associé au matériau absorbant X1, et cela pour les deux polarisations de l’onde EM. Le gain ici est compris entre 3 et 15 dB. La mesure du nouveau prototype confirme l’optimisation de la performance d’absorption suivant les deux polarisations. Des gains jusqu’à 15 dB sont observés respectivement entre 3 et 7 GHz et 9 et 18 GHz.
2 4 6 8 10 12 14 16 18 -50 -40 -30 -20 -10 0 Fréquence (GHz)
S11 (dB) - Incidence normale - Polarisation verticale
Mesure- X1 + Plaque métallique Mesure - X1 + MM 2 4 6 8 10 12 14 16 18 -50 -40 -30 -20 -10 0 Fréquence (GHz)
S11 (dB) - Incidence normale - Polarisation verticale
Mesure- X1 + Plaque métallique Mesure - X1 + MM 2 4 6 8 10 12 14 16 18 -50 -40 -30 -20 -10 0 Fréquence (GHz)
S11 (dB) - Incidence normale - Polarisation horizontale
Mesure- X1 + Plaque métallique Mesure - X1 + MM 2 4 6 8 10 12 14 16 18 -50 -40 -30 -20 -10 0 Fréquence (GHz)
S11 (dB) - Incidence normale - Polarisation horizontale
Mesure- X1 + Plaque métallique Mesure - X1 + MM
Conclusion
Mon manuscrit de thèse traite de l’optimisation des matériaux absorbants utilisés en chambres anéchoïques. Différentes méthodes d’optimisation ont été abordées telles que l’utilisation d’un nouveau matériau absorbant rigide récemment élaboré par l’équipe « Matériaux Fonctionnels » de l’IETR (site de St-Brieuc), ou l’amélioration de la géométrie des absorbants, ou encore, l’association de matériaux artificiels (métamatériaux 2D et 3D) aux absorbants pyramidaux naturels. De même, une nouvelle technique de caractérisation des matériaux, dans un milieu non-anéchoïque a été proposée. Dans ce résumé, ces différents aspects sont succinctement abordés et les principaux résultats (de simulation et/ou de mesures) obtenues lors de la thèse sont présentés.
Concernant la nouvelle méthode de caractérisation, nous avons validé l’utilisation de cette technique large bande et qui ne nécessite qu’un échantillon relativement petit, sur des matériaux commerciaux. Nous avons montré la possibilité d’extraction avec succès de la permittivité des matériaux à faibles ou fortes pertes. Par contre, l’extraction des pertes par cette technique reste limitée aux matériaux présentant de fortes pertes.
Par ailleurs, l’utilisation du nouveau matériau absorbant à base de mousse époxy chargée en fibres longue (3 mm) de carbone a montré des résultats très encourageants. Les performances d’absorption d’un prototype pyramidal sont comparables voir meilleures que l’absorbant du commerce (APM12) pour la gamme de fréquence entre 3 à 7 GHz. Ce nouveau matériau absorbant a été également utilisé pour réaliser une nouvelle géométrie d’absorbant, proposée lors de cette thèse. Les résultats de simulation et de mesure du second prototype réalisé montrent un gain de 10 dB sur toute la gamme de fréquence étudiée, par rapport au matériau du commerce. Il faut noter ici que la rigidité de ce nouveau matériau absorbant permettra d’envisager de nouvelles formes encore plus complexes afin d’optimiser les performances des absorbants.
Finalement, l’étude de l’association d’un métamatériau à un matériau pyramidal du commerce montre une amélioration de l’absorption sur une large bande de fréquence. Cette amélioration est plus importantes et surtout effective sur une large bande de fréquence et pour les deux polarisations de l’onde EM (verticale et horizontale) lorsqu’une structure symétrique du métamatériau est utilisée. Au final, les métamatériaux peuvent être utilisés en association avec des absorbants non optimums de faibles épaisseurs (afin de réduire le volume du matériau utilisé) ou très peu chargés.
25
Absorber materials have emerged during the Second World War; their first application was to reduce, or to eliminate completely, the signal of military equipment (planes and submarines) from the first radar detectors. Since then, the intensive use of electromagnetic waves and the induced rapid increase of the emitted parasitic waves in the microwave band have diversified the application domains of absorbers. Indeed, this intensive use of microwaves is not without consequences for the reliability of electronic equipment or for public opinion (debate on the harmfulness of electromagnetic waves). All these reasons, finally, have involved an increase in the use of absorber materials.
Today, whether for civil or military domains, the demand for new absorber materials is growing to meet the evolution of the use of microwaves, for example, in the reduction of electromagnetic interferences (EMI), in the reduction of the radar cross section (RCS), in electromagnetic compatibility (EMC).
Another area that was affected by the development of the microwave applications is the domain of electronic device characterization. Today, it is necessary to simulate a free space environment during the measurement without any electromagnetic disturbance, in order to extract the real specificities of the device under test. The anechoic chamber is one of the environments often used for this type of measure. These chambers are good consumers of absorber materials, in fact, microwave absorbers are one of the main components in anechoic chambers. Indeed, to simulate a free space condition and to eliminate reflected microwave signals, these rooms (walls, ceiling and floor) are completely covered with absorber materials.
For anechoic chambers, the field uniformity is the most important parameter to evaluate its conformity. The standard IEC 61000 - 4 - 3 specifies that in the test zone, where the material under test is placed, the field should be uniform. The later can be obtained by measuring the field at different frequencies between 30 MHz and 300 GHz, and at specific points. If only a slight variation of the field is obtained at the majority of measured points, the anechoic chamber can be considered acceptable.
Usually, two types of absorbers are used in anechoic chambers. The first one is the thin layer absorbers (tiles) based on ferrites loaded composites which allow the absorption of the EM waves at low frequencies. These ferrites are expansive and heavy, but present advantages like impedance close to the one of free space, which allows direct transmission without any significant reflection at the surface, and magnetic losses, meaning that the wave is almost completely absorbed inside the material. Furthermore, the ferrite tiles work at low frequencies, between 30 MHz and 600 MHz.
The second, and the most used material in anechoic chambers, is the pyramidal absorber based on loaded foam materials. They work at higher frequencies, superior to 1 GHz. A good performance has been found when the thickness of the pyramids is equal to several wavelengths. In fact, with the pyramidal geometry, multiple reflections occur at the interface air/material, and for each
interaction/reflection, a portion of the wave is absorbed inside the material resulting in a very small portion of the incident wave which survived to the multipath reflections.
The pyramidal absorbers are currently made of polyurethane foam loaded with fine carbon particles in order to provide the electromagnetic absorption. Although these materials have various advantages, they have also disadvantages. The first one is their poor mechanical properties, with a great flexibility. The latter often gives rise to non-reproducible machining shape, and therefore, induces non-reproducible properties. Also, it limits their machining to simple shapes (such as pyramids), while complex shapes can be considered to improve the absorption properties. An inhomogeneity of the composition has been also highlighted. It is mainly due to the elaboration method, which consists of an impregnation of the foams in carbon solutions. This method is the only possible way to introduce the carbon particles in the foams in order to bring the absorption properties. Moreover, this method does not introduce the carbon particles in the foam matrix, but actually, place them on the walls, allowing the load to escape throughout the lifetime of the absorber: the induced volatile dust particles become then hazardous to the human health. The evolution of REACH standards aims to prohibit in the coming years the use of fine carbon particles for this application. In fact, the polyurethane foam is also targeted by these standards because of the pollution caused by their elaboration. For all these reasons, the achievement of new materials, which could replace the polyurethane foam loaded with fine particles, becomes urgent.
The subject of the present thesis is to propose solutions to replace the used material in anechoic chambers and to optimize their absorption properties by showing the potential of: using new materials (developed in Chloé Mejean PHD thesis), optimizing the existent absorber geometries, proposing new absorber shapes and combine natural absorbers with metamaterials. This work, supported by the Direction Générale de l’Armement (DGA), was conducted at the Institut
d’Electronique et de Télécommunications de Rennes (IETR), with the Systèmes Rayonnants Complexes (SRC) team and the Matériaux Fonctionnels (MF) team of the Antennes et Dispositifs Hyperfréquences department (ADH).
This thesis manuscript is organized like explained below:
The first chapter quickly presents the materials characterization techniques. A new measurement method, in non-anechoic environment, is proposed and validated by measuring two reference materials.
In Chapter 2, after a brief description of the new absorber material made of loaded epoxy foam, we first measure its dielectric properties to further be used for the simulation (using CST Microwave Studio software) of a pyramid absorber having the same geometry size as a commercial one. A prototype is developed with the optimum composition of the composite, previously defined by simulations. The prototype is then characterized and compared to the commercial absorber.
27
absorption. A prototype of the optimized form is then proposed using the new composite absorber material. The prototype is measured and compared to the first pyramidal prototype.
In the last chapter of the manuscript, the optimization of the absorption performance is studied by the association of natural pyramidal absorber to an artificial material, a metamaterial. Two structures (2D and 3D) metamaterials are studied by simulations. Hybrid prototypes "commercial pyramidal material + 2D metamaterials" are achieved, characterized and compared to the pyramidal absorber alone.
At the end of the manuscript, the conclusion summarizes the main obtained results and perspectives to this work are given.