59 © The Author(s) 2016
A. Esteve, R.J. Lesthaeghe (eds.), Cohabitation and Marriage
in the Americas: Geo-historical Legacies and New Trends,
DOI 10.1007/978-3-319-31442-6_3
Chapter 3
Cohabitation and Marriage in Canada. The
Geography, Law and Politics of Competing
Views on Gender Equality
Benoît Laplante and Ana Laura Fostik
1
Introduction
Canada is a federation of ten provinces and, nowadays, three territories. Most of the population lives in the provinces. Table 3.1 shows the proportion of women cohabit-ing among women aged 15–49 livcohabit-ing in a marital union in 1986, 1996 and 2006. This proportion has increased over time in all provinces and territories. The spread of unmarried cohabitation was larger from 1986 to 1996 than from 1996 to 2006. The increase has been more important in Quebec and in the territories. This conju-gal arrangement remains more common in Quebec than elsewhere in Canada.
There is scarce research on unmarried cohabitation in the territories. A large frac-tion of their inhabitants are First Nafrac-tions members. Most other inhabitants are peo-ple coming from other parts of the country who live there, usually for their work, for a limited time. The level of unmarried cohabitation has increased in the territories between 1986 and 2006; thus, the current level cannot easily be explained by the persistence of pre-European customs among members of First Nations. Part of the increase may be due to the increase of the proportion cohabiting among the people from the First Nations, maybe linked to the demise of Christian infl uence. Part may be due to an increase in the proportion cohabitating among people coming from other parts of Canada. In the latter case, unmarried cohabitation could be associated with internal migration and the fact that some of the people who live temporarily in the territories may fi nd cohabitation better suited to their transitory situation than marriage.
The high level of unmarried cohabitation in Quebec is known since the 1980s. Consequently, a substantial part of the research on unmarried cohabitation in
B. Laplante (*) • A. L. Fostik
Centre Urbanisation Culture Société, Institut national de la recherche scientifi que (INRS) , Université du Québec , Montréal , QC , Canada
Canada has actually focused on Quebec. Most of the research that has not focused on Quebec has dealt with Canada as a single unit, with little attention to regional differences, and with the assumption that, outside Quebec, the spread and meaning of cohabitation are similar to what they are in the United States.
In this chapter, we look at unmarried cohabitation in Canada with a stress on regional differences. We begin with a review of previous research and an overview of the legal context of marriage and unmarried cohabitation in Canada. We use cen-sus data from 1986, 1996 and 2006 to explore the relations between age, education and unmarried cohabitation within the provinces and territories.
We then use data from census and two surveys to examine the individual factors that could explain the differences in the spread of unmarried cohabitation between Quebec and the rest of Canada. Analyses lead to conclude that the differences arise from the institutional settings rather than being related to individual characteristics. Quebec law uses unmarried cohabitation and marriage to accommodate two com-peting views of gender equality—one that rests on the assumption that spouses should be as economically independent as possible during and after marriage, while the other contends that equality implies dependence even after separation or divorce—whereas in the rest of Canada, law implements only the second one, more in marriage, but also in unmarried cohabitation.
The analyses also point to differences within English Canada that, as far as we know, had not been noticed in previous research: unmarried cohabitation seems to be more common in Eastern Canada than in Western Canada, which might be related to immigration.
Table 3.1 Percent of Canadian women cohabiting among women aged 15–49 living in a marital
union by province and census year
Year
Province or territory 1986 1996 2006
Newfoundland and Labrador (NL) a 5.4 13.4 20.1
Prince Edward Island (PE) 7.1 12.3 18.2
Nova Scotia (NS) 9.3 15.5 23.4 New Brunswick (NB) 8.0 17.4 25.1 Quebec (QC) 16.9 33.5 48.6 Ontario (ON) 8.9 12.3 16.4 Manitoba (MB) 9.3 13.9 18.4 Saskatchewan (SK) 8.4 14.0 19.2 Alberta (AB) 11.2 15.0 19.9 British Columbia (BC) 12.0 16.3 19.8
Yukon Territory (YT) 23.1 30.8 36.6
Northwest Territories (NT) b 20.3 37.0 41.2 Source : Authors’ tabulations based on the 1986, 1996 and 2006 Canadian census data
a In 2001, the offi cial name of Newfoundland became Newfoundland and Labrador. For brevity, we sometimes refer to this province using its older and shorter name
b Until 1999, there were only two territories, Yukon and the Northwest Territories. In April 1999, the eastern portion of the Northwest Territories became a separate territory, Nunavut. To maintain coherence over time, we treat Nunavut as if had remained united with the Northwest Territories
61
2
Terminology: Language Matters
According to offi cial demographic terminology, there are two kinds of marital unions: marriage and consensual union. 1 Marriage is typically solemnized and
reg-istered; consensual union is typically neither solemnized nor registered. Both are stable forms of relationships that involve cohabitation and both may have civil effects.
Sociologists and demographers routinely use the word “cohabitation” to refer to unmarried cohabitation, and “marital union” as a synonym of “marriage”. Using “cohabitation” for “unmarried cohabitation” seems to have roots in early modern studies on college students living together without being married. In today’s par-lance, this was a form of transitory room sharing with benefi ts that might or might not have led to marriage, but obviously not a substitute for marriage (e.g. Macklin 1972 ). It was dubbed “premarital cohabitation” and, at some point, for convenience or otherwise, it became shortened to “cohabitation”.
Recently, “partner” and “partnership” have become common in English-speaking literature on unmarried cohabitation, but their meaning is uncertain. At times, part-nership is used for what is “marital union” in the dictionaries, and there are two types of “partnership”: marriage and “cohabitation”. At times, “partnership” means unmarried cohabitation, maybe with a nuance of stability; in such a case, there is no word for the larger category of “marital union”.
Things would be less confusing if demographers abided by their dictionaries. They would allow brevity to anyone writing about Canada. Everything relevant would fi t in two sentences:
– In Canada, consensual union is a legal institution.
– Canadian demographers do not abide by the dictionaries: they use “common-law union” for consensual union in English, and “union libre” in French.
3
Previous Research
Anecdotal evidence suggested that by the end of the 1970s, unmarried cohabitation was no more an isolated phenomenon in Canada. In the 1981 Census, Statistics Canada attempted to enumerate unmarried partners by instructing them to answer the question on the relation to the head of the household as if they were husband or wife. Spouses were to be distinguished from unmarried partners using marital sta-tus. Given that, at any time, some unmarried partners are still married to their “for-mer” spouse, this strategy led to the misclassifi cation of such individuals and the underestimation of unmarried partners (Dumas and Bélanger 1996 ). The 1986
1 See, for instance, the Multilingual demographic dictionary , 2nd ed. (Liège: Ordina: 1982), or the
Population Multilingual Thesaurus , 3rd ed. (Population Information Network, Paris: CICRED:
1993).
Census used the same strategy, but since 1991, the Census form uses different cat-egories for spouses and unmarried partners in the question on the relation to the head of the household, as well as a direct question on living or not in a common-law union, separate from the question on marital status.
In 1984, a research team led by academics and funded by the Social Sciences and Humanities Research Council conducted the National Fertility Survey, the fi rst bio-graphical survey of family events carried out using a probabilistic sample of the Canadian population (Balakrishnan et al. 1993 ). The same year, Statistics Canada conducted a somewhat similar survey, the Family History Survey (Burch and Madan 1986 ). Since then, Statistics Canada has conducted retrospective biographical sur-veys on family events in 1990, 1995, 2001, 2006 and 2011 as part of its General Social Survey program. Much if not most of the demographic research on unmar-ried cohabitation in Canada has been done using either census data or data from these biographical surveys.
Some of the research published in the 1990s—such as Dumas and Péron ( 1992 ), Balakrishnan et al. ( 1993 ) and Dumas and Bélanger ( 1996 )—focused on document-ing the rise of unmarried cohabitation. The main fi nddocument-ing was that “livdocument-ing common- law” was more widespread in Quebec that in the rest of Canada. Others looked more specifi cally at the relation between living in a common-law union and sociodemo-graphic characteristics (Turcotte and Bélanger 1997 ; Turcotte and Goldscheider 1998 ; Bélanger and Turcotte 1999 ). Kerr et al. ( 2006 ) conducted the most recent study of this type, which confi rmed what had emerged over the previous decade or so: unmarried cohabitation is associated with lower social status in English-speaking provinces, but not in Quebec.
Given these results, it is no surprise that Quebec demographers got interested in the “meaning of cohabitation”. Early research investigated whether unmarried cohabitation was a prelude to marriage or an alternative to marriage, without pro-viding a defi nitive answer (Lapierre-Adamcyk et al. 1987 ; Lapierre-Adamcyk 1989 ). Several years later, it had become clear that, at least in Quebec, unmarried cohabitation was not just premarital cohabitation (Le Bourdais and Marcil-Gratton 1996 ; Le Bourdais and Neill 1998 ; Le Bourdais et al. 2000 ; Le Bourdais and Lapierre-Adamcyk 2004 ). Comparative research showed that unmarried couples stayed together longer in Quebec than in Ontario, and were less prone to marry (Le Bourdais and Marcil-Gratton 1996 ; Lapierre-Adamcyk et al. 1999 ). Comparative research also showed differences in values. In Quebec, young people favoured val-ues pointing towards a redefi nition of the conjugal union: compared to young peo-ple from Ontario, they gave less importance to a stable coupeo-ple relationship, less importance to marriage as a source of happiness, and more importance to work (Lapierre-Adamcyk et al. 1999 ). Péron ( 2003 ) summed up this line of research in the title of a book chapter he wrote on nuptiality in Quebec, stating that from the beginning to the end of the twentieth century, marriage went from being a necessity to being an option. Lachapelle ( 2007 ) added one important nuance to this synthesis: unmarried cohabitation is not more common in Quebec than in the rest of Canada, it is more common among French-speaking Quebeckers than among other Canadians.
63
Given that from the 1970s to the end of the 1990s, fertility had plummeted in Quebec, some looked into the relation between the diffusion of unmarried cohabita-tion and the decrease of fertility. The prevailing view was that Quebec low fertility was caused by Quebeckers’ fondness for cohabitation. Rochon (1989) found that within age groups, women who live or have lived in common-law union had fewer children, on average, than women who were married or had been married. According to Caldwell (1991) and Caldwell et al. (1994), the high proportion of Quebec women living in a common-law union and the instability of their chosen form of union explained their high level of childlessness. Dumas and Bélanger (1998) con-cluded that fertility is lower within common-law union than within marriage. Krull and Trovato (2003) found that low marriage rates among Quebec women were a key factor of Quebec low fertility in the 1990s. Lapierre-Adamcyk and Lussier (2003) also found that the overall impact of unmarried cohabitation in Quebec was to reduce general fertility. Caron-Malenfant and Bélanger (2006: 88) reported results in which fertility was lower for women living in a common-law union than for mar-ried women. This line of research ended recently, probably because since the mid- 2000s, the TFR is higher in Quebec than in Ontario. The new difference is interpreted as an effect of family policies: the public provision of parental leave and childcare is more generous in Quebec than in Ontario (Beaujot et al. 2013 ). Interestingly, such an explanation assumes implicitly that fertility may be as high within unmarried cohabitation as within marriage, and that unmarried partners may be as responsive to policies as spouses. Recent work by Laplante and Fostik ( 2015 ) shows that among French-speaking Quebeckers, consensual union has become the main locus of fertility.
Recent research takes unmarried cohabitation as a given. Lachance-Grzela and Bouchard ( 2009 ) fi nd little differences in the quality of the relationship between unmarried partners and spouses in Quebec. Laplante and Flick ( 2010 ) found that in Ontario, reported measures of health were signifi cantly lower among unmarried partners than among spouses, but found little differences between the two groups in Quebec. Lardoux and Pelletier ( 2012 ) found that, in Quebec, having unmarried par-ents has no negative effect on educational outcomes for boys, and a positive out-come for girls.
Much of the research on unmarried cohabitation in Canada has focused on Quebec. Quebec demographers know the American literature and cite it, but they also know the French literature and it is no surprise that, on this topic, they seem to fi nd more similarities between Quebec and France than between Quebec and the USA. The article by Villeneuve-Gokalp ( 1990 ), in which the diffusion of unmarried cohabitation in France in the1980s is documented, is widely cited by them. More recently, studies on the use, by opposite-sex couples, of PACS,—a form of “depen-dence free” registered partnership originally designed for same-sex couples—has attracted some interest for its practical similarity with common-law union (on PACS, see Rault 2009 ).
Some of the research on unmarried cohabitation in Canada as a whole has been done with an eye on the American experience. From this perspective, unmarried cohabitation is considered something that delays marriage, or a step in the
tion of a new marriage after divorce. Pollard and Wu ( 1998 ), Wu ( 1995 , 1996 , 1999 ) as well as Wu and Balakrishnan ( 1995 ) are typical examples of this approach, in which “cohabitation” in Canada appears to be similar to “cohabitation” in the USA, once admitted that things are different in Quebec. Wu ( 2000 ) concludes the book in which he summed up the research he conducted in the 1990s by pleading for a legal framework of common-law union that would give it the same civil effects as mar-riage especially for the sharing of assets and spousal support.
The current dominant view is that in Quebec, or more precisely among French- speaking Quebeckers, living in a consensual union is as normal or mainstream as it is in France or in the Nordic countries, whereas outside Quebec and among non- French- speaking Quebeckers, it is either a convenient transient state for young adults or an alternative form of marriage for the poor, pretty much as it is held to be in the USA.
4
Legal Context
The regional differences in the spread of unmarried cohabitation across Canada are closely related to differences in legal systems. Canada is a federation formed by grouping together, from 1867 onwards, the British possessions in North America. Newfoundland, in 1949, was the last British colony to become a Canadian province. According to the 1867 Constitution, the federal Parliament has exclusive legislative authority over “Marriage and divorce”, whereas “the solemnization of marriage in the province” and “property and civil rights in the province” fall under the jurisdic-tion of each province. The legislative authority of the federal Parliament on mar-riage is limited to impediments. “Property and civil rights” include much of family law, especially marital property. The authority of the federal Parliament over divorce has been interpreted by the courts as including spousal support, child custody and support, as well as the grounds for divorce. However, judicial separation and annul-ment, which have consequences very similar to those of divorce, fall under provin-cial jurisdiction. All Canadian provinces have inherited English common law as the basis of their private law, except Quebec whose private law is based on French civil law.
The difference between Quebec and the rest of Canada involves language and religion as much as law. Quebec was predominantly Catholic whereas the rest of Canada, with the exception of Newfoundland and Labrador, was mainly Protestant. About 80 % of Quebeckers speak French as their fi rst language, whereas English is the fi rst or main language of the vast majority of the population in all other prov-inces and territories, except New-Brunswick, where French is the fi rst language for a large fraction of the population and which is the only offi cially bilingual province. However, although language and the relation to religion are essential to understand how cohabitation may have become so widespread in Quebec, the values and mech-anism that support cohabitation in Quebec nowadays are embodied in law and are best understood by focusing on legal issues.
65
Until 1969, divorce, although falling under federal jurisdiction since 1867, was actually regulated by the law as it existed in each province before 1867. Former colonies which had allowed courts to grant divorce before 1867 kept allowing it, whereas in the other provinces, such as Ontario and Quebec, divorce had to be granted by a private bill from the federal Parliament, as in the UK until 1857. In 1968, the federal Parliament passed the Divorce Act (S.C. 1967–8, c. 24), enforcing the same provisions for all of Canada. From that moment, divorce was granted by courts in all of Canada and became an important feature of family law and, so to speak, of everyday life.
As seen in Table 3.1 , common-law union became statistically noticeable in the 1980s. Although common-law union remains limited in spread in English Canada, the legal situation of unmarried couples and their children was dealt with by the federal Parliament, the provincial legislatures and the courts. A series of rulings of the Supreme Court, changes in status law in the common-law provinces and to sta-tus law and the Civil Code in Quebec progressively reduced the differences between married and unmarried couples. In their dealings with the State and with third par-ties (employers, insurance companies, etc.), married and unmarried couples are treated in the same way. Legal rights and obligations between parents and children depend solely on fi liation, not on the circumstances of birth. Furthermore, Canada’s welfare system is a mix of the liberal and the Nordic welfare regimes and, as in the Nordic welfare state regime, social rights largely depend on individual characteris-tics and not on marital status. Having access to health insurance or favourable taxa-tion are no more incentives for marriage in Canada than in the Nordic countries (see Andersson et al. 2006 ). The legal recognition of consensual union is extended to foreigners: Canadian immigration law handles in the same way married couples and couples living in a consensual union. As we saw earlier, Statistics Canada gathers and publishes information on consensual unions since the 1980s, using the terms “common-law union” in English and “union libre” in French. The remaining legal differences between married and unmarried couples are mainly limited to the degree of economic dependence between the two persons who live together, and they are a consequence of competing visions of individual autonomy within the couple rather than a form of discrimination. In Canada, consensual union has become a social and a legal institution.
The prevailing view in the English-speaking provinces is that marriage is a rela-tion based on mutual dependence. Within marriage, gender equality is best defi ned relative to divorce and implies the equal sharing of assets and spousal support that ideally allow the economically dependent spouse to maintain her standard of living. In principle, the same should apply to common-law union. In all common law prov-inces, legislatures have passed statutes on “domestic relations” that govern the eco-nomic relations between the spouses or partners, with some freedom to write agreements on the sharing of assets, the extent of the freedom being typically greater for partners than for spouses.
In Quebec, there are two competing views of what should be gender equality within the couple: the one that is prevailing in the English-speaking provinces, and one that says that gender equality fi rst implies economic independence. According
to the second view, property should be separate as a principle, spouses and partners being free to write down whatever agreement suits them best, and spousal support should not exist. The strength of the two competing views eventually led the Quebec government to implement a system that accommodates both, but signifi cantly altered the meaning of marriage. Allowing spouses to keep their property separate if they wished so, and to write whatever contractual agreements suit them best had been a traditional feature of French and Quebec law. However, the Quebec govern-ment redrew marriage in such a way that, for most practical purposes, assets earned once married are deemed common and are split equally upon divorce; furthermore, private agreements that depart from that rule are void. From contemporary docu-ments (e.g. CSF 1978 , 1986 ), it was clear from the beginning that with such a redefi -nition of marriage, common-law union, which was already attracting many, should become the legal form of marital union for couples who want their relation based on economic independence. This was a drastic change, but was met with very little opposition.
How it became almost natural to implement a legal solution that would literally push a large fraction of the population away from marriage in a province tradition-ally as close to the Catholic Church as, say, Ireland or Poland, is dealt with in Laplante ( 2006 , 2014) and Laplante et al. ( 2006 ). Basically, the French-speaking Catholics broke away from the Church almost instantly at the end of the 1960s, after a decade of rapid and deep social change. The Humanae Vitae encyclical, in which the Church restated its ban on contraception, acted as a catalyst. Until 1968, in Quebec, marriage had to be solemnized by a priest or some other religious minister and, despite all civil effects of marriage being detailed in the Civil Code, the com-mon view was that marriage was a religious institution. The depth of the social change, the rise of feminism and the fl urry of new issues related to sex and the fam-ily on which the Church was perceived as disconnected from modernity—divorce, abortion, homosexuality—debased the Catholic doctrine. Marriage became optional in this context. The process may have been similar to the one that led to the loss of meaning of marriage in East Germany after the rapid and deep changes that fol-lowed German reunifi cation (Perelli-Harris et al. 2014 ).
Currently, in Quebec, spouses and unmarried partners receive equal treatment by the State and third parties, and children have equal rights in all respects whether or not their parents are married. The differences between spouses and unmarried part-ners are in the sharing of property and the right to spousal support after the break-down of the union. Unmarried partners may keep all their property separate if they wish so, as spouses could do until 1989. Unmarried partners are not entitled to “spousal” support from a former partner. As before 1989, spouses may choose between two matrimonial regimes: separation as to property or partnership of acquests. However, since 1989, even for spouses who chose separation as to property, the accrued value of the home and second home, of pensions and retire-ment savings, the cars used by the family, the furniture and some others assets are shared equally upon separation or divorce. Whatever the matrimonial regime, spouses are entitled to spousal support after separation or divorce. Since 1989,
sepa-67
ration as to property has little other use than allowing spouses to maintain their businesses assets separate.
The Quebec legal “balance” between the two competing views of gender equal-ity has been challenged in court. The case opposed a former unmarried partner— born in a Latin American country where, under some circumstances, consensual union has all the civil effects as marriage—to one of Quebec most successful and richest businessmen. She asked for spousal support and the equal sharing of assets as if she had been married under the regime of partnership of acquests—something rather unlikely for married couples comprising a prominent businessperson. Given the Canadian legal context, to get in court, the case had to be framed as a form of discrimination. Not imposing the sharing of assets and the entitlement to spousal support to unmarried partners was thus argued to be a form of discrimination against unmarried partners.
Given the stakes, several third parties were involved, including the Quebec gov-ernment, which insisted on keeping the balance it had painstakingly achieved in 1989. Interestingly, both the plaintiff and the Quebec government used demogra-phers as experts. Thus, Céline Le Bourdais and Évelyne Lapierre-Adamcyk wrote reports and testifi ed as experts for the Quebec government whereas Zheng Wu did so for the plaintiff.
The case was heard by the Supreme Court, which was asked to answer two ques-tions: whether not imposing the sharing of assets and spousal support to unmarried partners was a form of discrimination and, if so, whether it was an acceptable form of discrimination. Five of the nine judges answered “yes” to the fi rst question, and fi ve answered “yes” to the second. The Chief justice is the one who answered “yes” to both (SCC 2013 ). This decision upheld Quebec law and probably avoided a con-stitutional crisis. Recently, the Conseil du statut de la femme , the Quebec govern-ment agency that advises the governgovern-ment on women’s rights, changed its position. After having advocated during decades for a strong economic dependence between spouses after divorce and freedom in these matters for unmarried partners, it now supports imposing the sharing of assets and “spousal” support for unmarried part-ners upon and after breakup (CSF 2014 ).
5 Consensual Union as a Function of Age and Education
Table 3.1 shows that, overall, in all Canadian provinces and territories, the propor-tion of women living in a marital union who live in a consensual union rather than being married has increased from 1986 to 2006. The question still at the core of most inquiries about the diffusion of consensual union is whether this phenomenon is primarily the outcome of a change in values—an ideational change—or the con-sequence of a change in the economic conditions of young people.
It is commonly assumed that if the diffusion of consensual union is primarily the consequence of a change in the economic conditions of young people, living in a consensual union should be negatively associated with education: the proportion of
women living in a consensual union should be low among highly educated women and remain so across periods.
It is commonly assumed that if the diffusion of consensual union is primarily the outcome of an ideational change, the diffusion of consensual union should start among highly educated women and then spread to the less educated. Thus, living in a consensual union should be positively associated with education at the beginning of the process, and uncorrelated with it at the end, once it has become a socially accepted form of relationship or maybe even a new norm.
In both cases, the proportion of women living in a consensual union should decrease with age. As a “new” pattern of behaviour, it should be more common among the young than among the old and remain so until the end of the diffusion process. Furthermore, given that, over time, a couple may transform its consensual union into a marriage, but not its marriage into a consensual union, the proportion of women living in a consensual union among women living in a marital union should decrease with age even once the diffusion process is over.
Figure 3.1 reports the proportion of women living in a consensual union among women aged between 15 and 49 living in a marital union in each Canadian province and territory in 1986, 1996 and 2006. Looking at this fi gure leads to four main fi nd-ings. In most provinces this proportion decreases with age. It increases from one census to the next for all ages in each province and territory. It is higher in Quebec and in the territories than in the rest of Canada. In most provinces and territories, the increase seems to have been larger between 1986 and 1996 than between 1996 and 2006.
Figures 3.2a , 3.2b , 3.2c , 3.2d , 3.2e and 3.2f allow exploring the relation between consensual union and education. They report the proportion living in a consensual union among women living in a marital union according to level of education within 5-year age classes, for women aged between 20 and 49, in each Canadian province and territory in 1986, 1996 and 2006.
Among women aged 20–24, the proportion is high, it increases from one census to the next and there is no strong relation with education, except in 1996 in Saskatchewan, and in 1996 and 2006 in the Northwest Territories, where the propor-tion decreases as the level of educapropor-tion increases. In 2006, the levels are higher in Eastern Canada—Newfoundland, Nova Scotia, New Brunswick and Quebec—than in Western Canada—Ontario, Manitoba, Saskatchewan, Alberta and British Columbia.
Among women aged 25–29, the proportion is still high, but lower than among women aged 20–24. It increases from one census to the next. It is higher in Eastern Canada than in Western Canada, much higher in Quebec than in the other provinces, much higher in the territories than in all provinces but Quebec. In 2006, the propor-tion slightly decreases as the level of educapropor-tion increases in most provinces and territories, but clearly not in Quebec where there is no apparent relation between consensual union and education.
Among women aged 30–34, the proportion is still lower than among women aged 25–29. It tends to be higher in Eastern Canada than in Western Canada, even higher in the territories, and higher still in Quebec. In 2006, the proportion decreases
69
as education increases, but the slope varies across provinces and territories, tending to be larger where the proportion is higher, except in Quebec where the slope is small despite the proportions being high. Among women aged 35–39, the propor-tion is lower. It tends to be higher in Eastern Canada than in Western Canada, again higher in the territories and still higher in Quebec. In 2006, the proportion decreases as education increases in the same fashion as among women aged 30–34. The levels are still lower among women aged 40–44, in all provinces but Quebec. They are
Fig. 3.1 Percent of women living in a consensual union among women aged 15–49 living in a
marital union
Source : Authors’ elaboration based on 1986, 1996, and 2006 Canadian census data 3 Cohabitation and Marriage in Canada. The Geography, Law and Politics…
higher in the territories; in 2006, in the territories, the association between consen-sual union and education appears to be strong. In Quebec, the proportion is higher and, in 2006, there is no clear relation between consensual union and education.
One fi nal fact is worth noting. In Quebec, in 1986, the proportion of women liv-ing in a consensual union slightly increases as the level of education increases
Fig. 3.2a Percent of women living in a consensual union among women aged 20–24 living in a
marital union by level of education
Note: < Sec Less than Secondary Completed, Sec Secondary Completed, Post-Sec Post-Secondary Completed, Uni University Completed
71
among women 25–29 and 30–34. Something similar can be seen among women aged 40–44 in 1996.
In Quebec, the pattern suggests that the diffusion of consensual union is the out-come of an ideational change. The proportion of women living in a consensual union is slightly higher among educated women in what could have been “leading”
Fig. 3.2b Percent of women living in a consensual union among women aged 25–29 living in a
marital union by level of education
Note : < Sec Less than Secondary Completed, Sec Secondary Completed, Post-Sec Post-Secondary Completed, Uni University Completed
Source : Authors’ elaboration based on 1986, 1996, and 2006 Canadian census data 3 Cohabitation and Marriage in Canada. The Geography, Law and Politics…
cohorts. In recent censuses, the proportion is high even among women aged between 40 and 44, with little variation across education levels.
Things are different in the rest of Canada. Despite interesting regional differ-ences between East and West and between provinces and territories, the overall pattern is quite similar. The proportion of women living in a consensual union is
Fig. 3.2c Percent of women living in a consensual union among women aged 30–34 living in a
marital union by level of education
Note : < Sec Less than Secondary Completed, Sec Secondary Completed, Post-Sec Post-Secondary Completed, Uni University Completed
73
comparatively high among young women, aged between 20 and 29, with little varia-tion across educavaria-tion levels. The proporvaria-tion is lower among older women, and decreases as education increases. The diffusion of consensual union among the young can be interpreted as the outcome of an ideational change allowing transitory relations similar to those of the 1970s college students. Among women aged over
Fig. 3.2d Percent of women living in a consensual union among women aged 35–39 living in a
marital union by level of education
Note : < Sec Less than Secondary Completed, Sec Secondary Completed, Post-Sec Post-Secondary Completed, Uni University Completed
Source : Authors’ elaboration based on 1986, 1996, and 2006 Canadian census data 3 Cohabitation and Marriage in Canada. The Geography, Law and Politics…
30, the association between consensual union and education is consistent with an explanation involving the economic condition of the individuals.
Phrased this way, such an interpretation would lead to conclude that there has been little relation between the change in the economic conditions of the young, from 1976 onwards, and the diffusion of consensual union. Looking at the context
Fig. 3.2e Percent of women living in a consensual union among women aged 40–44 living in a
marital union by level of education
Note : < Sec Less than Secondary Completed, Sec Secondary Completed, Post-Sec Post-Secondary Completed, Uni University Completed
75
offers a slightly alternative view in which the change in the economic conditions of the youth and the diffusion of consensual union as their preferred from of marital relationship are related through their common dependence on a more fundamental change.
Fig. 3.2f Percent of women living in a consensual union among women aged 45–49 living in a
marital union by level of education
Note : < Sec Less than Secondary Completed, Sec Secondary Completed, Post-Sec Post-Secondary Completed, Uni University Completed
Source : Authors’ elaboration based on 1986, 1996, and 2006 Canadian census data 3 Cohabitation and Marriage in Canada. The Geography, Law and Politics…
Figure 3.3 reports the evolution of the median market income according to age class and sex for men and women aged 20–24 and 25 to 34 in Canada from1976 to 2011, expressed in thousands of Canadian 2011 constant dollars. Between 1976 and 1996, the real median income of young men and women aged 20–24 decreased annually by an average rate of 3.58 % and 3.44 % respectively, whereas the real median income of men aged 25–34 decreased annually by 1.83 % and the real median income of women of the same age class remained stable. From 1996 onwards, the real median income of all groups have been increasing by almost 1.5 % a year, except for men aged 25–35 for which the increase has been close to 1 %.
Although some other interpretation may be possible, from a demographic per-spective, the decrease in the income of young men and women aged 20–24 is likely to be related the postponement of the transition to adulthood. Between 1976 and 1996, the proportion of men and women aged 20–24 engaged in postsecondary education has increased, leading to the decrease in median income, either because some do not have any market income at all, or because their market income comes from part time work or seasonal work combined with college or university atten-dance. From this perspective, living in a consensual union may be seen as associated with low income, but the association is somewhat spurious. Low income and potentially transitional marital relationship are likely two markers, outcomes or consequences of the postponement of the transition to adulthood. In other words, low income is likely not the cause of the prevalence of consensual union among the
Fig. 3.3 Median market income according to age and sex, men and women aged 20–24 and
25–34. Canada, 1976–2011 (Thousands of Canadian 2011 constant dollars)
Source : Statistics Canada, Labour Force Survey, CANSIM table 202-0407 (Income of individuals, by sex, age group and income source, 2011 constant dollars)
77
young. Apparently the diffusion of the postponement of adulthood ended around 1996. Since then, the median income of both men and women aged 20–24 has increased slowly, but steadily, likely because the proportion enrolled in postsecond-ary education has reached a plateau.
The evolution of the median income of men and women aged 25–34 tells a some-what different story. The decrease in the real median wage of men is likely a conse-quence of the postponement of the transition to adulthood. Still in the 1970s, men were expected to have “real” jobs providing a real male breadwinner income, whereas women were not yet expected to work full time or even at all once married. Between 1976 and 1996, this has changed, more men becoming enrolled in postsec-ondary education in their late 20s and even early 30s, and more women adopting patterns similar to those of the men of the same age.
If this interpretation is correct, the diffusion of consensual union among the Canadian youth outside Quebec could be interpreted mainly as a consequence of the postponement of the transition to adulthood in a world that accepts marital relation-ships outside of marriage. The limited diffusion of consensual union among women aged at least 30 and its negative association with education would mean that after age 30, consensual union is somehow related with lower social status or lower eco-nomic conditions.
In Quebec, the postponement of adulthood is likely to have been related with the diffusion of consensual union among the young in the same way as in the rest of Canada, but the ideational change has been deeper and consensual union has become a mainstream form of marital union for women aged 30 or more. The narrowing difference between the real median income of men and women aged 25–34, which does not seem to be related to the diffusion of consensual union outside Quebec, is likely to have been a key factor in Quebec. More equal incomes across genders, and likely within many couples, have empowered women in a way that made them eco-nomically independent and thus favoured a form of marital union that does not enforce economic dependence between the partners. This did not happen in the rest of Canada, but it is consistent with the conception of gender equality within the couple on which the current Quebec legislation on consensual union is based.
6
Hypotheses
Consensual union is more common in Quebec than in the rest of Canada. The asso-ciation between living in a consensual union, age and education is weak to non- existent in Quebec, but clear in the rest of Canada. The evolution of the median income of young men and women during the years from 1976 onwards and the pattern of the relation between living in a consensual union and age and education suggest that outside Quebec, consensual union is a widespread form of marital rela-tionship, likely transitory, for the young, and a “cheap” form of marriage for people aged at least 30. In Quebec, consensual union among the young may be hard to
distinguish from consensual union among the young in the rest of Canada; however, among women aged at least 30, it is not related to lower education, but, given the legal context and what is known from previous research, likely to be related with independence and gender equality within the couple. If this is true, economically independent women should be more likely to live in a consensual union than being married in Quebec, but not in the rest of Canada. Furthermore, favouring values related with individual autonomy should increase the probability of living in a con-sensual union rather than being married in Quebec, but not in the rest of Canada, or, at least, not as much in the rest of Canada as in Quebec. We perform three analyses related to these hypotheses.
In the fi rst one, we focus on the economic role of the woman in the couple. We use being the main source of income in the family, combined with labour force status, as an indicator of one aspect of the level of economic independence of women. We expect women who are the main source of income in their family and are in the labour force to be more likely to live in a consensual union rather than being married in Quebec, but not as much or less so in the rest of Canada.
In the second analysis, we focus on the effect of the level of individual economic security provided by the job. We use holding a job in the public sector, in the private sector, being self-employed or being out of the labour force as an ordinal proxy of the level of economic security. In Canada, typically although not universally, jobs in the public sector are more stable and provide a higher level of social protection than jobs in the private sector. Obviously, the self-employed get less protection from their job than the employed. People out of the labour force are the most economi-cally insecure. Previous research and the legal context of consensual union and marriage suggest that, in Quebec, consensual union could be used by some women as a way to ensure their independence during and after their marital union, whereas marriage could be used by other women as a strategy to secure resources in the event of the breakdown of their union. If this were true, the probability of living in a consensual union rather than being married should increase as the level of job- related economic security increases. There should not be such an effect in the other provinces. Given the nature of the hypothesis, we estimate similar equations for men.
In the third analysis, we focus on the role of values. Data on values are scarce in Canada. We use the limited data available on Canada in the World Value Surveys aggregate sample to study the effect of the level of the importance given to the autonomy of the individual on the probability of living in a consensual union rather than being married. We expect the probability of living in a consensual union to increase with the importance given to autonomy in Quebec, but not as much or less so in the rest of Canada.
In all analyses, we control for age and education, combining them when the size of the sample makes it possible. Additional controls depend on the availability of data in each source and are detailed in the next section.
79
7
Data and Methods
7.1 The Economic Role of the Woman in the Couple
In this analysis, we use individual level data from the 20 % sample of the population that fi lled the “long” form of the Canadian census in 1986, 1996 and 2006. We model the probability of living in a consensual union rather than being married among Canadian women aged 15–49 living in a marital union as a function of a series of characteristics using logistic regression. We estimate separate equations for each province and territory.
We measure the level of economic independence by combining two binary vari-ables: being the main support of the family or not, being in the labour force or not. Combining these two variables defi nes a gradient of economic independence where being the main support and in the labour force implies the highest level of indepen-dence, being the main support and not being in the labour force the second, not being the main support and being in the labour force the third and not being the main support and not being in the labour force the last.
Age is grouped in 5-year classes. Education is measured as the highest level of education completed and grouped in four categories as in the fi gures: less than sec-ondary, secsec-ondary, non-university post-secondary education and university. Preliminary analyses showed that the effect of education varies according to age; we estimate the effect of education within age classes.
The data allow examining the effect of several other relevant factors.
Taken together, having lived previously in Quebec and speaking French form a proxy of having been socialised within French-speaking Quebec, where consensual union is more common; this may have an effect, even for people who reside outside Quebec at the time of census. Having children or not may have an effect on the probability of living in a consensual union. Given that having children while living in a consensual union is more common in Quebec than elsewhere in Canada and that the size of the sample allows it, we combine language, having previously lived in Quebec and having children or not. Taken together, these variables defi ne a series of combinations in which each category has its own effect. We report the results from a model in which these variables are combined as to defi ne such a series.
Census data also allow estimating the effect of belonging to a First Nation. We use the degree of freedom usually associated with the constant to estimate directly the odds of living in a consensual union rather than being married for each group resulting from the combination of age and education. This allows a direct and easy interpretation of the coeffi cient: if the coeffi cient for a given combination of age and education is 1, the base probability of cohabiting rather than being married is .5 If the coeffi cient is greater than 1, the base probability of cohabiting rather than being married is greater than .5 and if it is less than 1, the base probability of cohab-iting rather than being married is less than .5.
The coeffi cients associated with the other variables are interpreted in the usual way: they increase or decrease the base odds. In the Tables 3.2 , 3.3 and 3.4 the
T
able
3.2
Estimated odds ratios from a logistic re
gression model of li
ving in consensual union among w
omen aged 15–49 in marital union
by age, social and
economic characteristics, Canadian pro
vinces and territories in 2006
NL PE NS NB QC ON MB SK AB BC YT NT
Age and education 15–19
Less than secondary 5.91* 2.66 15.38*** 12.92*** 12.62*** 9.77*** 7.46*** 16.94*** 12.60*** 11.21*** 8.00 2.57 Secondary 6.04** 6.08** 34.16*** 6.58*** 14.86*** 5.51*** 6.11*** 13.54*** 10.95*** 7.86*** 3.78 33.28** Post- secondary 2.58 7.75 1.50 1.47 7.04*** 2.13*** 3.83** 3.56** 3.76*** 3.25*** (empty) 0.99 Uni v ersity (empty) (empty) 9.87 (empty) 0.98 0.44 (empty) (empty) 0.69 0.68 (empty) (empty) 20–24 Less than secondary 6.77*** 41.78*** 12.76*** 10.35*** 14.95*** 5.28*** 3.588*** 5.34*** 5.26*** 5.51*** 7.54** 6.47*** Secondary 8.01*** 4.53*** 6.90*** 5.82*** 12.68*** 3.99*** 3.36*** 4.41*** 4.70*** 3.62*** 3.75** 5.83*** Post- secondary 6.42*** 4.27*** 6.49*** 3.68*** 13.48*** 3.30*** 2.22*** 2.33*** 3.29*** 3.36*** 2.16 3.87* Uni v ersity 3.77*** 6.25*** 5.29*** 3.49*** 10.05*** 2.34*** 1.71*** 2.56*** 2.42*** 2.80*** 1.34 1.71 25–29 Less than secondary 2.18*** 2.60 2.79*** 2.26*** 6.79*** 2.12*** 1.74*** 1.33* 2.34*** 1.95*** 3.16* 1.54 Secondary 2.21*** 1.30 2.56*** 1.51*** 5.40*** 1.49*** 1.30** 1.03 1.40*** 1.49*** 2.17* 1.66 Post- secondary 1.55*** 0.68 1.76*** 1.16 6.10*** 1.25*** 1.03 0.80* 1.17*** 1.35*** 2.90* 1.88* Uni v ersity 1.28* 1.03 1.61*** 0.93 4.30*** 0.85*** 0.76** 0.55*** 0.83*** 0.97 1.76 1.10 30–34 Less than secondary 1.00 1.42 1.23 1.13 4.09*** 1.03 0.61*** 0.734* 0.95 0.88 0.88 1.47 Secondary 0.70* 0.71 0.9614 0.82 3.01*** 0.74*** 0.63*** 0.56*** 0.67*** 0.69*** 1.00 0.60 Post- secondary 0.71*** 0.60* 0.64*** 0.53*** 3.11*** 0.62*** 0.49*** 0.34*** 0.60*** 0.68*** 0.58 0.66 Uni v ersity 0.45*** 0.35*** 0.54*** 0.41*** 2.09*** 0.36*** 0.37*** 0.29*** 0.37*** 0.53*** 0.50* 0.50*
81 NL PE NS NB QC ON MB SK AB BC YT NT 35–39 Less than secondary 0.59*** 0.44 0.89 0.66** 2.50*** 0.67*** 0.48*** 0.44*** 0.61*** 0.61*** 0.91 0.62* Secondary 0.43*** 0.31*** 0.53*** 0.40*** 1.94*** 0.44*** 0.34*** 0.30*** 0.44*** 0.42*** 0.70 0.50* Post- secondary 0.36*** 0.34*** 0.42*** 0.30*** 1.82*** 0.38*** 0.31*** 0.22*** 0.35*** 0.39*** 0.38** 0.41*** Uni v ersity 0.24*** 0.24*** 0.38*** 0.21*** 1.43*** 0.22*** 0.22*** 0.19*** 0.23*** 0.31*** 0.49* 0.28*** 40–44 Less than secondary 0.40*** 0.44** 0.51*** 0.39*** 1.49*** 0.48*** 0.34*** 0.37*** 0.42*** 0.40*** 1.28 0.59* Secondary 0.31*** 0.24*** 0.34*** 0.26*** 1.17*** 0.30*** 0.20*** 0.22*** 0.28*** 0.30*** 0.31*** 0.29*** Post- secondary 0.21*** 0.23*** 0.36*** 0.25*** 1.17*** 0.29*** 0.24*** 0.18*** 0.25*** 0.32*** 0.35*** 0.36*** Uni v ersity 0.21*** 0.15*** 0.24*** 0.15*** 1.05* 0.18*** 0.18*** 0.17*** 0.18*** 0.20*** 0.27*** 0.26*** 45–49 Less than secondary 0.24*** 0.27** 0.37*** 0.30*** 0.87*** 0.33*** 0.27*** 0.22*** 0.33*** 0.36*** 0.91 0.46*** Secondary 0.17*** 0.29*** 0.25*** 0.16*** 0.79*** 0.24*** 0.17*** 0.12*** 0.23*** 0.26*** 0.29*** 0.35*** Post- secondary 0.17*** 0.17*** 0.24*** 0.18*** 0.78*** 0.25*** 0.17*** 0.11*** 0.23*** 0.29*** 0.36*** 0.21*** Uni v ersity 0.16*** 0.21*** 0.19*** 0.15*** 0.86*** 0.15*** 0.14*** 0.10*** 0.14*** 0.19*** 0.39* 0.18***
Economic independence: role and labour force status Main and in the LF (ref.)
1 1 1 1 1 1 1 1 1 1 1 1
Main and Out of the LF
1.16 1.64 1.22 1.34* 0.90** 0.98 1.12 1.43*** 0.99 0.79*** 1.36 1.17
Not main and In the LF
0.46*** 0.41*** 0.48*** 0.52*** 0.60*** 0.41*** 0.43*** 0.48*** 0.44*** 0.46*** 0.82 0.62***
Not main and Out of the LF
0.54*** 0.37*** 0.43*** 0.52*** 0.40*** 0.31*** 0.42*** 0.49*** 0.37*** 0.37*** 0.68 0.65* (continued)
T able 3.2 (continued) NL PE NS NB QC ON MB SK AB BC YT NT
Language, origin and children Other
, Other , None (ref.) 1 1 1 1 0.36*** 1 1 1 1 1 1 1 Other , Other , Children 0.46*** 0.47*** 0.41*** 0.42*** 0.10*** 0.38*** 0.39*** 0.45*** 0.36*** 0.39*** 0.37*** 0.60*** Other , Quebec, None 6.54 (empty) 1.39 2.22* 0.17*** 1.66*** 3.98* 1.89 1.28 2.12*** (empty) 2.04 Other , Quebec, Children 0.43 (empty) 0.81 0.88 0.07*** 0.45*** 0.05** 0.16** 0.23** 0.93 (empty) 0.19* French, Other , None 1.73 1.94** 1.12 1.98*** 0.99 1.58*** 0.72* 0.97 1.32** 1.92*** 0.89 1.27 French, Other , Children 1.14 0.32* 0.43*** 1.21* 0.46* 0.68*** 0.25*** 0.41* 0.38*** 0.78 0.95 0.32 French, Quebec, None 7.46** 10.65* 1.97 3.69*** 1 (ref.) 4.53*** 4.81*** 3.86* 4.59*** 6.27*** 0.56 6.37 French, Quebec, Children 5.37 6.564 0.26 1.09 0.76*** 1.62** 0.45 2.33 2.42* 2.16* 10.79* (empty) First nation 1.88*** 3.981*** 1.44*** 1.85*** 1.66*** 2.60*** 2.65*** 3.58*** 3.35*** 3.08*** 2.89*** 3.33*** N 14,888 3457 23,780 20,230 199,752 328,189 34,622 30,020 99,111 109,875 1916 3736 Sour ce : Authors’
elaboration based on the 2006 Canadian census data, 20
% sample Note: See T able 3.1
for the meaning of the abbre
viations * p < 0.05; ** p < 0.01; *** p < 0.001
83
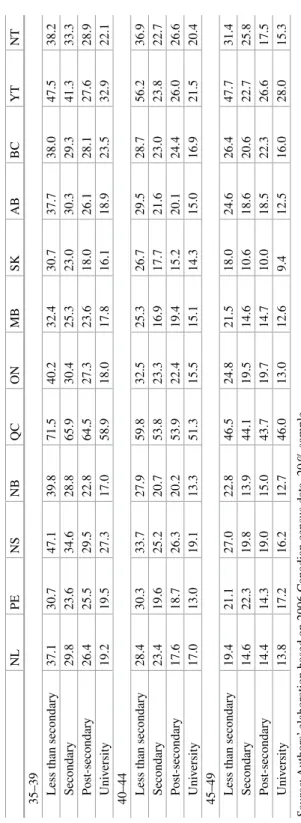
T
able
3.3
Predicted probabilities of li
ving in a consensual union among w
omen aged 15–49 in marital union (estimated from the logistic
re gression model specifi ed in T able 3.2 ), Canadian pro
vinces and territories in 2006
NL PE NS NB QC ON MB SK AB BC YT NT
Age and education 15–19
Less than secondary 85.5 72.6 93.9 92.8 92.7 90.7 88.2 94.4 92.6 91.8 88.9 72.0 Secondary 85.8 85.9 97.2 86.8 93.7 84.6 85.9 93.1 91.6 88.7 79.1 97.1 Post- secondary 72.1 88.6 60.0 59.5 87.6 68.1 79.3 78.1 79.0 76.4 49.7 Uni v ersity 90.8 49.4 30.3 40.9 40.6 20–24 Less than secondary 87.1 97.7 92.7 91.2 93.7 84.1 78.2 84.2 84.0 84.6 88.3 86.6 Secondary 88.9 81.9 87.3 85.3 92.7 79.9 77.1 81.5 82.5 78.3 78.9 85.4 Post- secondary 86.5 81.0 86.7 78.6 93.1 76.7 69.0 70.0 76.7 77.0 68.3 79.5 Uni v ersity 79.0 86.2 84.1 77.7 91.0 70.0 63.1 71.9 70.7 73.7 57.3 63.1 25–29 Less than secondary 68.5 72.2 73.6 69.3 87.2 67.9 63.5 57.1 70.1 66.1 76.0 60.7 Secondary 68.8 56.5 71.9 60.2 84.4 59.8 56.5 50.7 58.4 59.9 68.5 62.3 Post- secondary 60.7 40.3 63.8 53.7 85.9 55.5 50.7 44.4 53.9 57.5 74.4 65.2 Uni v ersity 56.1 50.8 61.6 48.1 81.1 45.9 43.2 35.5 45.3 49.2 63.8 52.3 30–34 Less than secondary 49.9 58.6 55.1 53.1 80.4 50.7 37.9 42.3 48.8 46.9 46.7 59.6 Secondary 41.2 41.5 49.1 44.9 75.0 42.7 38.5 35.8 40.1 40.9 50.0 37.6 Post- secondary 41.4 37.5 38.9 34.5 75.6 38.4 32.7 25.1 37.3 40.4 36.5 39.8 Uni v ersity 31.0 25.9 35.1 29.3 67.6 26.2 26.9 22.2 27.2 34.6 33.1 33.3 (continued)
T able 3.3 (continued) NL PE NS NB QC ON MB SK AB BC YT NT 35–39 Less than secondary 37.1 30.7 47.1 39.8 71.5 40.2 32.4 30.7 37.7 38.0 47.5 38.2 Secondary 29.8 23.6 34.6 28.8 65.9 30.4 25.3 23.0 30.3 29.3 41.3 33.3 Post- secondary 26.4 25.5 29.5 22.8 64.5 27.3 23.6 18.0 26.1 28.1 27.6 28.9 Uni v ersity 19.2 19.5 27.3 17.0 58.9 18.0 17.8 16.1 18.9 23.5 32.9 22.1 40–44 Less than secondary 28.4 30.3 33.7 27.9 59.8 32.5 25.3 26.7 29.5 28.7 56.2 36.9 Secondary 23.4 19.6 25.2 20.7 53.8 23.3 16.9 17.7 21.6 23.0 23.8 22.7 Post- secondary 17.6 18.7 26.3 20.2 53.9 22.4 19.4 15.2 20.1 24.4 26.0 26.6 Uni v ersity 17.0 13.0 19.1 13.3 51.3 15.5 15.1 14.3 15.0 16.9 21.5 20.4 45–49 Less than secondary 19.4 21.1 27.0 22.8 46.5 24.8 21.5 18.0 24.6 26.4 47.7 31.4 Secondary 14.6 22.3 19.8 13.9 44.1 19.5 14.6 10.6 18.6 20.6 22.7 25.8 Post- secondary 14.4 14.3 19.0 15.0 43.7 19.7 14.7 10.0 18.5 22.3 26.6 17.5 Uni v ersity 13.8 17.2 16.2 12.7 46.0 13.0 12.6 9.4 12.5 16.0 28.0 15.3 Sour ce : Authors’
elaboration based on 2006 Canadian census data, 20
% sample Note : See T able 3.1
for the meaning of the abbre
85
T
able
3.4
Estimated odds ratios from a logistic re
gression model of li
ving in consensual union among w
omen and men aged 20–49 in marit
al union by age,
social and economic characteristics, Canadian selected pro
vinces in 2012 W omen Men QC ON AB BC QC ON AB BC
Age and education 20–24
Less than secondary 27.78*** 5.41*** 6.07*** 7.91*** 75.81*** 5.16*** 2.18 6.571* Secondary 11.05*** 2.71*** 3.95*** 2.80** 26.54*** 4.49*** 2.22* 2.846* Post-secondary 19.47*** 2.72*** 2.09* 6.80*** 10.69*** 1.90* 1.10 1.048* Uni v ersity 6.66*** 1.60 0.98 0.98 (empty) 2.68 0.82 1.226 25–29 Less than secondary 13.31*** 2.37** 2.96** 3.79* 8.45*** 4.31*** 1.43 5.01*** Secondary 10.25*** 1.57* 1.05 1.83* 5.88*** 1.63* 0.96 1.59 Post-secondary 11.69*** 1.25 0.92 1.56 10.11*** 1.38 0.96 1.25 Uni v ersity 4.61*** 0.94 0.51** 0.88 3.03*** 0.81 0.40* 0.95 30–34 Less than secondary 4.70*** 1.00 0.83 2.71* 11.43*** 1.99* 1.22 1.03 Secondary 6.50*** 0.90 0.55* 0.95 6.89*** 1.01 0.61 0.57 Post-secondary 6.56*** 0.63** 0.57* 0.86 6.20*** 0.49*** 0.49** 0.74 Uni v ersity 3.63*** 0.41*** 0.35*** 0.35*** 2.69*** 0.56** 0.20*** 0.24*** 35–39 Less than secondary 6.41*** 1.18 0.48 1.58 3.94*** 0.65 0.46 0.675 Secondary 5.97*** 0.94 0.86 0.70 3.80*** 0.62* 0.70 0.70 Post-secondary 4.66*** 0.50*** 0.47** 0.46** 6.31*** 0.62** 0.32*** 0.49* Uni v ersity 3.19*** 0.21*** 0.16*** 0.31*** 1.61*** 0.33*** 0.13*** 0.36** (continued)
W omen Men QC ON AB BC QC ON AB BC 40–44 Less than secondary 6.52*** 0.58 0.88 1.09** 2.90*** 1.27 0.37** 0.80 Secondary 3.69*** 0.56** 0.33*** 0.55* 3.28*** 0.67 0.47* 0.40** Post-secondary 3.25*** 0.34*** 0.45** 0.49*** 2.21*** 0.50*** 0.39*** 0.48** Uni v ersity 3.19*** 0.21*** 0.20*** 0.31*** 2.20*** 0.25*** 0.12*** 0.34*** 45–49 Less than secondary 4.07*** 0.37*** 0.62 0.13*** 3.63*** 0.73 0.57 0.58 Secondary 3.57*** 0.44*** 0.21*** 0.36*** 2.92*** 0.32*** 0.31*** 0.33*** Post-secondary 2.91*** 0.39*** 0.32*** 0.26*** 2.49*** 0.36*** 0.30*** 0.32*** Uni v ersity 2.28*** 0.35*** 0.23*** 0.20*** 1.62*** 0.27*** 0.10*** 0.18***
Economic risk: emplo
yment status Public sector (ref.) 1 1 1 1 1 1 1 1 Pri v ate sector 0.71*** 0.98 0.86 0.98 1.13 1.11 1.29 1.38 Self-emplo yed 0.56*** 1.04 0.71 1.09 0.89 0.81 0.85 0.88 Out of the labour force 0.30*** 0.91 0.52*** 0.47*** 0.62 1.49 0.30* 2.19* Other 0.25*** 0.78 1.22 0.99 0.67 1.94 0.48 3.09* T able 3.4 (continued)
87 W omen Men QC ON AB BC QC ON AB BC
Age of the youngest o
wn child in the household
None less than 25 (ref.) 1 1 1 1 1 1 1 1 Less than 3 0.72** 0.29*** 0.43*** 0.24*** 0.61*** 0.27*** 0.41*** 0.23*** Between 3 and 5 0.57*** 0.30*** 0.34*** 0.27*** 0.50*** 0.23*** 0.27*** 0.23*** Between 6 and 12 0.50*** 0.32*** 0.53*** 0.38*** 0.45*** 0.23*** 0.40*** 0.30*** Between 13 and 15 0.32*** 0.35*** 0.31*** 0.31*** 0.26*** 0.32*** 0.25*** 0.21*** Between 16 and 17 0.32*** 0.43*** 0.58 0.27*** 0.34*** 0.44*** 0.49 0.26** Between 18 and 24 0.33*** 0.24*** 0.42** 0.60 0.33*** 0.30*** 0.51 0.55
Census metropolitan area None
(ref.) 1 1 1 1 1 1 Montreal 0.39*** 0.40*** T oronto 0.42*** 0.48*** V ancouv er 0.53*** 0.57*** N 5175 8835 3573 3640 4546 7746 3239 3089 Sour ce : Authors’
elaboration based on the Statistics Canada’
s 2012 Labour F
orce Surv
ey Public Use Microdata File
Note:
See
T
able
3.1
for the meaning of the abbre
viations * p < 0.05; ** p < 0.01; *** p < 0.001
reference categories are written besides the name of the variable, between brackets. The reference category for the measure of economic independence is the highest level, “Being the main support and Being in the labour force”. The reference cate-gory for the combination of speaking French, having lived in Quebec and having children has been chosen to allow easy contextual interpretation: it is referring to a majority group within each province. Thus it is speaking French, having lived in Quebec and not having children in Quebec, but not speaking French, not having lived in Quebec and not having children in all other provinces and territories.
7.2
The Level of Economic Security
In this analysis, we use data from the 2012 Labour Force Survey (LFS) public use microdata fi le. This survey is used primarily to estimate the unemployment rate, but includes information on marital union and is the only source of data that includes a variable that allows differentiating employment in the public and the private sectors. The LFS uses rotating panels; we use the January and July samples to avoid using twice the same individuals. As explained in the previous section, we use informa-tion on job sector as a gradient of economic security. Thus, we model the probability of living in a consensual union rather than being married among Canadian men and women living in a marital union aged 20–49 as a function of the level of economic security measured through employment status, controlling for age, education and other relevant variables available in the survey: age of the youngest own child in the household and census metropolitan area. The LFS does not provide information on language. We use living or not in the main census metropolitan area (CMA) of the province as a proxy for language: in Quebec, the proportion of French-speaking people is lower in the Montreal CMA than elsewhere the province. We thus expect living in a CMA to decrease the probability of living in a consensual union in Quebec and to have no signifi cant effect in the other provinces. We estimate sepa-rate equations for men and women and, given the number of equations, we limit the analysis to the four most populous provinces. We estimate the equations using logis-tic regression.
7.3
Values
We use data from waves 4 and 5 of the Word Values Survey (World Values Survey Association 2005 ), the only waves of this survey conducted in Canada. We measure the importance given to the autonomy of the individual using the Inglehart auton-omy index (Inglehart 1997 ). We model the probability of living in a consensual union rather than being married among men and women aged 15–49 living in a marital union as a function of the importance they give to individual autonomy, controlling for age, education and the presence of children. The data allow
89
estimating the effect of the economic role of the respondent in the same fashion as we do in our fi rst analysis. Because of the limited size of the sample, we cannot estimate separate equations for each province. Instead, we estimate separate equa-tions for French Quebec and English Canada. For the same reason, we cannot esti-mate separate equations for men and women. However, we estiesti-mate the effect of the autonomy index and of our proxy of the level of economic independence separately for men and women.
8
Results
8.1 The Economic Role of the Woman in the Couple
Although this analysis focuses on economic independence, the main sources of variation in the probability of living in a consensual union are age and education and we describe their effect fi rst (see Table 3.2 ). Not surprisingly, the base odds of living in a consensual union rather than being married are higher than 1 for all levels of education among Quebec women up to and including ages 40–44. The coeffi cient associated with women aged 15–19 and completed university education is less than 1 but not signifi cant, which does not come as a surprise since having completed even a one-year university diploma before age 20 is nearly impossible and the cat-egory is almost empty. Despite the odds being higher than 1 in all, but one age class, there is an education gradient within each age class. The base odds decrease with age within each education level.
In Ontario, the base odds are greater than 1 for all education levels in the two youngest groups, and for all education levels but university in the 25–29 group. The base odds are less than 1 for all education levels within older groups with the exception of the “Less than secondary group” among the 30–34. As in Quebec, there is an education gradient within age classes and the base odds decrease with age within each education level. The overall pattern is about the same as in Ontario in all other provinces, although a case could be made that the base odds are consis-tently higher up to and including age group 25–29 in the Atlantic provinces (Newfoundland and Labrador, Prince Edward Island, Nova Scotia and New Brunswick) than west of Quebec. Table 3.3 reports the coeffi cients from the combi-nation of age and education transformed into easier-to-read predicted probabilities. The coeffi cients associated with the levels of economic independence are ordered according to the hypothesis and signifi cant in Quebec and British Columbia. In Ontario and Alberta, the coeffi cients are ordered according to the hypothesis, but without a signifi cant difference between the two highest levels. In the remaining provinces, the coeffi cients are not ordered as expected. In New Brunswick and Saskatchewan, being the main support and out of the labour force is associated with a higher probability of living in a consensual union than being the main support and being in the labour force. In Newfoundland and Labrador, Prince Edward Island,
Nova Scotia and Manitoba, the coeffi cients point in the same direction, but are not signifi cant. There is no sizeable difference between the coeffi cients associated with the two lowest categories in Nova Scotia, New Brunswick, Manitoba, and Saskatchewan.
In Quebec, childless French-speaking women from Quebec have the highest odds of living in a consensual union; for these women, having children reduces the odds of cohabitation by about 25 %. The odds are about the same for childless French-speaking women from elsewhere; for these women, having children reduces the odds by about 50 %. The odds of living in a consensual union for childless non- French- speaking women from outside Quebec are about a third of those of childless French-speaking women from Quebec; for these women, having children reduces the odds by about 75 %. The odds for childless non-French-speaking women from Quebec are less than 20 % of those of childless French-speaking women from Quebec; for these women, having children reduces the odds by about 60 %. French- speaking women from Quebec have the highest odds of living in a consensual union and, among them, having children reduces these odds by only 25 %. All other women are less likely to live in a consensual union and; for these women, having children reduces the odds by a much larger proportion.
In Ontario, for non-French-speaking women from somewhere else than Quebec, having children reduces the odds of living in a consensual union by about 60 %. Childless French-speaking women from Quebec have the highest odds, more than four times those of non-French-speaking women from elsewhere; for these women, having children reduces the odds by about 66 %, much more than in Quebec. Childless non-French-speaking women from Quebec and childless French-speaking women from elsewhere have about the same odds of living in a consensual union, roughly 60 % higher than those of non-French-speaking women from somewhere else than Quebec; having children reduces the odds by about 75 % in the fi rst group and by about 60 % in the second group. For French-speaking women from Quebec, having children has a stronger effect in reducing the odds of consensual union in Ontario than in Quebec. Speaking French or coming from Quebec increases the odds for childless women. In all groups, having children reduces them from 60 to 75 %.
Given the small number of French-speaking women and of women coming from Quebec in most provinces outside Quebec, many coeffi cients are not statistically signifi cant despite their magnitude. In Alberta and British Columbia, where num-bers are larger, the structure of the ratios between the coeffi cients is the same as in Ontario.
In all provinces and territories, belonging to a First nation increases the odds of cohabiting. Interestingly, this effect is smaller in Quebec, where the reference group is childless French-speaking women from Quebec, than in any other province and even than the two territories, where the proportion of the population belonging to a First nation is the highest.