Deep genealogical analysis of a large cohort of participants in the CARTaGENE project (Quebec, Canada)
Marc Tremblay
Université du Québec à Chicoutimi marc.tremblay@uqac.ca
Gabrielle Rouleau
Université du Québec à Chicoutimi gabrielle.rouleau@uqac.ca
Corresponding author: Marc Tremblay
Département des sciences humaines et sociales Université du Québec à Chicoutimi
555, boul. de l’Université Chicoutimi (Québec) Canada G7H 2B1
Tel. : 418-545-5011, ext. 6554 e-mail: marc.tremblay@uqac.ca
Abstract
Background: Genealogical analysis helps to better understand the genetic structure of populations. The population of Quebec (Canada) often serves as a model for this type of analysis, having one of the world’s most complete genealogical database.
Aim: The main objective of this study was to reconstruct, analyse and compare the ascending genealogies of participants to CARTaGENE, a project that aims at building a database on various aspects of public health.
Subjects and methods: 5110 genealogies from four Quebec regions were reconstructed. Distribution of ancestors, completeness and depth of the genealogies, characteristics of immigrant ancestors, and kinship and inbreeding coefficients were analysed.
Results: Most genealogies go back to the 17th century, with a mean genealogical depth of 10 generations. Origins of immigrant ancestors are more diverse in the Montreal region, resulting in lower inbreeding and kinship among the participants from this region. The greater part of inbreeding and kinship values are due to remote links (6 to 11 generations).
Conclusion: Deep genealogies allowed for a precise measurement of the geographic origins of the participants’ immigrant ancestors as well as inbreeding and kinship ties in the population, which may be crucial for studies aiming to identify genetic variations associated with Mendelian or complex diseases.
Introduction
The CARTaGENE project was launched in 2009. The objective of this project is the creation of a large database on the Quebec (Canada) population, covering various aspects of public health (Awadalla et al., 2013; CARTaGENE, 2016). CARTaGENE is part of the P3G consortium (Public Population Project in Genomics and Society), an international organization that aims to provide the scientific community with access to the most current information in all areas of population genomics (Knoppers et al., 2013; P3G, 2016). The first phase of the CARTaGENE project involved an extensive survey carried out with 20,000 men and women aged between 40 and 69 years. Participants were randomly recruited in four regions of the province of Quebec: Montreal, Sherbrooke, Quebec and Saguenay. Biological samples were collected and stored at the Genome Quebec Biobank (Genome Quebec, 2016). Detailed questionnaires were also filled by the participants, providing data on several hundreds of variables (Awadalla et al., 2013). The survey contained questions about socio-demographic characteristics, mental and physical health and diseases, lifestyle, eating and drinking habits, and the participants’ environment (such as residential and occupational history).
Participants in the survey were also invited to provide basic information about their biological family (names, places and dates of marriage of their parents and grand-parents), for genealogical purposes. Approximately 25% of participants agreed to take part in this genealogical survey, adding a unique dimension to the CARTaGENE project. Indeed, genealogies have proven to be a useful tool to better understand the genetic structure of a population (Newman et al., 2001; Abney, 2008; Colonna et al., 2009; Bherer et al., 2011; Roy-Gagnon et al., 2011; Larmuseau et al., 2013; Rojas et al., 2013; Zaitlen et al., 2013; Gauvin et al., 2014). Considering that the CARTaGENE participants came from four
distinct geographical regions of the province of Quebec, a detailed analysis of their genealogical characteristics may bring new insights about the specificities of each regional population.
The main objective of this study was thus to reconstruct, analyse and compare the ascending genealogies of the CARTaGENE participants. Various methods were applied using a specialized genealogical software, and comparisons were made between the four regional populations. In addition to providing a clear differentiation between each population, results presented here show the importance and benefits of the information that can be revealed by deep and reliable pedigrees.
The Quebec population
Quebec is the largest province of Canada. Its territory covers approximately 1.5 million square kilometers (more than 6 times the area of Great Britain), but most of its population of 8.2 million lives in the southern part of the province, along the St Lawrence River. Montreal and Quebec City, two of the four regions investigated in this study, are the largest urban centers of the province. The Sherbrooke region lies on the south shore of the St Lawrence River, between Montreal and Quebec City, while the Saguenay region is located further north and east, near the Saguenay River.
The first European settlers in Quebec arrived from France in the early 17th century (Charbonneau et al., 1993). It is estimated that some 30 000 people were living in the whole Quebec territory at that time (Charbonneau, 1984). Out-migration, war and high mortality due to infectious diseases brought by Europeans quickly reduced the native population to less than 20 000 by the end of the 17th century
(Charbonneau, 1984). Meanwhile, colonization efforts by the French authorities, which were rather ineffective during the first decades of the French Regime, started to improve significantly in the 1660’s, with the arrival of the Filles du Roi (Landry, 1992). High fertility, combined with a relatively
low mortality for the period, resulted in a strong and steady increase of the French-Canadian population which amounted to nearly 75 000 people at the end of the French Regime in the early 1760’s (Charbonneau et al., 2000). The takeover by British authorities saw the arrival of new immigrants from the British colonies (Loyalists fleeing the American Revolution), Great Britain and Ireland during the 19th century (McInnis, 2000a). During the 20th century, immigrants came to Quebec from various parts
of Europe (Kerr & Beaujot, 2016). The last decades of the 20th century were characterized by a rapid diversification of the immigration movement, with arrivals from South-East Asia, North Africa and South America (Piché, 2003).
For most of its history, the French Canadian population of Quebec maintained vigorous fertility levels, with a total fertility rate of more than 6 children per woman until the first decades of the 20th century (Henripin & Perron, 1972). This, along with the fact that French-Canadians succeeded in keeping their Catholic faith and French language after the British conquest, explains their high proportion (nearly 80%) in the contemporary Quebec population (Statistics Canada, 2012).
Data and methods
Description of the CARTaGENE participants
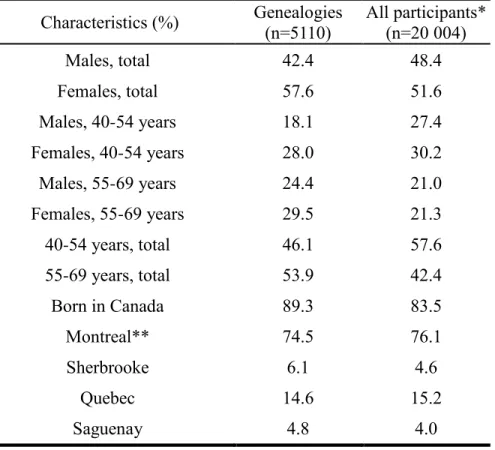
A total of 5110 CARTaGENE participants agreed to provide basic information to allow for the reconstruction of their genealogies. They represent 25.5% of all participants in the first phase of the CARTaGENE project. Table 1 compares some demographic characteristics between the two groups. Results show higher proportions of females and 55-69 years (for both sexes) for participants in this study (genealogies) than among all participants. This suggests that female and older participants may
be more inclined to give information about their families than the male and younger participants. Results also show that the genealogies contain proportionally more participants who were born in Canada. One may assume that immigrants were less motivated to send their data to BALSAC since the register does not contain genealogical material for people born outside of Quebec. The geographical distributions of participants are quite similar in the two groups, with a slight over-representation of Sherbrooke and Saguenay participants among the genealogies.
[Table 1 here]
The BALSAC population register
Data from the BALSAC population register (BALSAC, 2016) was used to reconstruct the genealogies of the participants. This database contains nominative data on the Quebec population going back to the beginning of the 17th century (Jomphe, 2012). Such data allows for the reconstruction of individual and family demographic histories, ascending genealogies and descending genealogies. The main sources of the BALSAC register are baptism, marriage and burial records from the Catholic Church. These records have been very well preserved in Quebec since the beginning of the French Regime (Charbonneau et al., 2000). As of now, the register contains approximately three million records covering five million individuals. The register is still expanding and will include data from the 19th century and the early 20th century Canadian censuses (BALSAC, 2016).
Genealogies
A total of 5110 ascending genealogies were reconstructed for this project. Genealogical branches go back as far as the first immigrants who came to Québec. Dates and places of marriage are known for
nearly all ancestors identified in the genealogies. The geographical origins of most immigrant ancestors are also known. The origin corresponds to the immigrant’s place of birth or last place of residence before emigration.
The structure of the genealogical data allows for the identification of common ancestors among the participants. This is crucial for the calculation and comparison of demogenetic measures such as kinship coefficients in the population.
Genealogical analysis
For each region, the following variables were analysed: number and occurrences of ancestors identified in the genealogies; completeness and depth of the ascending genealogies; number, distribution and characteristics (sex, origin and year of marriage) of the immigrant ancestors; kinship and inbreeding coefficients.
The genealogical completeness was calculated as follows:
where g is the generation level (the generation of subjects’ parents is equal to 1), Ag is the number of known ancestors at generation g and N is the number of genealogies. This measure shows the proportion of known ancestors at each generation (at generation g, each person has 2g ancestors).
Summing completeness over all generations gives the mean genealogical depth, which corresponds to the average length of the genealogical branches (Cazes & Cazes, 1996). As such, the completeness represents a good indicator of the richness of the genealogies.
)
2
/(
g g gA
N
C
Kinship and inbreeding coefficients were calculated as follows:
where S is the subject, PS is the subject’s father, MS is the subject’s mother, N is the number of
genealogical paths between PS and MS, Ib is the number of individuals in each path and Ab is the
common ancestor to PS and MS in each path. The inbreeding coefficient of a given subject (FS)
corresponds to the kinship coefficient of his or her parents (Φ(PS,MS)).
These measures take into account all known ancestors common to two individuals and all genealogical paths linking these individuals (Hartl & Clark, 2007). In most studies, inbreeding or kinship measures are limited to a few generations of ancestors (providing links between first or second cousins), due to lack of data. In this study, inbreeding and kinship coefficients were calculated at each generation level, from the first to the thirteenth generation of ancestors. This allows for a better understanding of the kinship structure in the population, especially regarding the presence and impact of distant kinship links (four generations and higher). In total, more than 66 thousand inbreeding coefficients were computed (one coefficient per participant, at each generation). The total number of kinship coefficients is much higher (nearly 99 million) because these coefficients were calculated for each pair of participants in each region. In both cases, the mean value of the coefficients and the proportion of participants (or pair of participants in the case of kinship) with a coefficient value larger than 0 were calculated. Statistical tests included in the GENLIB software (BALSAC, 2016; Gauvin et al., 2015) were used to compare kinship and inbreeding coefficients between the four regions. A permutation test was used to compare mean kinship coefficients between each pair of regions at each generation level, as described in Lavoie et al. (2005) (p-values were obtained by performing 5000 permutations). A
F
M
P
F
N b Ab I s S S
b
1)
1
(
)
2
/
1
(
)
,
(
Wilcoxon rank-sum test was used to compare mean inbreeding coefficients between each pair of regions at each generation level.
Ethical statement
This project was approved by the CARTaGENE (Centre hospitalier universitaire Sainte-Justine) and BALSAC (Université du Québec à Chicoutimi) ethics committees.
Results
Characteristics and completeness of the genealogies
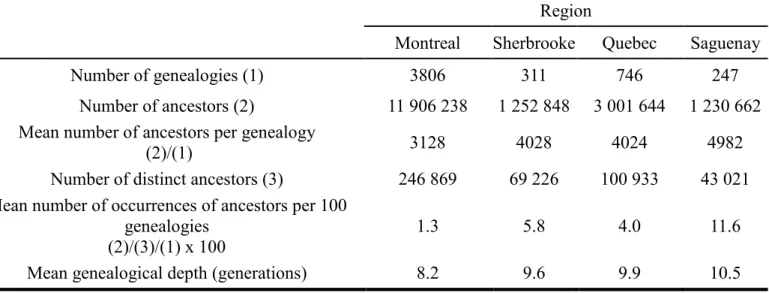
Table 2 shows the characteristics of the genealogies of the four Quebec regions. The largest group (3806 participants) comes from the Montreal region, the most populated region of the province of Quebec. Nearly 12 million ancestors were identified in the Montreal genealogies. On average though, more ancestors per genealogy were found in the Saguenay region, resulting in a higher mean genealogical depth (10.5 generations, compared with 8.2 generations for Montreal).
[Table 2 here]
Many ancestors appear more than once in the genealogies, as the numbers of distinct ancestors clearly show. Again, the Saguenay region has the highest mean number of ancestors’ occurrences per genealogy (11.6), indicating a higher homogeneity in the population of this region.
The completeness of the genealogies is fairly high (Figure 1). For Montreal, at least 70% of the ancestors are known up to the 8th generation. Completeness is even higher for the other three regions,
where between 80% and 90% of the ancestors were identified at the 9th generation. After the 10th generation, completeness drops rapidly as most genealogical branches reach the immigrant ancestors.
[Figure 1 here]
Immigrant ancestors
A total of 14 184 immigrant ancestors were identified in the genealogies, but some of these immigrants appear in the genealogies of more than one region. Figure 2 shows the relative distribution of the immigrant ancestors according to the regions in which they appear. About half the immigrants are found in the genealogies of only one of the four regions, whereas a little more than 25% appear at least once in the genealogies of each of the four regions; 11% are found in three regions and 12% in two regions. Nearly 93% of all immigrant ancestors were found in the genealogies of the Montreal region.
[Figure 2 here]
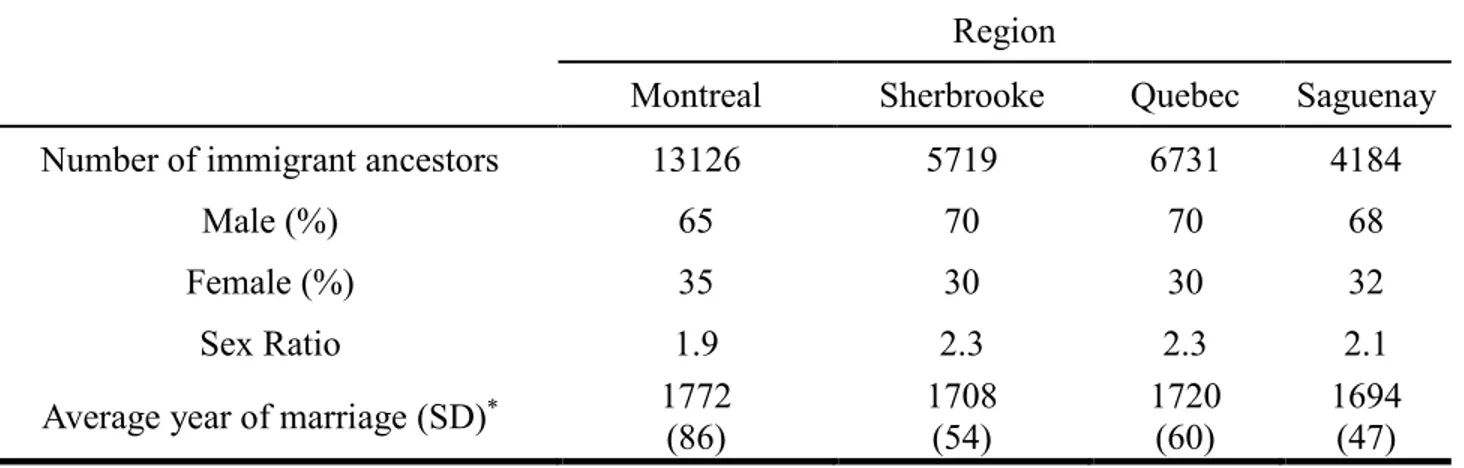
More than two thirds of the immigrant ancestors are men (Table 3). This is in accordance with the history of immigration in Quebec: in the early stages of the colony, most immigrants were young men who were hired for the fur trade, as laborers or in the military (Charbonneau et al., 1993). The proportion of female immigrants is a little higher for Montreal where most of the later immigrants were settled. On average, results show that the marriage of immigrant ancestors in the Montreal genealogies (1772) comes later than that of the other regions (1720 or before).
[Table 3 here]
As expected, a majority of immigrant ancestors came from France (Figure 3). The proportion of French ancestors ranges from 56% for the Montreal region to 84% for the Saguenay. The second most frequent contingent came from other parts of Canada; these Canadian immigrants came mainly from the former Acadian region (which was located in the present provinces of New-Brunswick and Nova Scotia) from which most of the inhabitants of French origin were expelled by British soldiers in 1755 (Bergeron et al., 2008). Around 11% of immigrant ancestors in the Montreal region came from Great-Britain or Ireland, by far the largest proportion among the four regions. This is also in accordance with the history of the regional settlement of the Quebec population (Tremblay et al., 2009; Campey, 2012). Montreal genealogies have also the highest proportion of immigrant ancestors from « other » origins (mainly Italy and the U.S.A.), depicting a greater diversity in this population.
[Figure 3 here]
Inbreeding and kinship
This greater diversity for Montreal is reflected in the values of the participants’ inbreeding coefficients, calculated up to each generation from the third to the thirteenth (Figure 4). For almost all generation levels, mean inbreeding is lower in Montreal than in the other regions; differences between Montreal and the other regions, except Sherbrooke, are all significant (p<0.01) at generation 8 or higher. The highest values are those observed in the Saguenay population (up to 0.0070 at the 13th generation), but
only at a depth of 8 generations or higher. Up to the 6th generation, inbreeding is lower among Saguenay participants than among those from Québec and Sherbrooke, although the differences are not statistically significant (p>0.01). In all regions, inbreeding coefficients tend to level off after the 11th
generation; this is due to the decrease in the amount of genealogical information available at these generation levels.
[Figure 4 here]
Figure 5 shows the proportions of participants with non-zero inbreeding coefficients, calculated up to each generation from the third to the thirteenth. Up to the 5th generation, all proportions are lower than
10%. After the 6th generation, the proportions rise rapidly. At the 11th generation, almost all Saguenay participants (98%) are inbred. The lowest value is that of Montreal, with still a relatively high enough proportion of 74% at the 11th generation.
[Figure 5 here]
Mean kinship coefficients of participants, as in the case of inbreeding coefficients, are relatively small at a depth of 5 generations or lower (Figure 6). In fact, the coefficients remain very low (less than 0.0003) up to the 8th or 9th generations for Montreal, Québec and Sherbrooke. Here the difference with the Saguenay region is striking: from the 6th to the 13th generation, mean kinship values are at least 6
times higher in Saguenay than in the other regions (p<0.001).
[Figure 6 here]
Despite the relatively low mean kinship values for the participants from Montreal, Québec and Sherbrooke, Figure 7 shows that the proportion of pairs of participants in these regions who have at least one common ancestor grows rapidly after the 7th generation, reaching 62% in Montreal, 86% in Sherbrooke and 90% in Québec at a depth of 9 generations. Here again, the Saguenay region stands
out, with a proportion of 75% already at the 7th generation. At a depth of 10 generations, 99% of Saguenay participants are related to one another.
[Figure 7 here]
Discussion
This analysis of the genealogies of participants to the CARTaGENE project provided relevant information about the structure of the Quebec population. Some significant differences were observed between the four regions investigated.
The analysis of the numbers, distribution and origins of ancestors identified in the genealogies, as well as inbreeding and kinship coefficients, showed a greater genetic homogeneity in the Saguenay region. This region is part of the broader Saguenay-Lac-St-Jean region, which has long been the subject of investigations due to the presence of some rare hereditary diseases at an elevated frequency (Heyer et al., 1997; Scriver, 2001; Laberge et al., 2005; Tremblay et al., 2014). The frequency and distribution of such diseases in this region are explained not by close inbreeding among the Saguenay-Lac-St-Jean population, but rather by remote kinship ties caused by founder effects (Bouchard & De Braekeleer 1992; Heyer, 1999). The impact of founder effects depends on factors such as the number and origins of the first immigrants, the time elapsed since their arrival, marital and reproductive behavior of their descendants and subsequent migrations within the population (Heyer, 1995).
Remote kinship ties have clearly been observed in this study, not only in the Saguenay population but also in the other regional populations of Quebec. Thanks to a high genealogical completeness,
measurement of inbreeding and kinship coefficients were made with great precision up to a depth of at least ten generations. Results showed that the values of theses coefficients are very sensitive to the generation level at which they are measured. In all regions, the greater part of all kinship links occur at depths between 6 and 11 generations. Thus, the cumulative values of kinship and inbreeding coefficients are mainly due to remote links, rather than close links (which would not have been revealed without a high genealogical depth). In this regard, results showed that close inbreeding (< 6 generations) was in fact not higher in the Saguenay population than in the Quebec or Sherbrooke regions.
The lower inbreeding and kinship values for the Montreal population can be associated with a greater diversity of immigrant ancestors identified in the genealogies. Since the end of the 19th century, when the origins of international immigrants to Canada started to diversify, the vast majority of immigrants who settled in Quebec did so in the Montreal region (McInnis, 2000b). As a result, the proportion of immigrant ancestors from “other” origins is much higher in the Montreal genealogies. These immigrants also arrived more recently than most French and British immigrants, hence the later average year of marriage of immigrant ancestors identified in the Montreal genealogies. This explains the fact that the proportion of non-zero kinship coefficients is much lower among the Montreal participants than among those from the other three regions.
Results for the Quebec and Sherbrooke populations lie between those of Saguenay and Montreal. This can also be explained by migration movements that occurred in these regions. Contrary to the Saguenay and somewhat like Montreal, the Quebec and Sherbrooke regions saw the arrival of many British and Irish immigrants during the 19th century (Houston & Smyth, 1990; Campey, 2006; Campey, 2012). However, descendants of these immigrants gradually left their original settlements and many went to Montreal, Ontario or the United States; meanwhile, they were replaced by French Canadians coming
from rural parts of the province (Prattis, 1980; Campey, 2006; Campey, 2012). As a result, the contemporary populations of Quebec and Sherbrooke have stronger French roots than the population of Montreal, which is reflected by the inbreeding and kinship values among the participants from these two regions and in the distribution of immigrants ancestors identified in their genealogies.
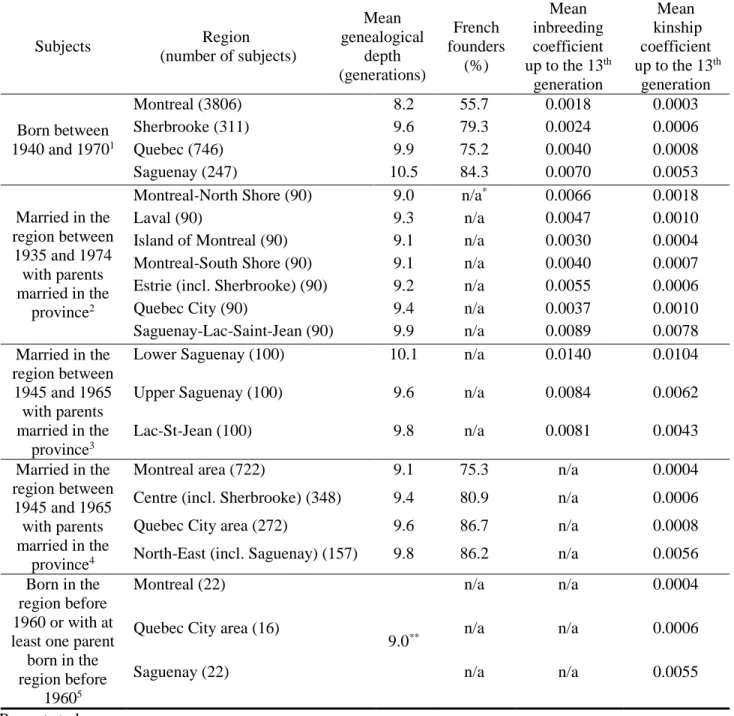
Table 4 compares some of the findings of the present study with those obtained in previous studies on the population of Quebec. Results show some differences from one study to another, which can be explained in part by differences between demographic characteristics of the populations under study. For example, the mean genealogical depth for the Montreal region is lower in the present study (8.2 generations) than in previous studies (9.0 and 9.1 generations). This may be explained by the fact that recent immigrants, who are in much greater numbers in Montreal than anywhere else in the province of Quebec, were systematically excluded from the samples used in the previous studies, thus allowing for a greater completeness of the genealogies because the genealogical branches do not go beyond the Quebec population. In addition to the completeness of the genealogical data, the mean genealogical depth is influenced by the time of birth (or marriage) of the subjects. CARTaGENE subjects were born between 1940 and 1970. They are thus younger, on average, than the subjects of most of the previous studies, which explains the higher genealogical depths of the genealogies from the Sherbrooke, Quebec and Saguenay regions in comparison with the genealogies from the same or similar regions in previous studies. The proportion of French founders is also linked to the proportion of recent immigrants in the regional populations. Since the French founders came mostly during the 17th and 18th century, the presence of recent immigrants and their descendants in the population will tend to reduce the importance of French founders in the genealogies, as is the case in the present study. As for inbreeding and kinship coefficients, results show that the values in the present study are somewhat lower than those in other studies. Again, this is explained by the presence of recent immigrants in the
CARTaGENE sample. As such, this sample is more representative of the contemporary population than the samples used in previous studies.
It is worth nothing that results obtained by Roy-Gagnon et al. (2011) and Gauvin et al. (2014 and 2015), which included genomic material along with genealogical data, showed a good agreement between the two types of data. This concordance could be relevant for researchers who plan to use data from the CARTaGENE project since the present genealogies were constructed with the same resources available at BALSAC. Genealogical data can also provide useful information that cannot be obtained from genomic data, such as details about places and dates of marriage of all ancestors who were married in Quebec (from which migratory and settlement patterns can be measured), geographical origins and genetic contribution of immigrant ancestors (the founders who introduced all genes in the population), and precise levels of kinship and inbreeding by generation (which helps to differentiate close and distant kinship links). Hence, as Roy-Gagnon et al. (2011) also noted, genealogical data is undoubtedly a good complement to genomic data for a better understanding of the genetic structure of a population.
[Table 4 here]
Conclusion
Findings from this study showed that there are important differences between the contemporary population structures of the four Quebec regions investigated, which may be crucial for studies aiming to identify genetic variations associated with Mendelian or complex diseases. Regional differences are due to specific characteristics among the original settlers and subsequent demographic movements occurring in each region. These movements largely determined the evolution of the regional gene pools
in the province of Quebec. The results of this study will be useful to researchers using the CARTaGENE biological samples of these regional populations but also for other researchers interested in the measurement and analysis of genealogical material.
Acknowledgments
The authors wish to thank Jean-Sébastien Bournival and Ève-Marie Lavoie (research professionals at BALSAC) for their technical assistance. We also thank the anonymous reviewer who provided relevant comments that helped to improve this paper.
Declaration of interest
The authors report no conflict of interest. Financial support for this study was provided by the Social Sciences and Humanities Research Council of Canada (grant numbers 435-2012-0749 and 435-2015-0638).
References
Abney M. 2008. Identity-by-descent estimation and mapping of qualitative traits in large, complex pedigrees. Genetics 179:1577–1590.
Awadalla P, Boileau, C, Payette Y, Idaghdour Y, Goulet JP, Knoppers B, Hamet P, Laberge C. 2013. Cohort profile of the CARTaGENE study: Quebec’s population-based biobank for public health and personalized genomics. Int J Epidemiol42:1285–1299.
BALSAC. 2016. BALSAC Population database. Available online at: http://balsac.uqac.ca, accessed 10 October 2016.
Bergeron J, Vézina H, Houde L, Tremblay M. 2008. La contribution des Acadiens au peuplement des régions du Québec. Cah Que Demogr 37:181-204.
Bherer C, Labuda D, Roy-Gagnon MH, Houde L, Tremblay M, Vézina H. 2011. Admixed ancestry and stratification of Quebec regional populations. Am J Phys Anthropol 144:432-441.
Bouchard G, De Braekeleer M. 1992. Pourquoi des maladies héréditaires? Population et génétique au Saguenay-Lac-St-Jean. Septentrion, Sillery.
Campey LH. 2006. Les Écossais. The Pioneer Scots of Lower Canada, 1763-1855. Natural Heritage Books, Toronto.
Campey LH. 2012. Seeking a Better Future. The English Pioneers of Ontario and Quebec. Dundurn, Toronto.
CARTaGENE. 2016. CARTaGENE. Available online at: http://www.cartagene.qc.ca/en, accessed 10 October 2016.
Cazes MH, Cazes P. 1996. Comment mesurer la profondeur généalogique d’une ascendance. Population 51:117-140.
Charbonneau H. 1984. Essai sur l'évolution démographique du Québec de 1534 à 2034. Cah Que Demogr 13:5-21.
Charbonneau H, Desjardins B, Guillemette A, Landry Y, Légaré J, Nault F. 1993. The First French Canadians. Pioneers in the St. Lawrence Valley. University of Delaware Press and Associated University Presses, London.
Charbonneau H, Desjardins B, Légaré J, Denis H. 2000. The population of the St Lawrence Valley, 1608-1760. In: Haines MR, Steckel RH, editors. A Population History of North America. Cambridge: Cambridge University Press, p 99-142.
Colonna V, Nutile T, Ferrucci RR, Fardella G, Aversano M, Barbujani G, Ciullo M. 2009. Comparing population structure as inferred from genealogical versus genetic information. Eur J Hum Genet 17:1635-1641.
Gauvin H, Lefebvre JF, Moreau C, Lavoie ÈM, Labuda D, Vézina H, Roy-Gagnon MH. 2015. GENLIB: an R package for the analysis of genealogical data. BMC Bioinformatics 16:160, doi: 10.1186/s12859-015-0581-5.
Gauvin H, Moreau C, Lefebvre JF, Laprise C, Vézina H, Labuda D, Roy-Gagnon MH. 2014. Genome-wide patterns of identity-by-descent sharing in the French Canadian founder population. Eur J Hum Genet 22:814–821.
Genome Quebec. 2016. Génome Québec and CHAUR Biobank. Available online at: http://www.genomequebec.com/biobank.html, accessed 10 October 2016.
Hartl, DL, Clark AG. 2007. Principles of Population Genetics. Sunderland: Sinauer Associates.
Henripin J, Péron Y. 1972. The demographic transition of the Province of Quebec. In: Glass DV, Revelle R, editors. Population and social change. London: Edward Arnold, p 213–231.
Heyer E. 1995. Genetic consequences of differential demographic behaviour in the Saguenay region, Quebec. Am J Phys Anthropol 98:l-11.
Heyer E. 1999. One founder/one gene hypothesis in a new expanding population: Saguenay (Quebec, Canada). Hum Biol 71:99-109.
Heyer E, Tremblay M, Desjardins B. 1997. Seventeenth-century European origins of hereditary diseases in the Saguenay population (Quebec, Canada). Hum Biol 69:209–225.
Houston CJ, Smyth WJ. 1990. Irish emigration and Canadian settlement: patterns, links, and letters. Toronto: University of Toronto Press.
Jomphe M. 2012. Structure of the BALSAC database and content of the main tables. Document no 1-C-245, Projet BALSAC, Université du Québec à Chicoutimi.
Kerr D, Beaujot R. 2016. Population Change in Canada. Don Mills: Oxford University Press.
Knoppers BM, Deschênes M, Zawati MH, Tassé AM. 2013. Population studies: return of research results and incidental findings Policy Statement. Eur J Hum Genet 21:245–247.
Laberge AM, Michaud J, Richter A, Lemyre E, Lambert M, Brais B, Mitchell GA. 2005. Population history and its impact on medical genetics in Quebec. Clin Genet 68:287–301.
LandryY. 1992. Orphelines en France, pionnières au Canada: Les Filles du roi au XVIIe siècle. Montreal: Leméac.
Larmuseau MHD, Van Geystelen A, van Oven M, Decorte R. 2013. Genetic genealogy comes of age: perspectives on the use of deep-rooted pedigrees in human population genetics. Am J Phys Anthropol 150:505–511.
Lavoie È-M, Tremblay M, Houde L, Vézina H. 2005. Demogenetic study of three populations within a region with strong founder effects. Community Genetics 8-3:152-160.
Letendre M. 2007. Analyse démogénétique de la contribution des fondateurs irlandais au peuplement du Québec et de ses régions. M.Sc. thesis, Université du Québec à Chicoutimi.
McInnis M. 2000a. The population of Canada in the nineteenth century. In: Haines MR, Steckel RH, editors. A Population History of North America. Cambridge: Cambridge University Press, p 371-432.
McInnis M. 2000b. Canada’s population in the twentieth century. In: Haines MR, Steckel RH, editors. A Population History of North America. Cambridge: Cambridge University Press, p 529-599.
Newman DL, Abney M, McPeek MS, Ober C, Cox NJ. 2001. The importance of genealogy in determining genetic associations with complex traits. Am J Hum Genet 69:1146-1148.
P3G. 2016. Public Population Project in Genomics and Society. Available online at: http://P3G.org, accessed 10 October 2016.
Piché V. 2003. Un siècle d’immigration au Québec: de la peur à l’ouverture. In: Piché V, Lebourdais C, editors. La démographie québécoise. Enjeux du XXIe siècle. Montreal: Les Presses de l’Université de Montréal, p 225-263.
Prattis JI. 1980. Ethnic Succession in the Eastern Townships of Quebec. Anthropologica 22:215-234.
Rojas MY, Alonso LA, Sarmiento VA, Eljach LY, Usaquén W. 2013. Structure analysis of the La Guajira-Colombia population: a genetic, demographic and genealogical overview. Ann Hum Biol 40:119–131.
Roy-Gagnon MH, Moreau C, Bherer C, St-Onge P, Sinnet D, Laprise C, Vézina H, Labuda D. 2011. Genomic and genealogical investigation of the French Canadian founder population structure. Hum Genet 129:521-531.
Scriver CR. 2001. Human genetics: lessons from Quebec populations. Annu Rev Genom Hum G 2:69-101.
Statistics Canada. 2012. Linguistic Characteristics of Canadians. Catalogue no. 98-314-X2011001. Ottawa: Minister of Industry.
Tremblay M, Bouhali T, Gaudet D, Brisson D. 2014. Genealogical analysis as a new approach for the investigation of drug intolerance heritability. Eur J Hum Genet 22:916-922.
Tremblay M, Letendre M, Houde L, Vézina H. 2009. The contribution of Irish immigrants to the Quebec (Canada) gene pool: an estimation using data from deep-rooted genealogies. European Journal of Population 25:215-33.
Vézina H, Tremblay M, Houde L. 2004. Mesures de l’apparentement biologique au Saguenay-Lac-Saint-Jean (Québec, Canada) à partir de reconstitutions généalogiques. Annales de démographie historique 2004-2:67-84.
Zaitlen N, Kraft P, Patterson N, Pasaniuc B, Bhatia G, Pollack S, Price AL. 2013. Using Extended Genealogy to Estimate Components of Heritability for 23 Quantitative and Dichotomous Traits. PLoS Genetics 9(5):e1003520.
Table 1. Characteristics of the CARTaGENE participants
* Sources: Awadalla et al. (2013); CARTaGENE (2016).
** In the present study, this region includes the Island of Montreal and its surrounding regions (South shore, North shore and Laval) as described in Awadalla et al. (2013).
Characteristics (%) Genealogies (n=5110) All participants* (n=20 004) Males, total 42.4 48.4 Females, total 57.6 51.6 Males, 40-54 years 18.1 27.4 Females, 40-54 years 28.0 30.2 Males, 55-69 years 24.4 21.0 Females, 55-69 years 29.5 21.3 40-54 years, total 46.1 57.6 55-69 years, total 53.9 42.4 Born in Canada 89.3 83.5 Montreal** 74.5 76.1 Sherbrooke 6.1 4.6 Quebec 14.6 15.2 Saguenay 4.8 4.0
Table 2. Characteristics of the genealogies
Region
Montreal Sherbrooke Quebec Saguenay
Number of genealogies (1) 3806 311 746 247
Number of ancestors (2) 11 906 238 1 252 848 3 001 644 1 230 662 Mean number of ancestors per genealogy
(2)/(1) 3128 4028 4024 4982
Number of distinct ancestors (3) 246 869 69 226 100 933 43 021 Mean number of occurrences of ancestors per 100
genealogies (2)/(3)/(1) x 100
1.3 5.8 4.0 11.6
Table 3. Characteristics of immigrant ancestors
* Based on known dates only (Montreal: n=12 870 (98.0%); Sherbrooke: n=5709 (99.8%); Quebec:
n=6721 (99.9%); Saguenay: n=4184 (100%)).
Region
Montreal Sherbrooke Quebec Saguenay
Number of immigrant ancestors 13126 5719 6731 4184
Male (%) 65 70 70 68
Female (%) 35 30 30 32
Sex Ratio 1.9 2.3 2.3 2.1
Average year of marriage (SD)* 1772
(86) 1708 (54) 1720 (60) 1694 (47)
Table 4. Comparisons with results from previous studies Subjects Region (number of subjects) Mean genealogical depth (generations) French founders (%) Mean inbreeding coefficient up to the 13th generation Mean kinship coefficient up to the 13th generation Born between 1940 and 19701 Montreal (3806) 8.2 55.7 0.0018 0.0003 Sherbrooke (311) 9.6 79.3 0.0024 0.0006 Quebec (746) 9.9 75.2 0.0040 0.0008 Saguenay (247) 10.5 84.3 0.0070 0.0053 Married in the region between 1935 and 1974 with parents married in the province2
Montreal-North Shore (90) 9.0 n/a* 0.0066 0.0018
Laval (90) 9.3 n/a 0.0047 0.0010 Island of Montreal (90) 9.1 n/a 0.0030 0.0004 Montreal-South Shore (90) 9.1 n/a 0.0040 0.0007 Estrie (incl. Sherbrooke) (90) 9.2 n/a 0.0055 0.0006 Quebec City (90) 9.4 n/a 0.0037 0.0010 Saguenay-Lac-Saint-Jean (90) 9.9 n/a 0.0089 0.0078 Married in the region between 1945 and 1965 with parents married in the province3
Lower Saguenay (100) 10.1 n/a 0.0140 0.0104 Upper Saguenay (100) 9.6 n/a 0.0084 0.0062 Lac-St-Jean (100) 9.8 n/a 0.0081 0.0043 Married in the region between 1945 and 1965 with parents married in the province4
Montreal area (722) 9.1 75.3 n/a 0.0004 Centre (incl. Sherbrooke) (348) 9.4 80.9 n/a 0.0006 Quebec City area (272) 9.6 86.7 n/a 0.0008 North-East (incl. Saguenay) (157) 9.8 86.2 n/a 0.0056 Born in the
region before 1960 or with at least one parent
born in the region before 19605 Montreal (22) 9.0** n/a n/a 0.0004 Quebec City area (16) n/a n/a 0.0006 Saguenay (22) n/a n/a 0.0055
1 Present study. 2 Vézina et al. (2004). 3 Lavoie et al. (2005).
4 Bherer et al. (2011); Letendre (2007).
5 Roy-Gagnon et al. (2011).The genealogical sample used in the Roy-Gagnon study was also used by Gauvin et
al. (2014 and 2015).
* Not available.
Fig. 1
Fig. 3
Fig. 5
Figure 1. Completeness (%) of the genealogies, per generation (generation 1 = parents of the participants).
Figure 2. Distribution (‰) of immigrant ancestors (n = 14 184) in the four regions.
Figure 3. Distribution (%) of immigrant ancestors according to their origin. Based on known origins only (Montreal: n = 10 775 (82.1%); Sherbrooke: n = 5428 (94.9%); Quebec: n = 6173 (91.7%); Saguenay: n = 4184 (97.4%)).
Figure 4. Mean inbreeding coefficients of participants, per generation (generation 1 = parents of the participants). Number of coefficients per generation: Montreal: n = 3806; Sherbrooke: n = 311; Quebec: n = 746; Saguenay: n = 247.
Figure 5. Proportion (%) of inbreeding coefficients of participants > 0, per generation (generation 1 = parents of the participants). Number of coefficients per generation: Montreal: n = 3806; Sherbrooke: n = 311; Quebec: n = 746; Saguenay: n = 247.
Figure 6. Mean kinship coefficients of participants, per generation (generation 1 = parents of the participants). Number of coefficients per generation: Montreal: n = 94 131 895; Sherbrooke: n = 626 665; Quebec: n = 3 612 505; Saguenay: n = 394 953.
Figure 7. Proportion (%) of kinship coefficients of participants > 0, per generation (generation 1 = parents of the participants). Number of coefficients per generation: Montreal: n = 94 131 895; Sherbrooke: n = 626 665; Quebec: n = 3 612 505; Saguenay: n = 394 953.