IMAGERIE INTÉGRÉE PAR INVERSION GÉOPHYSIQUE 3D, EXTRACTION DE CARACTÉRISTIQUE MULTIVARIÉE ET SÉLECTION DE
CARACTÉRISTIQUE SPECTRALE
THE SE PRESENTEE
COMME EXIGENCE PARTIELLE
DU DOCTORAT EN SCIENCES DE L'ENVIRONNEMENT
PAR
BARMAN ABBASSI
Mise en garde
La bibliothèque du Cégep de l’Témiscamingue et de l’Université du Québec en Abitibi-Témiscamingue a obtenu l’autorisation de l’auteur de ce document afin de diffuser, dans un but non lucratif, une copie de son œuvre dans Depositum, site d’archives numériques, gratuit et accessible à tous.
L’auteur conserve néanmoins ses droits de propriété intellectuelle, dont son droit d’auteur, sur cette œuvre. Il est donc interdit de reproduire ou de publier en totalité ou en partie ce document sans l’autorisation de l’auteur.
Warning
The library of the Cégep de l’Témiscamingue and the Université du Québec en Abitibi-Témiscamingue obtained the permission of the author to use a copy of this document for non-profit purposes in order to put it in the open archives Depositum, which is free and accessible to all.
The author retains ownership of the copyright on this document. Neither the whole document, nor substantial extracts from it, may be printed or otherwise reproduced without the author's permission.
INTEGRATED IMAGING THROUGH 3D GEOPHYSICAL INVERSION, MULTIVARIATE FEATURE EXTRACTION, AND SPECTRAL FEATURE
SELECTION
THESIS PRESENTED IN PARTIAL FULFILLMENT OF THE REQUIREMENTS FOR THE DEGREE OF DOCTOR OF PHILOSOPHY IN ENVIRONMENTAL
SCIENCES
BY
BARMAN ABBASSI
And ali my family and friends, Without whom none of my success would be possible
her patience, motivation, immense knowledge and her constant technical and financial support during this pro gram. Besides my advisor, I would like to thank the rest of my thesis committee: Prof. Jean-Claude Mareschal, Prof. Claude Jaupart, Prof. Michel Jébrak, for their comments, encouragement, and also their insightful questions which incented me to widen my research from varions angles.
This project was a collaboration between the Université du Québec en Abitibi-Témiscamingue and the University of Alberta, with industry partners Amarc Resources Ltd., Geotech Ltd., Gerald G. Carlson, and John A. Chapman. This study would not have been possible without the financial support from NSERC (Natural Sciences and Engineering Research Council of Canada) and FRQNT (Fonds de recherche, Nature et technologies du Québec).
Chapters II, III, IV and V of this doctoral the sis are research articles submitted or in preparation to be submitted to peer-reviewed journals. I was principally responsible for the content of these chapters, including data processing, mode ling, and coding of algorithms.
Reviews significantly improved chapters II, III from following co-authors: Jeremy P. Richards, Juliane Hübert, Jean M. Legault, Mark Rebagliati and Ken Witherly. My sincere thanks also go to Prof. Jeremy P. Richards, Juliane Hübert, and Ken Witherly for the ir insightful teamwork, comments, and revisions of my papers. Mark Rebagliati from Amarc Resources Ltd. is particularly thanked for providing access to drillcore and geophysical data and reports; Jean M. Le gault from Geotech Ltd. is acknowledged for the collection of the aeromagnetic data as weil valuable discussions throughout the
project. I also coded and tested a variant of statistical and artificial intelligence algorithms in chapters IV and V under the supervision of Prof. Li Zhen Cheng.
I would like to express my deepest gratitude to ali my family for supporting me and for their patience throughout ali these years of academie research.
ACKNOWLEDGMENTS ... iv
LIST OF FIGURES ... x
LIST OF TABLES ... xix
LIST OF SYMBOLS ... xx
RÉSUMÉ ... xxiii
ABSTRACT ... xxv
CHAPTER I GENERAL INTRODUCTION ... 1
1.1 Motivation ... 1
1.2 Problem statement ... 2
1.3 Geophysical 3D modeling ... 4
1.4 Feature analysis ... 6
1.5 Research outline ... 7
CHAPTER II 3D COOPERATIVE INVERSION OF MAGNE TIC AND DC/IP DATA OVER NEWTON EPITHERMAL AU-AG DEPOSIT IN BRITISH COLUMBIA, CANADA ... 8 Résumé ... 9 Abstract ... 11 2.1 Introduction ... 12 2.2 Geological setting ... 15 2.3 Physical properties ... 18
2.4 Geophysical data ... 21
2.5 3D Magnetization vector inversion ... 24
2.6 3D DC/IP inversion ... 27
2. 7 3D cooperative inversion of magnetic and DC/IP data ... 30
2.8 Conclusion ... 42
2.9 Acknowledgments ... 44
CHAPTER III GEOPHYSICAL PROPERTIES OF AN EPITHERMAL AU-AG DEPOSIT IN BRITISH COLUMBIA, CANADA ... 45
Résumé ... 46
Abstract ... 4 7 3.1 Introduction ... 48
3.2 Geological setting ... 50
3.2.1 Regional geology ... 50
3.2.2 Deposit scale bedrock geology ... 52
3.3 Borehole geology and petrophysics ... 52
3.3.1 3D lithology and hydrothermal alteration mode! ... 52
3.3.2 Drillcores magnetic susceptibility and y-ray concentration ... 56
3.4 Geophysical datasets ... 58
3.5 Methods ... 61
3. 5.1 y-ray data interpretation ... 61
3. 5. 2 3D unconstrained magnetization vector inversion ... 61
3.5.3 3D IP-DC resistivity inversion ... 62
3.5.4 3D cooperative magnetic-IP-DC resistivity inversion ... 63
3.6.1 Regional unconstrained interpretation ... 65
3.6.2 Prospect scale unconstrained interpretation ... 67
3.6.3 Deposit scale constrained interpretation ... 71
3. 7 Conclusion ... 77
3.8 Acknowledgments ... 79
CHAPTER IV FEATURES EXTRACTION FOR 3D INTERPRETATION OF MULTIPLE GEOPHYSICAL DATA THROUGH INDEPENDENT COMPONENT ANALYSIS ... 80
Résumé ... 81
Abstract ... 82
4.1 Introduction ... 83
4.2 Feature Extraction Methodology ... 85
4.3 Petrophysical Mode!: A Mixing System ... 90
4.4 Petrophysical Feature Extraction ... 95
4.5 Simulation of Geophysical System ... 98
4.5.1 3D Forward Mode ling ... 98
4.5.2 3D Inversion ... 101
4.6 Post-Inversion Feature Extraction ... 103
4.7 Conclusion ... 105
4.8 Acknowledgments ... 106
CHAPTER V 3D SUPERVISED SPECTRAL FEATURE SUBSET SELECTION ... 107
Résumé ... 108
5.1 Introduction ... 111
5.2 Theory and methods ... 113
5.2.1 Wavelet-ICAfeature extraction ... ll6 5.2.2 Supervised artificial neural networks (ANN) ... 117
5.2.3 Spectral FSS optimization through GA optimization ... 122
5.3 Results ... 125
5.4 Conclusion ... 140
5.5 Acknowledgments ... 141
CHAPTER VIGENERALCONCLUSION ... l42 APPENDIX A MATLAB PROGRAMS FOR 2D SFSS ... 145
APPENDIX B 2D SPECTRAL FEATURE SELECTION: MATLAB CODE EVALUATION ... 185
2.1 Severallarge porphyry and epithermal deposits located in Stikinia terrain (ST) in central British Columbia. Other terranes are:
Alexander terrane (AX); Bridge River terrane (BR); Cari ho terrane (CAC); Cache Creek terrane (CC); Cadwallader terrane (CD); Coast Complex terrane (CX); Harrison terrane (HA); Kootenay Terrane (KO); Monashee (MO); Cratonal North America terrane (NA); Nisling terrane (NI); Post Accretionary Plutons (P AP); Quesnellia terrane (QN); Shuksan terrane (SH); Slide Mountain Terrane (SM); Wrangellia (WR). Modified from
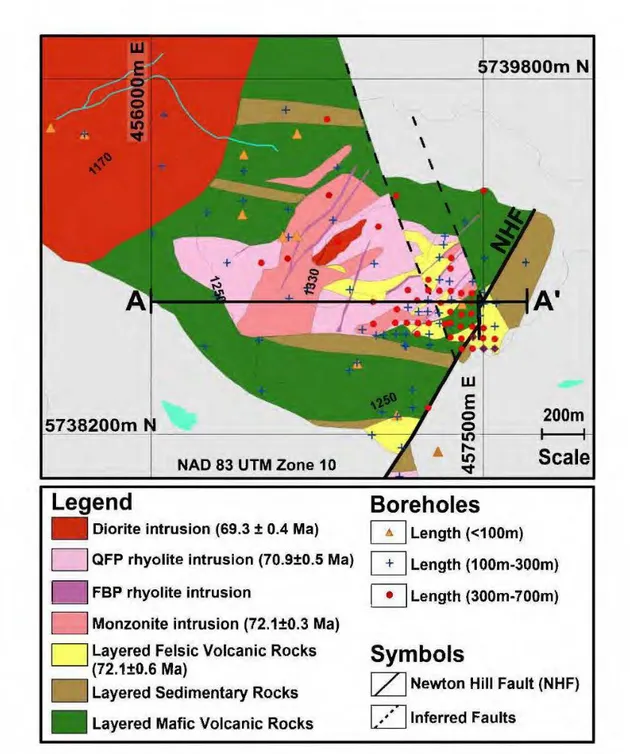
Massey et al. (2005) ... 15 2.2 Bedrock geology map at the deposit scale. Colored dots indicate
drillhole locations with varions totallengths (Pres sacco, 2012; McClenaghan, 2013). The light gray parts are undefined regions due to the lack ofborehole information in the periphery of the
deposit. Contours indicate topography ... 17 2.3 Boxplot demonstration of measured magnetic susceptibilities of
different lithologies from the Newton deposit. Susceptibility axis is logarithmic. The lithologies with average susceptibility values are: monzonite (M, 0.00012 SI); quartz feldspar porphyry (QFP, 0.00012 SI); felsic volcanic rocks (FVR, 0.00017); sedimentary rocks (SR; 0.00017); diorite (D, 0.014 SI); mafic volcanic rocks
(MVR, 0.009) ... 18 2.4 3D borehole models. (a) Borehole susceptibility model. (b) Au
concentration model (b ). Both models are sliced horizontally at the elevation of 1000 m. Bedrock geology is overlaid on both
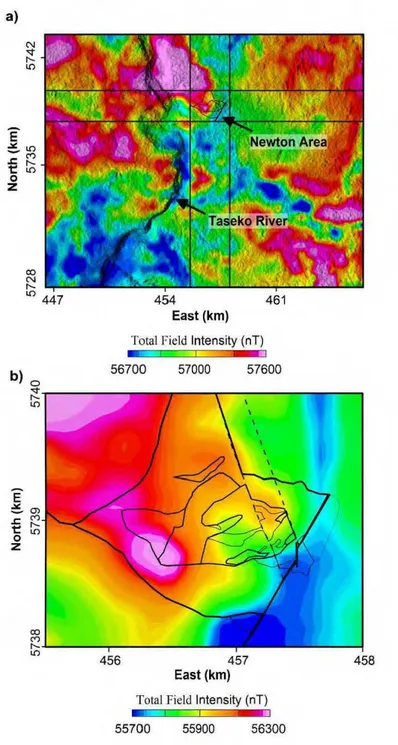
models. Black dots indicate the location ofboreholes ... 19 2.5 Magnetic data-sets. (a) Total magnetic field intensities on a
regional scale. Data are draped on a shaded relief digital elevation model of the region. (b) Total magnetic field intensities on
Newton deposit scale. Black lines outline the bedrock geology
2.6 DC/IP data-set. Plan maps are showing the locations of DC/IP electrodes covering the halo ofhydrothermal alteration over the Newton area. (a) Measured apparent resistivities. (b) Measured apparent chargeabilities. Data are shown for the di polar length of
100 rn and dipolar separation of n ~ 4 . ... 23 2.7 MVI models sliced at the elevation of IOOOm. (a) First sharpening
round. (b) Second sharpening round. ( c) Third sharpening round. (d) Fourth sharpening round. Outline of Au mineralization is shown in the white contour. Bedrock geology is overlaid on ali
slices ... 26 2.8 Preliminary inversion ofDC/IP data overthe Newton deposit. (a)
Resistivity mode! sliced at elevation 1000 m. (b) Chargeability mode! sliced at elevation 1000 m. Outline of Au mineralization is shown in the white contour. Bedrock geology is overlaid on both
slices ... 29 2.9 Deposit scale DC/IP inversion sliced at the elevation of 1000 m.
(a) Electrical resistivity mode! (contours indicate topography). (b) IP chargeability mode! compared to the borehole magnetic-highs (black contour). Outline of Au mineralization is shown in the
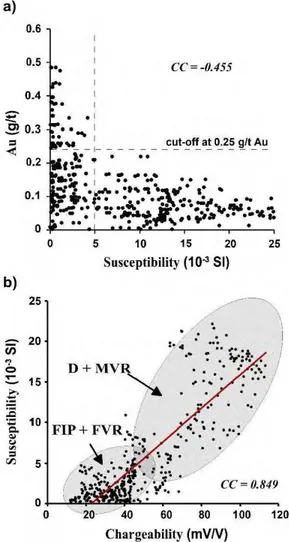
white contour. ... 31 2.10 Susceptibilities of rock sarnples versus inverted chargeabilities
and Au concentrations. (a) Anticorrelation between the
susceptibilities and Au concentrations. (b) Correlation between the chargeabilities and susceptibilities. Low
susceptibility/chargeability porphyritic intrusions (FIP) and felsic volcanic rocks (FVR) are divided from high
susceptibility/chargeability mafic volcanic rocks (MVR) and
dioritic intrusions (D). CC indicates correlation coefficient. ... 32 2.11 Indirect evidence of a link between the underlying physical
properties of rocks. (a) Forward magnetic response of the IP-driven susceptibility mode!. (b) Forward magnetic response of the MVI susceptibility mode! (contours) overlaid on the observed residual magnetic field. (c) Forward magnetic response of the borehole susceptibility mode!. Ali magnetic field responses are reduced to the magnetic pole for centralization of the anomal y
picks ... 34 2.12 Cooperative magnetic-DC/IP inversion workflow ... 35
2.13 A horizontal slice of the calculated weight model. ... 37 2.14 Cooperative inversion results with different weighting scenarios.
(a, b and c) Cooperative susceptibilities with uniform weighting. ( d, e and f) Cooperative susceptibilities with non-uniform
weighting. The global weight ( w) is reduced from 0.1 to 0.001 in each scenario. Outline of Au mineralization is shown in the white
contour. Bedrock geology is overlaid on both slices ... 39 2.15 Evaluation ofinverted susceptibilities. (a) Unconstrained MVI
susceptibilities versus borehole susceptibilities. (b) Susceptibility model from non-uniform cooperative inversion ( w = 0.01) versus
borehole susceptibilities. CC indicates correlation coefficient ... 40 2.16 The 3D view of cooperative inversion results. The red wirefrarne
indicates the high magnetic zone which confines a low magnetic mineralized zone within itself. The NHF cross-cuts the eastern
portion of the low magnetic zone ... 41 3.1 Severallarge porphyry and epithermal deposits located in Stikinia
terrain (ST) in central British Columbia. Other terranes are: Alexander terrane (AX); Bridge River terrane (BR); Caribo terrane (CAC); Cache Creek terrane (CC); Cadwallader terrane (CD); Coast Complex terrane (CX); Harrison terrane (HA); Kootenay Terrane (KO); Monashee (MO); Cratonal North America terrane (NA); Nisling terrane (NI); Post Accretionary Plutons (P AP); Quesnellia terrane (QN); Shuksan terrane (SH); Slide Mountain Terrane (SM); Wrangellia (WR). Modified from
Massey et al. (2005) ... 50 3.2 Regional geological features of Newton area modified after
British Columbia Geological Survey Geoscience Map
(mapplace.ca). Geology is draped on shaded relieftopography ... 51 3.3 Bedrock geology map at the deposit scale. Colored dots indicate
drillhole locations with various totallengths. The light gray parts are undefined regions due to the lack of borehole information in
the periphery of the deposit. Contours indicate topography ... 53 3.4 Lithology and alteration models based on borehole data: (a) A
cross-section of 3D lithology model along profile AA' in Figure 3.3 (5738800m N). (b) A cross-section of 3D alteration model along the same profile. The Newton Hill Fault (NHF) has
disrupted the continuity of alllithological units and offsets the mineralized zone. The go id mineralization correlates strongly with quartz-sericite alteration, predominantly in the felsic
volcanic unit. ... 55 3.5 Magnetic susceptibilities of drillcores on profile AA'. High
magnetic mafic volcanic rocks and dioritic intrusions are separated from other low magnetic rocks (felsic volcanic rocks
and porphyritic intrusions) ... 56 3.6 Boxplot demonstration of measured magnetic susceptibilities and
y-ray potassium (K) concentrations of different lithologies and
alteration assemblages. Susceptibility axis is logarithmic ... 58 3.7 Magnetic and IP-DC-resistivity datasets. Ali data are draped on a
shaded relief digital elevation mode! (DEM) of the region: (a) Airborne total magnetic field intensities (TF) on a regional scale (GSC database). (b) Helicopter-borne total magnetic field intensities (TF) on deposit scale (Amarc dataset) together with
locations of IP-DC-resistivity profiles ... 60 3.8 Ternary images ofairborne radiometrie datasets (GSC): (a)
Deposit scale RGB image of K-eTh-eU channels. White regions indicate the overlaps of ali three elemental RGB channels. (b)
Deposit scale RGB image of K/eTh-eTh/eU-eU/K channels ... 61 3.9 Sharp regional MVI mode! after four IRI focused on the high and
low magnetic susceptibility zones: (a) The 3D MVI susceptibility mode! on a plan view (draped on shaded relieftopography). (b) The 3D MVI susceptibility mode! cross-eut on the profiles AA' 5738800m N. Directions ofmagnetization vectors are overlain on the cross-section AA'. Outlines of the hydrothermal zone and
Newton deposit area are shown in the rectangles ... 66 3.10 Prospect sc ale unconstrained MVI mode! after four IRI on Amarc
datasets: (a) The 3D MVI susceptibility mode! on a plan view draped on shaded relieftopography (Outline of Au-Ag-Cu mineralization is shown in the black contour). (b) The 3D MVI susceptibility mode! sliced at the elevations of 1000 rn (the bedrock geology is overlapped). ( c) The 3D MVI susceptibility mode! cross-eut on the profiles AA' at 5738800m N. Directions
3.11 Prospect scale inversion of IP-DC resistivity data over Newton area: (a) Plan view of the recovered resistivity model draped on a shaded relieftopography model (Outline of Au-Ag-Cu
mineralization is shown in the black contour). (b) Resistivity model sliced at elevation 1000 rn (the bedrock geology is
overlapped). ( c) Resistivity model cross-eut on the profile AA' at 5738800m N (Outline of Au mineralization is shown in the black
contour) ... 69 3.12 Prospect scale inversion ofiP-DC resistivity data over Newton
area: (a) Plan view of the recovered chargeability model draped on a shaded relieftopography model (Outline of Au-Ag-Cu mineralization is shown in the black contour). (b) Chargeability model sliced at elevation 1000 rn (the bedrock geology is overlaid on the model). ( c) Chargeability model cross-eut on the profile AA' at 5738800m N (Outline of Au mineralization is shown in
the black contour) ... 70 3.13 Deposit scale cooperative magnetic-IP-DC resistivity inversions
sliced at the elevation of 1000 rn: (a) Electrical resistivity mo del. (b) IP chargeability mo del. ( c) Magnetic susceptibility mo del. The bedrock geology is overlaid on all models. The gray shaded
zone is the outline of Au-Ag-Cu mineralization ... 72 3.14 Petrophysical domains inferred from the integration of
cooperatively inverted physical properties on the three physical properties' cross-plots. (a) A susceptibility-resistivity cross-plot with two distinct domains related to the high and low
chargeability values. (b) A susceptibility-chargeability cross-plot with two distinct domains related to the high and low resistivity values. ( c) A resistivity-chargeability cross-plot with two distinct
domains related to the high and low susceptibility values ... 74 3.15 Results of cooperative modeling compared with borehole
information cross-eut on the profile AA' at 5738800m Nin Figures 3.3: (a) Electrical resistivity mo del. (b) IP chargeability mo del. ( c) Magnetic susceptibility mo del. ( d) Integrated
geological interpretation ... 76 4.1 Workflow of geological model construction. The background
geology consists of a three-layer stratum (Lia, Lib, Lie) intruded by a dyke (L!d). After several faulting and shear deformation, two
alteration events (L2 and L3) along with further deformations overprint the host geology. Noddy 3D geological and geophysical mode ling package is used to build the geological mode! (Encom
Technology Pty Ltd, 2009) ... 91 4.2 3D geological mode!: (a) 3D block view of ali the background
geological features. (b, c, d, and e) Background geological features (Lla, Llb, Llc). (f) Two successive alteration events
overlapped on the background geology (L2 and L3) ... 92 4.3 Latent geological features (a) compared to physical properties
produced in the petrophysical mixing system (p, m, and
x
in b, c, and d). Each physical property mode! provides partial informationabout the latent geological features ... 94 4.4 Histograms of simulated physical properties with added
non-gaussian geological noise: (a) Electrical Resistivity distribution. (b) IP chargeability distribution. ( c) Magnetic susceptibility distribution. The solid curve indicates the cumulative distribution
function ... 95 4.5 Assessment of different source separation methods. (a, band c)
Principal component analysis. ( d, e, f) Fast independent
components by kurtosis maximization. (g, h, 1) Fast independent components by negentropy maximization. Ali principal
components (PCs) and in dependent components (ki Cs and ni Cs)
are normalized from zero to one for consistency of visualization ... 97 4.6 The geophysical responses of the mixed physical properties. (a)
Total magnetic field intensities after reduction to the magnetic pole. (b) Apparent resistivities. ( c) Apparent chargeabilities. DC/IP responses are presented on two NS and EW pseudo-sections as weil as a horizontal slice corresponding to the dipolar separation of n ~ 4. The arrows (black) indicate the location of
simulated DC/IP electrodes ... 100 4. 7 Geophysical inversion results. (a), (b) and ( c) are smooth
inversion results. ( d), ( e) and (f) are sharper inversion results. (g),
(h), (i) represent sharpest inversion results ... 102 4.8 Post-inversion feature extraction through negentropy
maximization (niCA) on different inversion scenarios. (a), (b) and ( c) are in dependent components of smoothest physical properties.
( d), ( e) and (f) are in dependent components of sharper physical properties. (g), (h), and (i) are independent components of
sharpest physical properties ... 104 5.1 Workflow offeature selection algorithm designed for geological
interpretation ... 115 5.2 2D Isotropie Mexican Hat mother wavelet. The left fignre is the
plan view of the right fignre ... 117 5.3 A simple perceptron maps a set of inputs (XR) onto a specifie
output (y) ... 119 5.4 A multilayer perceptron (se ven inputs and five neurons in the
hidden layer) maps a set of inputs (XR) onto an appropriate output (y). Defining a performance function (F) during the
back-propagation process updates the synaptic weights to make output
cl oser to the specified target. ... 120 5.5 Linearly (left) and nonlinearly (right) separable two-object
classification problems ... 121 5.6 A general GA flowchart. Random change includes crossover and
mutation that produces new population better fitted to the
environmentallandscape ... 123 5.7 Location ofboreholes in Newton epithermal system (a), versus
density ofborehole data points in 3D (b ). Borehole data are available in places with densities more than one. In places without data points, conventional interpolations methods do not work
properly ... 126 5.8 Interpolation of geological targets with conventional methods. (a)
Lithotype data (mafic/felsic). (b) Nearest-neighbor interpolation oflithotypes. ( c) Kriging of lithotypes. ( d) Au grade data. ( e) Nearest-neighbor interpolation of Au grades. (f) Kriging of Au
grades ... 127 5.9 Three inverted physical property models used as inputs of the
SFSS algorithm ... 128 5.10 Three independent components (ICs) ofthe physical properties
5.11 Raw 3D spectral features produce by CWT with 5 scales in 24 directions (0°, 15°, 30°, 45°, 60°, 75°, 90°, 105°, 120°, 135°, 150°,
165°, 180°, 195°, 210°, 225°, 240°, 255°, 270°, 285°, 300°, 315°, 330°, 345°,). The extracted features are sliced at the elevation of
1000 m ... 130 5.12 Total 120 number of separated 3D spectral features after
Fast-ICA dimensionality reduction for lithological feature selection.
The extracted features are sliced at the elevation of 1000 m ... 132 5.13 Evaluation of lithotype prediction for ANN and FSS algorithms.
R-sq denotes the R-squared values ... 133 5.14 The bi-objective error landscape ofSFSS algorithm during
lithotype estimation ... 134 5.15 Lithotype predictions: Results of 3D ANN predictiond (a) versus
3D SFSS predictions (b ). SFSS resulted in the better
reconstruction of lithotypes with Jess number of input spectral features (NJ~ 78). Results are sliced horizontally at the elevation
of 1000 m ... 134 5.16 Total 78 number of 3D selected features used for lithotype
prediction. The selected features are sliced at the elevation of
1000 m ... 135 5.17 Total 108 number of separated 3D spectral features after
Fast-ICA dimensionality reduction for Au grade feature selection. The
extracted features are sliced at the elevation of 1000 m ... 136 5.18 Evaluation of Au grade prediction for ANN and FSS algorithms.
R-sq denotes the R-squared values ... 137 5.19 The bi-objective error landscape of SFSS algorithm during Au
grade estimation ... 138 5.20 Au grade predictions: Results of 3D ANN predictions (a) versus
3D SFSS predictions (b ). SFSS resulted in better reconstruction of Au grade distributions with Jess number of input spectral features (NJ). Results are sliced horizontally at the elevation of
5.21 Total96 number of 3D selected features used for lithotype prediction. The selected features are sliced at the elevation of
1000 m ... 139 B.1 Simulation of a 2D imaging system containing severa! latent
fe atur es (faces). The red traverse !ines are indicating the sampled
pixels that form the targets of the SFSS algorithm ... 186 B.2 Three independent components (ICs) of the mixed image
calculated from negentropy maximization of input mixed images ... 186 B.3 240 raw spectral features produce by CWT with 20 scales in four
directions (0°, 90°, 180°, 270°) ... 187 B.4 120 separated spectral features after Fast-ICA dimensionality
reduction ... 188 B.S Evaluation of ANN and spectrallearning algorithms in target
prediction ... 189 B.6 The bi-objective error landscape of SFSS algorithm ... 190
3.1 Classified petrophysical domains based on inverted physical
f
p'
Jr'
1 }Rem 1 ]!ndx
1 J Total Zr ota! mp
physical properties of subsurface
fotward problem operator
approximated physical properties measured signais (data)
inverse problem operator remanent magnetization vector inductive magnetization vector earth's magnetic field vector magnetic susceptibility total magnetization vector total magnetic susceptibility induced polarization chargeability
reference direct current electrical conductivity
perturbed subsurface induced polarization chargeability electrical potential
Od; <1
0<k,
<1
cc
Ü<w<l D YPCL'
Rkurt
E(.)
H pdata constraint factor in robust inversion mode! constraint factor in robust inversion correlation coefficient
borehole susceptibilities
mode led susceptibilities from magnetization vector inversion global weight in cooperative magnetic inversion
vertical to horizontal flatness filter ratio in DC/IP inversion latent geological features
non-gaussian geological noise on physical properties mixing matrix
separation matrix
princip le component analysis weight matrix centered physical properties
!east Gaussian independent components ( approximated lithotypes) ICA rotation matrix
kurtosis operator expected value entropy
neg
GIf/(
x, y)
y t N R EG/obal negentropy operatornon-quadratic exponential function in negentropy maximization 2D continuons wavelet transform coefficients
2D mother wavelet
neural network input vector neural network weights neural network output neural network target
!east mean square neural network objective function number of neural network output samples (instance size) number of neural network inputs.
genetic algorithm global bi-objective cost function number of features
inverse et la fusion de modèles ainsi qu'aux interprétations intégrées en géophysique d'exploration minérale. Dans cette étude de doctorat, de nouvelles méthodologies sont testées et évaluées pour l'interprétation intégrée 3D de plusieurs images géophysiques ciblant les gisements minéraux. La modélisation 3D inverse de multiples données géophysiques, de statistiques multivariées et de méthodes d'apprentissage automatique est utilisée pour développer une méthodologie robuste d'interprétation intégrée 3D. Une inversion coopérative de plusieurs données géophysiques est proposée pour l'imagerie 3D d'un gisement épithermal Au-Ag en Colombie-Britannique (Canada). Les données géophysiques multiples sont interprétées et évaluées par des observations pétrophysiques, géochimiques et géologiques de forage afin d'améliorer notre compréhension du système épi thermal de Newton en termes de signatures géophysiques. L'interprétation intégrée a identifié quatre domaines pétrophysiques basés sur les trois propriétés physiques inversées en coopération, y compris la résistivité électrique, la chargeabilité PP et la susceptibilité magnétique. Nous avons également développé un outil statistique 3D pour extraire des informations géologiques à partir de modèles de propriétés physiques inversés basés sur l'analyse de composants indépendants à travers la maximisation de la néguentropie. Une interprétation automatisée de plusieurs images géophysiques 3D est également présentée par un algorithme de sélection de sous-ensembles spectraux hybrides (SSSH), basé sur un algorithme d'intelligence artificielle supervisée généralisée qui cherche à reconstruire des cibles géologiques limitées à partir d'images géophysiques 3D. Le présent algorithme SSSH prend les caractéristiques spectrales extraites de la décomposition en ondelettes des composants indépendants des propriétés physiques et essaye simultanément de minimiser la fonction de coûts du réseau neuronal et le nombre de caractéristiques spectrales d'entrée grâce à une optimisation algorithmique multi-objectif. Par rapport aux méthodes d'interpolation 3D conventionnelles, telles que le
maillage direct 3D et le krigeage, les modèles géologiques 3D récupérés avec SFSS ajoutent une valeur prédictive à nos connaissances géologiques dans des endroits sans information de forage.
mode! fusion and integrated interpretations in mineral exploration geophysics. In this study, new methodologies are tested and evaluated for 3D integrated interpretation of multiple geophysical images targeting mineral deposits. 3D inverse modeling of multiple geophysical data, multivariate statistics, and machine learning methods are used to develop a robust 3D integrated interpretation methodology. A cooperative inversion of multiple geophysical data is proposed for 3D imaging of an epithermal Au-Ag deposit in British Columbia (Canada). The preliminary integrated interpretation identified four petrophysical domains based on the three cooperatively inverted physical properties, including electrical resistivity, IP chargeability, and magnetic susceptibility. A 3D statistical tool is also developed to extract geological information from inverted physical property models based on independent component analysis through negentropy maximization. An automated interpretation of multiple 3D geophysical images is presented through a hybrid spectral feature subset selection (SFSS) algorithm, which is based on a generalized supervised neural network algorithm to rebuild limited geological targets from 3D geophysical images. The SFSS algorithm automatically selects the optimum combination of spectral features produced from independent components of the physical properties. Compared to conventional 3D interpolation methods such as 3D direct gridding and kriging, the 3D geological models recovered with SFSS add predictive value to our geological knowledge in places without borehole information.
Keywords: Exploration Geophysics, 3D Inversion, Gold-Silver Deposit, Feature Extraction, Feature Selection, Wavelet, Neural Networks, Genetic Algorithm
GENERAL INTRODUCTION
1.1 Motivation
Mineral deposits are the primary source of the metals and minerals that feed our modern civilization. Despite the significant developments in the mining industry, as well as growing demand for base and precious metals, mineral exploration still faces crucial challenges. Global trends show that the number of major mineral discoveries is drastically declined during the last 25 years due to the fact that the most outcropping mineralization systems are mapped and already excavated (Barnett and Williams, 2006). Therefore, a major challenge for mineral exploration in future will be 'deep' targeting of hidden resources. The 'deep' targets are usually considered as resources as deep as hundreds of meters to tho us and meters of the depth. However, occurrences of
'deep' targets are not limited to the third dimension, and they can be seen as complex obscured mineralization systems barely detectable within a large amount of hyper-dimensional geoscientific data. Therefore, advanced data mining methods are needed to extract useful information from large amount of data sets (Barnett and Williams, 2006). Specifie strategies and methodologies are needed to decipher the interrelationship between different types of data, extracting mo del parameters from raw measurements and reconciling all the geoscientific patterns in an integrated modeling system. Responding to these challenges of integrating multidisciplinary information is the motivation of this Ph.D. research.
1.2 Problem statement
Disseminated sulfide deposits are low- to medium-grade deposits in large tonnage related to felsic to intermediate porphyritic intrusions (Simmons et al., 2005; Pirajno, 2009). They supply about 75%, 50%, and 20% of the world's Cu, Mo, and Au, respectively, as weil as almost 100% of its Re (Sillitoe, 2010). They are therefore important exploration targets for the mining industries. A typical disseminated sulfide system is the result of hydrothermal fluids activities during the cooling process of magma at convergent plate tectonic boundaries (Bliss, 1992, Sillitoe, 2010). Ali of these interactions result in significant geochemical alterations that are important signatures of the mineral deposit occurrences. Therefore, it is essential to have a robust image of the alteration zones as geochemical attributes ofmineralization systems. This is important not only in term of exploration goals (reducing the economie and environmental risk of explorations) but also on upcoming exploitations since the presence of certain geochemical alterations are likely to produce extremely acidic drainage water releasing in groundwater.
As the depth of the average discovery increases, geophysics plays an increasingly important role in the exploration of new mineral deposits for severa! reasons. Most geophysical surveys cover relatively large areas in a short period before the drilling programs. This large coverage expands our field ofview to have a better understanding of regional geological features in connection with deposit sc ale footprints. Geophysical methods are mostly non-invasive and provide continuons information in space compared to punctual drilling and sampling methods. Compared to expensive and time-consuming direct assessments, geophysical methods are fast and cost-effective. Different geophysical data provide different images of the subsurface based on the underlying physical property of rocks. Inverse mode ling of geophysical data results in physical property images of the subsurface. Each inverted physical property image
provides a specifie amount of information about particular geological features. Incorporating multiple inverted physical property images in interpretations could provide a way to add value to our wholesome geological understanding. For example, magnetic and radiometrie surveys are important methods for detection of magnetite and potassium radioelement in alteration zones (Dentith and Mudge, 2014). Electrical and Induced Polarization methods are sensitive to electrically conductive zones ( conductive alterations as weil as Cu/ Au occurrences), and high levels of chargeability may indicate disseminated sulfide mineralization (Sumner, 1976; Dentith and Mudge, 2014).
Today, with increasing economie and environmental concerns on mineral deposit explorations, it is important to extract relevant geological features from geophysical images in an integrated methodology, in order to increase the depth of exploration. Researches in this Ph.D. thesis are therefore focused on the integrated interpretation of geophysical data targeting mineral deposits to provide a robust 3D image of the subsurface that reconciles observations. Multivariate statistics and artificial intelligence (AI) techniques are used in this study to explore the relationship between geophysical images and hidden geological features to construct a 3D geological mode! from geophysical data sets.
1.3 Geophysical 3D mode ling
Simulation of a geophysical system consists of a well-posed set of equations that calculates the geophysical responses (Sc) on the Earth surface from 3D subsurface physical property (P1) distributions (forward mode ling):
(I.l)
Where
f
represents a forward problem operator in general case that simulates the target geophysical responses (signais), and c ~ 1, 2, 3, ... , p, which denotes the number of pdata points. In this study, finite element method is used to calculate the geophysical responses. The imaging system approximates the physical properties (P1) through inverse modeling:
(L2)
Where
F
1 is the inverse problem operator and Sd denotes the measured signais. Thetask of retrieving complete information about the earth mode! (mode! space) from a certain set of geophysical data (data space) is inversion.
3D voxel inversion is used in this study to retrieve physical properties (P/) through discretization of the subsurface into rectangular cells in a 3D finite elementary mesh, where physical property values in each cell are estimated based on Equation I.l. In each iteration of inversion, a Gauss-Newton !east-squares optimization tries to reduce the gap between measured and calculated geophysical responses by modifying the mode! parameters (physical properties, Pi}.
The inversion of potential field datais highly non-unique, which means the output of a magnetic inversion does not usually lead to a unique mode!, and many equivalent
models are producible that can be matched to the observations. Constrained inverse mode ling provides a way to eliminate the unreliable equivalent models to get the most reliable 3D models of subsurface (Fullagar et al., 2000; Wisen and Christiansen, 2005; Lelièvre, 2009; Lelièvre et al., 2009). The a priori knowledge for constraining inversions could come from different sources like borehole geological observations, petrophysical measurements, and justifications from interpretations of other geophysical methods. The latter is well-known as cooperative inversion. Cooperative inversion algorithms seek to reconcile two or multiple physical property models by incorporating the inversion output from one data set as a priori knowledge for another data set (Lines et al., 1988; Paasche and Tronicke, 2007). Another approach is joint inversion, where multiple data sets are inverted simultaneouslyto reconcile ali physical property models (Haber and Oldenburg, 1997; Doetsch et al., 2010; Chen and Hoversten, 2012; Gallardo et al., 2012; Haber and Gazit, 2013).
In this study, a cooperative inversion of multiple geophysical datais used to image 3D physical property models to refine a consistent magnetic susceptibility mode! by information derived from inversion of direct current (DC) electrical resistivity and induced polarization (IP) data. We also explore the effect of the smoothness and sharpness of the imaging system on the output of interpretation. This gives us a valuable view about how the sharpness of the imaging system could influence the recovered geological features, i.e., to determine which parts of the spatial domain of the original geology are vulnerable to the geophysical imaging. We explore the two end-points of the imaging scenarios (sharp versus smooth) in DC/IP inversion as weil as magnetic inversion. We used a blocky inversion method for the inversion of electrical resistivity and chargeability data (Claerbout, 1973; Loke et al., 2003; Loke, 2015), and an iterative reweighting inversion (Portniaguine and Zhdanov, 2002; Geosoft Inc., 2012) for mode ling the magnetic susceptibility.
1.4 Feature analysis
No matter how accurate the geophysical data inversions are, each inverted physical property mode! is on! y sensitive to a limited number of geological features. Therefore, different parts of the subsurface geology can be reconstructed from varions physical property models. The key question is how we can put together the interpreted jigsaw puzzles inside a high-dimensional space to rebuild a relevant geological mode!. This has led us to the topics of feature extraction and feature selection in the treatment of large data sets. In other word, the fundamental problem in integrated geophysical interpretation is the proper geological understanding of multiple inverted physical property images, which demands high dimensional techniques for extraction of geological information from modeled physical property images. Severa! methods are available for feature extraction in the high dimensional space, and this can be seen as a dimensionality increase problem (Murtaugh et al., 2000). The problem is that the increased dimensionality due to feature extraction leads to an overload of information that creates difficulties for human visual interpretation as weil as machine learning optimization (Murtaugh et al., 2000). That is to say, latent patterns are !ost in high space as we go to higher dimensions.
Spectral decomposing of geophysical images provide a way for feature extraction in the frequency domain (Sinha et al., 2005; Castagna and Sun, 2006). However, the underlying patterns inside the high dimensional images are just related to specifie frequencies, and sometimes most of the decomposed spectra are redundant. The question is that which frequency or frequency ranges are geologically relevant. This can be seen as a dimensionality reduction problem, in which one tries to extract the best representative components of high dimensional images to facilitate the visual interpretations and machine learning optimization. Feature subset selection (FSS) provides a powerful tool for intelligent dimensionality reduction and AI feature
learning (Liu and Motoda, 2012). FSS reduces the size of a large set of the input features to a new set of relatively small and representative input features that improve the accuracy of neural network prediction (Huang and Wang, 2006). Therefore, unlike conventional statistical dimensionality reduction methods that are blind source separation algorithms, there is a criterion for selection of the best features that can be expressed as optimization of the neural learning process, in the light of both neural weights and number of selected input features (Zhao and Liu, 2011 ).
Within the frame of this Ph.D. study, we present a spectral ICA algorithm for dimensionality reduction as weil as separation ofhigh dimensional spectral overlapped features. We also propose a method that automatically selects the best representative spectral components based on multi-objective machine learning optimization.
1. 5 Research outline
In this study, a systemic approach is used to understand the whole process of interpretation that links the underlying geological features (litho! ogy and alteration) to physical properties and measured signais on the surface. The integrated interpretation is presented in three stages:
• Integrated Modeling (Chapters II, III): responding to challenges related to 3D inverse modeling of multiple geophysical data and the interrelationship between physical properties and geological features;
• Feature extraction (Chapters IV): higher order statistical algorithms are applied for geological source separation;
• Spectral feature selection (Chapter V): a hybrid machine learning algorithm is provided for semi-automatic interpretation of multiple geophysical images.
3D COOPERATIVE INVERSIOJ:f OF MAGNETIC
.<\lm
DCIIP DA
TA
OVER
NEVITON EPrTHERMAL
Alk<\.G
DEPOSrT :!:tl BRITISH CdLUMBIA,
CAN:P.DA
B-<ihm an Abbassi,
Li
Zhetr Cheng, Jeremy
]jiRi :ch')tds, J uli ane Hübert, Jean lv.L
Legault, :Mark Reb,aglîatland
l:(:etr With:erlyl'imagerie 3D du gisement d'Au-Ag épithermal de Newton en Colombie-Britannique (Canada). Les données de résistivité électrique et de polarisation provoquée (PP) à courant continu (CC), et aéromagnétiques ont été inversées séparément pour récupérer des distributions de propriétés physiques 3D approximatives. Une inversion de vecteur d'aimantation (IV A) non contrainte a été utilisée pour modéliser la distribution 3D des vecteurs d'aimantation. Cependant, la profondeur des caractéristiques magnétiques dans le IV A était incertaine en raison de la non-spécificité inhérente de l'inversion non contrainte. Le modèle de résistivité à l'échelle du dépôt montre une zone modérément résistive avec une faible chargeabilité dans une large zone conductrice 1 chargeable NW -SE, confirmant l'hypothèse qu'une zone localisée de haute résistivité 1 faible chargeabilité est associée au processus de dévitrification et aux espaces poreux remplis de quartz, la zone riche en Au. Le succès de l'inversion PP 1 CC dans la localisation de cette zone riche en Au modérément résistive 1 faible chargeable a fourni une contrainte précieuse sur l'inversion magnétique sur l'échelle de dépôt, pour une meilleure localisation de la zone de faible susceptibilité associée à la minéralisation. Une inversion magnétique- PP 1 CC coopérative est utilisée pour affiner un modèle de susceptibilité géologiquement cohérent en incorporant des informations dérivées de l'inversion PP 1 CC. Nous avons remarqué que l'influence de l'inversion PP 1 CC sur l'inversion coopérative n'était pas uniforme sur le plan horizontal, ce qui nous a conduit à utiliser une pondération non uniforme de la contrainte de chargeabilité lors de l'inversion coopérative. La procédure a permis aux parties utiles de l'inversion PP 1 CC de participer à la reconstruction de la susceptibilité. Les évaluations à l'échelle du gisement montrent que le modèle de susceptibilité coopérative est compatible avec les informations géologiques et pétrophysiques antérieures. Le modèle magnétique récupéré montre une zone magnétique basse correspondant à des intrusions
porphyriques et des roches volcaniques felsiques (hôte d'Au) qui sont mises en place dans une large zone magnétique de forme ovale NW -SE liée à l'altération hydrothermale.
Newton epithermal Au-Ag deposit in British Columbia (Canada). Aeromagnetic, direct current (DC) electrical resistivity and induced polarization (IP) data were separately inverted to recover approximate 3D physical property distributions. An unconstrained magnetization vector inversion (MVI) was used to mode! the 3D distribution of magnetization vectors. However, the depth of the magnetic features in the MVI was uncertain due to the inherent non-uniqueness of the unconstrained inversion. The deposit-scale resistivity mode! showed a moderately resistive zone with low chargeability inside a broad NW -SE conductive/chargeable zone, which confirmed the hypothesis that a localized high resistivity/low chargeability zone is associated with devitrification process and pore spaces filled with quartz in the Au-rich zone. The success of DC/IP inversion in the localization of this moderately resistive/low chargeable Au-rich zone provided a valuable constraint on the magnetic inversion on deposit scale, for better localization of the low susceptibility zone associated with Au mineralization. A cooperative magnetic-DC/IP inversion is used to refine a geologically consistent susceptibility mode! by incorporating information derived from DC/IP inversion. W e noticed that the influence of the DC/IP inversion on the cooperative inversion was not uniform on the horizontal plane, and this led us to use a non-uniform weighting of the chargeability constraint during the cooperative inversion. The procedure allowed the useful parts of the DC/IP inversion to participate in the reconstruction of the susceptibility mode!. Evaluations at the deposit sc ale show that the cooperative susceptibility mode! is compatible with prior geological and petrophysical information. The recovered magnetic mode! shows a low magnetic zone corresponds to porphyritic intrusions and felsic volcanic rocks (host of Au), which is emplaced within a broad NW -SE oval-shape high magnetic zone related to the hydrothermal alteration.
2.1 Introduction
Multidisciplinary geoscientific data integration enables interpreters to better understand and identify physical processes within the Earth. The integrated interpretations provide a framework for reconciling rock physical properties with geological observation and helps interpreters explore the 3D interrelationship between existing geological features and the imaged physical properties of rocks (Le lièvre et al., 2009; Moorkamp et al., 2016).
Epithermal deposits precipitate by circulation of hydrothermal fluids and subsequent changes in their physicochemical conditions. The host rocks undergo varying degrees of overprints of hydrothermal alteration because the mineral assemblages in the wall rocks tend to geochemically re-equilibrate during the hydrothermal activity (Taylor, 2007, Pirajno, 2009). Hydrothermal fluids during replacement processes concentrate precious and base metals in pore spaces and structurally controlled fracture zones (Sillitoe and Hedenquist, 2003; Sillitoe 20 15).
Geophysical characteristics of several epithermal systems have been discussed in a handful of case studies (Allis, 1990; Irvine and Smith, 1990; Feebreyf et al., 1998; Murakarni, 2008; Morrell et al., 2011; Clark, 2014; Hübert et al., 2016; Legault et al., 2016). Many of the intrusive complexes responsible for hydrothermal mineralization are to sorne extent magnetized in contrast to the country rocks (Clark, 2014). Nevertheless, in epithermal systems, destructive magnetite alteration could produce low magnetic anomalies accompanied by mineralization (Pirajno, 2009; Clark, 2014). Magnetic surveys can usually identify this mineralization signature exhibiting as localized magnetic-lows surrounded by high magnetic zones (Allis, 1990; Irvine and Smith, 1990; Murakarni, 2008; Morrell et al., 2011).
Electrical resistivity-highs in the epithermal systems (locally exceeding 1000 Ohm-rn) are reported being associated with silicification, compaction, and felsic to intermediate intrusions (Allis, 1990). Low resistivities from sulfidation (3-30 Ohm-rn; Allis, 1990), which are most favorable to hydrothermal exploration, are often mixed with resistivity-lows of pore fluid and pervasive clay alteration (Nelson and Van Voorhis, 1983; Allis,
1990; Irvine and Smith, 1990). Strong IP chargeabilities due to the hydrothermal alteration are typically associated with the presence of sulfidation (Sumner, 1976; Allis, 1990). Nelson and Van Voorhis (1983) have shown that the polarization response in disseminated mineralization increases somewhat linearly with an elevation of sulfide contents up to 10 percent.
Geophysical inverse modeling is a valuable tool in geophysical interpretation because it produces physical property models that are used for imaging geological features in 3D (Oldenburg and Li, 1994; Li and Oldenburg, 1997, 2000; Loke et al., 2003; Le lièvre and Oldenburg, 2009; Loke, 2015). However, because of the inherent uncertainty of the geophysical inversion, the solution of the inverse problem may produce multiple 3D physical property models that are equally valid when there is no prior information about the underground. One way to solve this non-uniqueness problem is constraining the mode! with prior information from geological setting, borehole records, and other geophysical models. The latter can be addressed through cooperative inversion, in which information from one geophysical data set are used in the inversion of another dataset (Oldenburg et al., 1997; McMillan and Oldenburg, 2014; Moorkamp et al., 2016). Oldenburg et al. (1997) incorporated a cooperative strategyto constrain a DC/IP inversion with information from a standard susceptibility inversion from Mt. Milligan Cu-Au porphyry deposit. They followed the hypothesis of an anti-correlation between IP chargeabilities and magnetic susceptibilities and performed a cooperative DC/IP inversion with a proper weighting mode! that encourages the DC/IP inversion to place higher chargeabilities away from higher susceptibilities.
This study mms to characterize Newton epi thermal deposit by exploring the relationships between geological, petrophysical and multiple geophysical data-sets. A cooperative magnetic-DC/IP inversion is used to image 3D physical property distributions in the Newton area, to refine a consistent magnetic susceptibility model by information derived from DC/IP inversion.
The Newton deposit consists of dissemination of Au and Ag as inclusions in pyrite with variable amounts of Cu mineralization. The deposit is located in central British Columbia, Canada and is classified as an intermediate sulfidation epithermal deposit (Pressacco, 2012; McClenaghan, 2013; Liu et al., 2015). Explorations in the area have been conducted since the 1970s and comprise geological and geochemical observations and geophysical measurements (Pressacco, 2012). The most recent study (Hübert et al., 2016) has modeled regional electrical resistivity structure of the Newton deposit using magnetotelluric (MT) and airborne z-axis tipper electromagnetic (ZTEM) data. The area of hydrothermal mineralization exhibits a modest electrical response relative to the country rocks, mainly due to the presence of phyllosilicate minerals (seri cite) and min or disseminated sulfides (Hübert et al., 20 16). However, the ZTEM-MT resistivities do not possess the resolution of the deposit scale geological features (Hübert et al., 20 16).
In this study, multiple geophysical data sets are inverted on larger scales to localize the physical properties of the Newton Au-rich zone. At prospect scale, each geophysical data set is inverted individually to produce separate physical property models in 3D. The prospect scale modeling covers an area of highly altered rocks encompassing the Newton deposit and is accompanied by MVI and DC/IP inversion that retrieve the 3D magnetization vectors, electrical resistivities and IP chargeabilities of the hydrothermal zone. The cooperative magnetic-DC/IP inversion is performed on a deposit scale and has produced consistent physical property models that are evaluated
by geological and petrophysical observations. We show that the cooperative inversion uncovers hidden geological features inside the retrieved physical property models, without incorporating any prior borehole geological constraint.
2.2 Geological setting
Newton Au-Ag deposit is a Late Cretaceous (72.1 ± 0.3 Ma; McClenaghan, 2013) epithermal deposit in association with arc magmatism in the accreted Stikinia terrane of western Canada, along with several significant porphyry and epithermal deposits (McMillan et al., 1995; Nelson and Colpron, 2007), such as Capoose epithermal Au deposit, Blackwater epithermal Au-Ag deposit and Prosperity porphyry Cu-Au deposit (Figure 2.1).
*
Capoose epithermal Au deposit*
Newton epithermal Au-Ag depositÀ Blackwater epithermal Au-Ag deposit
e
Prosperity porphyry Cu-Au depositFigure 2.1 Several large porphyry and epithermal deposits located in Stikinia terrain (S T) in central British Columbia. Other terranes are: Alexander terrane (AX); Bridge River terrane (BR); Caribo terrane (CAC); Cache Creek terrane (CC); Cadwallader terrane (CD); Coast Complex terrane (CX); Harrison terrane (HA); Kootenay Terrane (KO); Monashee (MO); Cratonal North America terrane (NA); Nisling terrane (NI); Post Accretionary Plutons (PAP); Quesnellia terrane (QN); Shuksan terrane (SH); Slide Mountain Terrane (SM); Wrangellia (WR). Modified from Massey et al. (2005).
Regionally, the Late Cretaceous volcanic sequence is overlain by Miocene-Pliocene Chilcotin Group flood basalts, and Quaternary glacial deposits, which are variably eroded to expose the older rocks. In deposit scale, quaternary glacial tills cover most of the Newton property. Consequently, deposit scale geological information has primarily been obtained from borehole samples (Pressacco, 2012). A bedrock geology map of the property is compiled from the mapping of limited outcrops, drill cores and cross-section interpretations (Figure 2.2). Three layered volcano-sedimentary sequences overlain on each other from bottom to top are mafic volcanic rocks, sedimentary rocks and felsic volcanic rocks (72.1±0.6 Ma; McClenaghan, 2013). The layered rocks are intruded by felsic to intermediate porphyritic intrusions, including the monzonite (72.1±0.3 Ma; McClenaghan, 2013), quartz feldspar porphyry (QFP; 70.9±0.5 Ma; McClenaghan, 2013), feldspar biotite porphyry (FBP) and the younger dioritic intrusion (69.3±0.4 Ma; Liu et al., 2015).
Amarc Resources Ltd. acquired the property in 2009 and defined an estimated inferred mineral resource of 111.5 Mt with an average grade of0.44 g/t Au (cut-offat 0.25 g/t Au; Pressacco 2012). The epithermal mineralization associated with the Newton deposit is at a depth of ~50 rn to ~600 m. Au-Ag mineralization is characterized by quartz-sericite alteration, containing disseminated pyrite with Au inclusions in coeval porphyritic intrusive rocks. Au-Ag mineralization is associated with disseminated pyrite, marcasite, and base metal sulfides, and is mainly hosted within the felsic volcanic sequence (McClenaghan, 2013; Liu et al., 2015). The deposit is offset by the Newton Hill Fault (NHF), which displaces the geology and mineralization by ~300 rn of normal dip-slip movement.
-
E
~-.c en
~g:
0 L{)z
Lege nd
456
• Diorite intrusion (69.3 ± 0.4 Ma)
1 QFP 1 Rhyolite intrusion (70.9±0.5 Ma)
1 FBP J Rhyolite intrusion
457
East (km)
0
Monzonite intrusion (72.1±0.3 Ma)1 FVR 1 Laye red Felsic Volcanic Rocks (72.1 ±0.6 Ma)
IIR
J Layered Sedimentary Rocks• Layered Mafic Volcanic Rocks
458
Boreholes
[!]
Length (<100m)[!]
Length (100m-300m)[!]
Length (300m-700m)Symbols
IZJ
Newton Hill Fault (NHF) 0 1nferred FaultsFigure 2.2 Bedrock geology map at the deposit scale. Colored dots indicate drillhole locations with various totallengths (Pres sacco, 20 12; McClenaghan, 2013). The light gray parts are undefined regions due to the lack of borehole information in the periphery of the deposit. Contours indicate topography.
2.3 Physical properties
More than 9000 magnetic susceptibility readings are measured from core samples from 80 drill holes in the Newton Hill area. Measurements are done using KT-10 S/C meter of Terraplus h1c. and are supported by additional data provided by Amarc Resources Ltd. The retrieved statistics of magnetic susceptibilities of different lithologies are shown as a box plot in Figure 2.3. Felsic volcanic rocks (FVR) and porphyritic intrusions (QFP and M) show lowest magnetic susceptibilities (in average less than 0.0002 SI), and sedimentary rocks (SR) are slightly more magnetic (average 0.0005 SI). The high an1plitude susceptibility anomal y (more than 0.01 SI in average) is likely due to a blend of mafic volcanic rocks (MVR) with propylitic alteration and the later developed dioritic intrusion (D). Figure 2.4 shows horizontal slices from the borehole 3D models of susceptibilities and Au concentrations.
Plot Explanation
minimum median average
•
maximum 25th percenti le 75'h percentileMVRI~---:~==~========~·=1~~~
Dl • 1 SR~~---~~·-·~1---~FVR
. _ 1 _ _ _ _ _ _.__...__•..._1____.
QFP 1~ __ ___.___.1_•__.__, Ml 13
1 1 1Il,.
1 1 1Il"'
1 , , , , , , 1 1 , , , , , , 1 1 1Il"'
0.01 0.1 1 10Susceptibility (1
0-
3SI)
Figure 2.3 Boxplot demonstration of measured magnetic susceptibilities of different lithologies from the Newton deposit. Susceptibility axis is logarithmic. The lithologies with average susceptibility values are: monzonite (M, 0.00012 SI); quartz feldspar porphyry (QFP, 0.00012 SI); felsic volcanic rocks (FVR, 0.00017); sedimentary rocks (SR; 0.00017); diorite (D, 0.014 SI); mafic volcanic rocks (MVR, 0.009).
Ê ~ .s::: (j) t:: ~ 0 l() z co (") ~L---45~6---4 57 Ê ~ .s::: t:: 0 z 456 East (km) Susceptibility (1 Q-3 SI) - 1 1 0 5 15 50 Elevation = 1000 rn 457 East (km) Au (g/t) - 1 0 0.01 0 .05 0.14 458 Plan View 458
Figure 2.4 3D borehole models. (a) Borehole susceptibility modeL (b) Au concentration model (b ). Both mo dels are sliced horizontally at the elevation of 1000 m. Bedrock geology is overlaid on both models. Black dots indicate the location of boreholes.
There is a correlation between high concentrations of Au and low susceptibilities of the felsic volcanic rocks. The susceptibility of mafic volcanic rocks is amplified due to the precipitation of magnetite-bearing propylitic alteration. In the Au-rich zone, susceptibility-low of the felsic volcanic rocks also becomes weaker due to the further destructive magnetite alteration during the epithermal process. Therefore, the epi thermal alteration assemblages increase the susceptibility contrasts of rocks that can be imaged as sharp changes between two principal zones:
1. The high susceptibilities of the mafic volcanic rocks with propylitic assemblage ( chlorite-epidote-pyrite-calcite-albite-magnetite ), and the later dioritic intrusion in the northwest of Newton Hill.
2. The low susceptibilities of the felsic volcanic rocks with quartz-sericite alteration assemblage and Au enrichments.
The sericitic alteration associated with Au-Ag mineralization suggests the source magmatic fluids of mineralization were slightly acidic and likely caused devitrification of minerais, resulting in the formation of additional pore space for subsequent precipitation ofsericite and quartz in the zone ofmineralization (McClenaghan, 2013). Since the silicified zone accompanied by mineralization is resistant to weathering (McClenaghan, 2013); the pick of the topography over Newton Hill is an indirect sign of the devitrification. Devitrification (McClenaghan, 2013) can also be accompanied by a local reduction of chargeability and an elevation of resistivity near the mineralization zone, as weil as the low susceptibilities of the destructive magnetite alteration linked to the epithermal mineralization. We test this hypothesis in the interpretation of mode led physical properties.
2.4 Geophysical data
Geotech Ltd. has acquired the aeromagnetic data as a part of the combined magnetic and ZTEM survey, from January to February 2010 on behalf of Amarc Resources Ltd (Geotech Ltd., 2010). The ZTEM data-sets are described in Hübert et al. (2016). Total magnetic field data were measured from a helicopter flown at a mean height of 155 rn above ground. This allowed for a ZTEM sensor terrain clearance of 81 rn and a magnetic sensor clearance of98 rn (Geotech Ltd., 2010). The data were collected along N-S flight lines at 200 rn spacing and E-W tie lines flown every ~2000 rn to 500 rn (tighter spacing near the deposit). A total of 7071 line-km of data were collected and cover a 1293 km2 area. The magnetometer sarnpling rate was 0.1 second and depending on the speed of the helicopter results in approximately 10 rn measurement intervals along each profile. The magnetic anomalies are displayed in Figure 2.5.
A DC/IP survey of 85 line-km over Newton Hill area, using the pole-dipole electrode configuration was conducted in 2010 (Pressacco, 2012). The survey lines were spaced at 200 rn intervals in E- W directions within the zone of hydrothermal alteration. The unit electrode spacing (di pole length) was set to 100 rn and 200 rn, with maximum eight times di polar separations. The apparent chargeabilities were measured by recording the decaying voltage after the current eut-off in millivolt per volt (rn V IV). The measured apparent resistivities and chargeabilities are presented in Figures 2.6a and 2.6b, respectively.
a) E ~ .r: ~ 0 z CXl N f'-<0 447 454 461 East (km)
Total Field lntensity (nT)
Mî ) T j
56700 57000 57600
456 457
East (km)
Total Field lntensity (nT)
~ 1 1
55700 55900 56300
458
Figure 2.5 Magnetic data-sets. (a) Total magnetic field intensities on a regional scale. Data are draped on a shaded relief digital elevation model of the region. (b) Total magnetic field intensities on Newton deposit scale. Black lines outline the bedrock geology contacts.
a) 0 '>t
,.._
L!)-
E CT> ~ M ,.._ ~ L!) ~ 0z
co M ,.._ 1.() 455 455 456 n =4 rn 457 East (km) n = 4 m 456 457 East (km) 458 458 Plan View 400 200 100 80 60 40 20 459 (Ohm-rn) Plan View 459 80 60 40 20 10 8 6 2 1 0.8 (mV-V)Figure 2.6 DC/IP data-set. Plan m aps are showing the locations of DC/IP electrodes covering the halo of hydrothem1al alteration over the Newton area. (a) Measured apparent resistivities. (b) Measured apparent chargeabilities. Data are shown for the di polar length of 100 m and di polar separation of n = 4.
2.5 3D Magnetization vector inversion
The fundamental assumption in a conventional magnetic susceptibility inversion (Li 1
and Oldenburg, 1997) supposes that the remanent magnetization vector ( J Rem ) is negligible within rocks and the total magnetization cornes exclusive! y from the earth's
1 magnetic induction within rocks. In this case, the total magnetization vector Uraœ) is
1
equal to the inductive magnetization vector ( JI"d) and is parallel to the earth's magnetic
~
field vector ( H 0) direction. Therefore, the estimation of magnetic susceptibility (x)
of rocks gets simplified to a scalar form that can be rewritten as a function of (Lelièvre and Oldenburg, 2009):
(ILl)
However, the existence of remanent magnetization (usually in different directions than the present-day earth's magnetic field) may result in distorted total magnetization
1
depending on the spatial relationship of the inductive magnetization vector (JI"d) and 1
a remanent magnetization vector (J Rem) (Le lièvre and Oldenburg, 2009; Ellis et al., 2012). Therefore, the total magnetization vector is expressed as (Lelièvre and Oldenburg, 2009):
1 1 1
J Total
=
Jind +J Rem (II.2)We used magnetization vector inversion (MVI; Le lièvre and Oldenburg, 2009; Ellis et al., 2012) to extract a 3D mode! of the total susceptibility distribution in the Newton area. The cell dimensions of the MVI mode! are 110 rn (in X-direction), 80 rn (in Y-direction) and 20 rn (in Z-Y-direction)that comprise total112896 cells, covering a surface of 5660 rn by 3780 rn and down to ~2000 rn of depth in the deposit scale.
The MVI algorithm introduces both the amplitude and the magnetization vector direction as separate unknowns in a Tikhonov minimum gradient regularization (Le lièvre and Oldenburg, 2009; Ellis et al., 2012). The ratio of the amplitude of the inverted total magnetization vector, normalized by the Earth's geomagnetic field, yields the total susceptibility (Le lièvre and Oldenburg, 2009):
(II.3)
An Iterative Reweighting Inversion (IRI) method is also used in parallel to the MVI mode ling in this study (Portniaguine and Zhdanov, 2002; Geosoft Inc., 20 12). IRI takes the first iteration susceptibility (or magnetization vector) and uses it as an iterative reweighting constraint when running a new inversion. This process is iterated until a satisfactory mode! is achieved (Geosoft Inc., 2012). IRI tends to recover sharp magnetic variations, and its results are equivalent to Robust or Blocky Inversion in inverse modeling of DC/IP data (Claerbout, 1973; Loke et al., 2003).
The preliminary MVI results are shown in Figure 2. 7 for different rounds of reweighting. The recovered susceptibility mode! is converged to a stable solution at the fourth iteration (IRI4 in Figure 2.7d). As can be seen, the igneous rocks in the west of the NHF correspond to relative! y high susceptibilities with NW -SE trend and an inn er low susceptibility zone associated with mineralization. However, the low susceptibility zone is not localized as it was expected from prior geological and petrophysical information (Figure 2.4). This remark motivated us to establish a cooperative method to constrain the magnetic inversion with 3D DC/IP inversion results for more efficient imaging of the low susceptibility feature associated with Au mineralization.