DIFFUSION IN MINERALS by
Mead LeRoy Jensen B.S., University of Utah
(1948)
SUBMITTED IN PARTIAL FULFILLMENT OF THE REQUIREMENTS FOR THE DEGREE OF
DOCTOR OF PHILOSOPHY
at the
MASSACHUSETTS INSTITUTE OF TECHNOLOGY (1951)
Signature of Author ... .. ... .. .. . . ...
Department o Geology, May 1, 1951
Certified by...
-e Th-esi- Sup-ervisor
Chairman,. D .raduate o t 0Stude
DEPARTMENT OF GEOLOGY NEW HAVEN, CONNECTICUT
ERRATUR
1. Abstract I, 3rd ine 6rom bott, change (I - 2.6 10- to
2.6 - 10-~11)
2. p. 23, lower right corner of 'Plate.
Change "Oil Diffusion Pump" to "Diffusion Pump".
3. p. 28, line 20. Change "some solid inorganic com-" to "some solid organic com-".
4. p. 33, line 13. Change "slumps" to "sumps".
5. p. 71, line 20. Change "15 to 50 cal.
mole" to "15Kto 50 K cal./ mole".
Mead LeRoy e en
'L~~~C ?-At4~h4
ABSTRAC T
DIFFUSION IN MINERALS Mead LeRoy Jensen
Submitted for the degree of Doctor of Philosophy in the Department of Geology on May 11, 1951.
The thesis is an attempt to initiate laboratory investigation on the long-neglected subject of solid dif-fusion in minerals using radioactive nuclides. A funda-mental review of the subject is given. Experifunda-mental tech-niques and methods have been developed, the effect of a
dis-ordering transformation on diffusion rates has been deter-mined in the case of the mineral chalcocite, and
approxi-mate diffusion rates through a few minerals have been measured. The diffusion coefficients of copper in chalcocite
have been determined at temperatures above (D=1 x 10 cm2/sec. at 1270 C) and below (D=1.3 x 10/sec at 60 C) the
critical temperature of complete disorder of copper in this mineral* The activation energy of copper in high chalcocite has been determined to have a value of approximately 4,000 cal./ mole. Values have been obtained on the approximate diffusion
2 0
rates of copper in tetrahedrite (-'lor8
cm. /sec. at 182 C), in quartz (v 10-"10 cM.2/sec. at 600 C), and in cuprite con-taining blebs of chalcopyrite (~ 2 x 10⁻⁸)cm.2/sec. at 92 C). The investigation of the diffusion of sodium in perthite
(
D-2.6 x 10 cm. /sec. at 5500 C) has been accomplished and some geologic conclusions have been deduced from this ex-periment.DIFFUSION IN MINERALS Mead LeRoy Jensen
Submitted for the degree of Doctor of Philosophy in the Department of Geology on May 11, 1951.
There has been much disagreement upon the geologic and mineralogic importance of solid state diffusion. Many
contradictory hypotheses have been expressed by geologic au-thorities based upon their interpretation of field evidence. There have been, however, very few fundamental laboratory in-vestigations made upon this problem.
This thesis is an attempt to begin the laboratory investigation using radioactive nuclides of solid diffusion rates in minerals by developing experimental techniques, by determining the effect of disorder transformations on dif. fusion rates, and by measuring diffusion rates through some minerals. The diffusion coefficients of copper in chalco-cite haw been determined at temperatures above and below the critical temperature of complete disorder of copper in this mineral. The activation energy of copper in high chalcocite has also been determined. Approximate diffusion rates of copper in tetrahedrite, in quartz, and in cuprite containing unmixed chalcopyrite blebs have also been measured. The in-vestigation of the diffusion of sodium in perthite at a
tem-perature of 550 degrees centigrade has been accomplished and some important geologic conclusions have been deduced from this experiment.
TABLE OF CONTENTS
ABSTRACT . . . .
I ACKNOWLEDGEAENTS . . . . .
II INTRODUCTION . . . . . ..
III SCOPE AND PURPOSE OF WORK
IV GENERAL . . . .0 . . . 0 .0 . . 0 . 0 . 0 .0 . . . .0 . . . iv . . . 1 . . . 3 A. Mathematical Treatment .. . . .
B. Experimental Methods and Techniques
C. Effect of Temperature . . . . . .
D. Mechanism of Diffusion . .* * *
E. Driving Force for Diffusion . . . .
F. Effect of Impurities . . . * . . .
. .0 . .0
. .0
V EXPERIMENTAL RESULTS
A. Diffusion of Copper in Chalcocite . .
B. Diffusion of Sodium in Perthite . * . C. Diffusion of Copper in Various Minerals VI DISCuSSION OF RESULTS
A. Diffusion of Copper in Chalcocite
B. Diffusion of Sodium in Perthite
VII CONCLUSIONS . . . *
VIII APPENBIX
A. Derivation of Fick's First Law B. Derivation of Fick's Second Law C. Derivation of Dirfusion Equation . D. Biographical Note . . . . . IX BIBLIOGRAPHY .... . .. ... 4 10 31 40 45 47 50 51 58 .. . 69 . . . . 73 . . . . 78 . . . . 82 . . . . 84 0 . . . 86 . . . . 89 . . . . 90 Chapter Page
PLATE NUMBER PA GE NTP TER I . . . .* . . . 13 II . . . 18 III . . . 23 IV . . . 30 V . . . 32 VI . . . 39 VII . . . 43 VIII . . . 59 IX . . . . X . . . 61 XI . . . 62 XII . . . . . . . . 63 XIII . . . . . . . . * . . . 64 XIV . . . 65 XV . . . 66 XVI . . . 67 XVII . . . 68 XVIII . . . 81
LIST OF TABLES
Table Number Page Number
I. .. .. . . . . .. .. . 51 II.. . .. . . .. .52 - 54 III.. . .. . . 56 IV . . . 57 Y .. .. . .. .. . ... 55 LIST OF FIGURES
Figure Number Page Number
2 . .. . 34
3 . 0 0 0 0 0 . 36
I am indebted to both the Massachusetts Insti-tute of Technology and the late William S. Knudsen for financial aid provided during the past academic year by means of the William S. Knudsen Fellowship.
This thesis could not have been attempted without the materials, instruments, and equipment made available by the Departments of Geology, Metallurgy, Ceramics, and Phys-ics, the Radiological Safety Laboratory, Professor H. W.
Fairbairn, Mr. Joel Buckley, Mr. John Solo, and W. Z. Leavitt. I am especially grateful to Professor Fairbairn who not only most cheerfully made available all of his instru-ments and equipment but also provided space in which to per-form portions of the experimental work of this thesis.
I wish to thank Dr. Carl Wagner for aid provided during many stimulating discussions on the subject of dif-fusion.
Finally, but primarily, I am indebted to my thesis supervisor, Professor M. J. Buerger, who first kindled my interest in the subject of mobility of ions in solids. Pro-fessor Buerger not only supplied invaluable aid in discussion and solution of theoretical and practical problems but was also a great morale builder during critical times of nothing but discouraging results.
II INTRODUCTION
Diffusion of ions and atoms in, through, and around minerals and rocks has been a subject of much con-troversy and speculation during the past half century. The geclogic importance of diffusion has received varying de-grees of acclaim and censure; for example, it has been ac-credited with the formation of all,1 fifteen percent, some,3 and none4 of the granitic masses.
The geologic literature contains many discourses on the "proof" of diffusion over great distances from field interpretations. In fact, an interesting symposium has been held, due to the controversy created by the subject, where noted authorities further aired their opinions on this enig-matic problem.5 The extreme lack of laboratory investiga-tions on diffusion rates in minerals, nevertheless, is ap-palling.
An attempt was made in 19156 to begin quantitative experimental work on solid diffusion in minerals. Even with this early start, the laboratory work has been neglected while the metallurgical literature of the past fifteen years abounds with experimental information on solid diffusion in
the degenerate crystallographic case of metals. 7 It is
in-teresting to note that the International Critical Tables give the diffusion coefficient of only one silicate, Natrolite, a zeolite which is listed as having a diffusion coefficient of
x /sec. at 20 degrees centigrade.
A unique laboratory experiment was performed in 1921,9 which seemed to -indicate that the rate of diffusion of magnesium andecalcium ions into plagioclase glasses was about 3.5 x 10 6cm. 2/sec. at the high temperature of 1500 degrees centigrade.
Recently, more and more experimental diffusion results in minerals have been appearing in the geologic literature.10 The laboratory work, however, is still in its infancy, if not still in the prenatal stage. There is no doubt, however, that the seed of laboratory investiga-tion has been planted.
III SCOPE AND PURPOSE OF WORK
It is the attempt of this thesis to begin the quantitative investigation of diffusion rates in minerals by the development of experimental techniques, to study the effect of structural and disordering transformations on dif-. fusion rates, and to perform some experiments with the de-veloped techniques on some interesting minerals.
The thesis is limited to true solid state dif-fusion and no attempt has been made to study the further effect upon diffusion rates by introducing other factors such as pressure, obvious fractures in the specimens, and by using water saturated samples. Whenever possible, single crystals have always been used and crystals containing ob-vious flaws and fractures have been rejected. Important factors, howeve-r, such as lineage structure and impurities could hardly be avoided. There is no doubt that these fac-tors and many more will noticeably effect diffusion coef-ficients and it is the author's desire to investigate these
A. Mathematical Treatment
Diffusion may be defined as the process by which, under the influence of a concentration gradient and/or a chemical potential gradient, atoms or ions move from one position to another. When the phase is a gas, a liquid, or a solid, the diffusion process is more closely defined by the modifying adjectives gaseous, liquid, or solid, re-spectively.
The rate of migration of atoms through a phase may be treated rationally by equations based on Fick's
First and Second Laws. According to Fick's First Law the amount of material (dm) per unit time (dt) which diffuses in a direction (+x) is proportional to the cross-sectional area (A) through which it passes and to a driving force or concentration gradient That is:
d CA( (1)
A proportionality constant D, is introduced giving:
dm c
t~ -D * A ()
=
-D-A-gwhere dM is the rate of transfer of solute. dt
D is the diffusivity or diffusion constant. A more rigorous derivation of this equation is given in
and g = - -- is the concentration gradient.
The following units are most commonly used: mols M= grms. atoms t= seconds A=cm.2 x- cm. moles/cm.3 g= grms./cm.3
atoms/cm.
3In order that the units should agree in the equation, D must be expressed in units of cm.2/sec. The
diffusion coefficient, therefore, is the amount of solute per unit time which diffuses through a unit cross-section under a unit concentration gradient. D values obtained from
the study of diffusion in metals vary from about 10-5 cm./sec.* to values less than 10-1 5cm.2/sec. at given temperatures
ranging from a few hundred degrees to over 1500 degrees centi-grade. A diffusion coefficient of 10-6cm.2/sec. for a
speci-fic solute in a s olvent means that one gram of the solute dif-fuses through an area of one square centimeter of the solvent in one million seconds.
Fick's Second Law shows the time rate of change with concentration and the distance rate of change with con-centration. It is usually written as follows:
D where D # f(c) (3)
c
(D
)
where D=
f(c)
(4)
It has been found that the diffusion coefficient may actually vary from one position to another in a given
substance depending upon the concentration of solute at the position. In other words, the diffusion "constant" of a solute in a solvent is a function of the solute con-centration. Unfortunately, the diffusion equations which have been used in the past and which are still being used
(with one exception known as the Matano Analysis12) were derived with the assumption that D # f(c). This is not as serious as it first appears, since in many experiments the change in concentration is extremely small and the corre-sponding change in the diffusion coefficient is usually over-shadowed by experimental errors. It is possible, further-more, to determine from a series of experiments when the
results obtained are in error due to diffusion being a func-tion of concentrafunc-tion.
Diffusion equations are very similar to heat flow equations with the constants in each being the diffusion co-efficient and the coco-efficient of thermal conductivity re-spectively. For this reason diffusion equations have stemmed
7. from heat flow equations, and textsl3 on this subject are prime sources for diffusion equations with variable boundary conditions.
The equation used for the experiments done for this thesis will be the only diffusion equation dealt with in any detail. Several texts and many papers7al4 are good
sources for the mathematical treatment of other diffusion equations with given boundary conditions.
The mathematical treatment used in this thesis was first applied to diffusion studies by W. A. Johnson1 5 in his study of the self diffusion of silver. I know of no published derivation of this equation, therefore, the deri-vation is given in Appendix C. The equation is:
ex co a e X (5)
where, c = the concentration at a distance x from the interface
c= the initial concentration
a = thickness of solute layer
x the distance from the solute film t time of diffusion
D diffusion coefficient
It should be noted from the derivation that the equation is based upon Fick's Second Law, equation (3), with
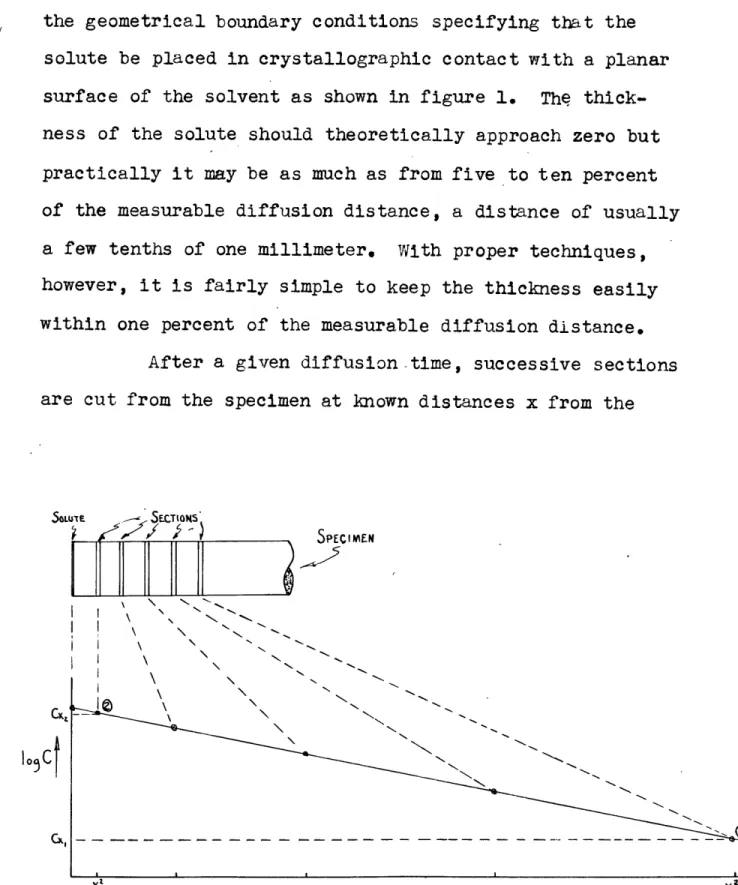
solute be placed in crystallographic contact with a planar surface of the solvent as shown in figure 1. The thick-ness of the solute should theoretically approach zero but practically it may be as much as from five to ten percent of the measurable diffusion distance, a distance of usually a few tenths of one millimeter. With proper techniques, however, it is fairly simple to keep the thickness easily within one percent of the measurable diffusion distance.
After a given diffusion-time, successive sections are cut from the specimen at known distances x from the
ol~urE SPECTECIMS
O,
-10 I N N
9. solute film and the concentration of the solute is deter-mined in each section. This data is plotted on semi-loga-rithmic paper with the concentration plotted logasemi-loga-rithmically versus the distance squared. The purpose in doing this will become obvious after the following considerations. The
equa-tions for the concentration of two secequa-tions located at a dis-tance x2 and x, from the solute layer are:
For section 2, ln c = ln co-a x (6)
2
Vib~t
4Dt
For section 3, ln cx = ln c t 4Dt (7)
The difference is: ln(cx, - cx) X2 +x
1 D 2
Therefore, - lo l
o
c
x X)2tO -2.Z08 (8)or, 0.1086 _ og(c X cxi) X 2 "0 l
Notice that the right side of equation (8) is the slope of the line as shown on the previous page. If the experimentally determined points give a straight line, the slope my be de-termined graphically and the diffusion coefficient will be given by the equation:
D =- 0.1086 (9)
If the time of diffusion (t) is measured in seconds and the distances (x) are measured in centimeters, the diffusion coefficient has the dimensions of cm.2/sec.
If the slope is not a straight line, experimental errors being neglected, the diffusion coefficient is not a
constant and it varies with concentration. (It should be
remembered that equation (5) was derived from equation (3) where D # f(c).)
B. Experimental Methods and Techniques.
In order to perform diffusion experiments it is necessary that the solute or diffusing ions be placed in a position where they may readily begin diffusing through, or exchanging position, with the solvent. This requires that the solute and solvent atoms be within "atomic reach" of each other; i.e., not separated by a gap of the order of more than a few angstroms. This can be accomplished by many different methods but each method has its limitations which become fairly obvious when any given solute and sol-vent pair are considered. The following is an outline of
several successful methods which have been used in the study of diffusion; it also includes modification of ex.-isting techniques, development of new methods, and sugges-tions of other techniques.
Welding is one of the more common methods used when both the solute and solvent material are metals. It has been used in the study of solid diffusion rates of cadmium, indium, tin, antimany, and copper into silver;16
11. nickel into gold, and many others.15 This method merely requires that the two metals be joined together over the entire area of a planar surface by a good weld.
Another common method used when the substance under investigation are conductors is electroplating. This has an
advantage over the welding technique in that a very thin film of solute atoms may 'e electroplated on a planar sur-face of the solvent material. It has been used in the study
of diffusion of nickel into copper, copper into copper alloys,19 and the study of self diffusion of silver using radioactive silver.1 5
An electroplating technique was developed in this thesis during the investigation of the diffusion rates of copper into minerals of the semi-conductor type. Since radioactive copper was used, the experiments had to be made in such a way that radiation hazards were minimized. It was also desirable that the process should be observable. This was arranged by using the technique shown on Plate 1. Since Cu64 is almost entirely a beta emmitter of 0.571 an 0.657 Mev energies, the particles were easily stopped by approximately one millimeter of pyrex glass. The water jacket increased the shielding much more than necessary and it also provided an easy means of measuring the temperature of the electroplating solution without placing a thermometer in the active solution. The copper made a much better coating when the electroplating solution had a temperature of about 35 degrees centigrade.
The radioactive copper was obtained in the form of copper foil. In order to obtain a dilute solution of copper sulphate, the foil was dissolved in 2N H2S04. Since copper
is only moderately soluble in hot H2SO4, a few cc's of
hy-drogen peroxide were added to the solution. This rapidly oxidized the copper which then reacted with the acid very easily and at a temperature as low as 40 degrees centigrade. Preparation of the solution was carried out under the chemi-can hoods in the Cyclotron Building, Massachusetts Institute of Technology.
The electroplating solution had the following coom-positioh:
0.5 grms. Cu foil 25 cc's 2N "2S04
10 cc's 02
This solution was heated at a few.degrees below its boiling temperature for several minutes after all of the cepper had been dissolved in order to remove any excess H-202*
The solution was then poured into the electroplating cell where the copper wire anode was already in place. The water
jacket was heated to 25 degrees centigrade and the specimen was lowered into the cell. The planar end surface of the specimen had previously been thoroughly cleaned, washed in cleansing alcohol and distilled water, and held so that no finger print$ were left on the cleansed surface. The cylin-drical surface was covered with scotch tape which prevented deposition on that surface.
HOT PLATE ,
.04 DIA. COPPER WIRE
E it COPPER REV SPECIMEN SPECIMEN SWITCH2 WIRING DIAGRAM
EXPERIMENTAL SETUP FOR ELECTROPLATING TECHNIQUE
ERSINGThe electroplatting required from twenty to thirty minutes with a current density of 200 milliamperes/in.2 be-fore a thin adherent coating was obtained. The current di-rection was reversed for a few seconds each minute during the first 10 minutes of electroplating.
A method of rolling or drawing can be used in the case of malleable metals. This technique can be used in the study of diffusion of magnesium and silicon from an aluainum alloy into pure aluminum.20 This was done by rolling the aluminum onto both sides of the alloy, but only after the surfaces had been thoroughly cleansed. This method was used in order to prevent initial diffusion which would occur during casting of the alloy against the aluminum. It is possible, however, that the cold work induced by the rolling could cause more rapid diffusion and, thereby, increase the true coefficient of diffusion.
It is very obvious that none of the above methods is applicable to the study of diffusion in ionic crystals or minerals; however, there are several methods whereby a metal or an ionic substance may be caused to adhere to another
ionic material. One of the most obvious methods, and one which may become as useful with ionic minerals as welding and electroplating have proven with metals, is by using a glaze. The ceramists have made noted contributions on determining the physical and chemical properties of glazes of different com-positions; however, their object was to develop a glaze which would react favorably with the body to wnich it was being
15.
applied in order to form a good adherent coating which would not spall nor craze.2 1 This inter-reaction of the glaze and body must be avoided if the technique is to be used for the
study of diffusion. In other words, a glaze which is used for diffusion studies must not only adhere to an applied sur-face but there must be as little initial diffusion or reaction between the body and the glaze as possible.
This is not too difficult to obtain. If diffusion studies are being investigated at temperatures of one-hundred or more degrees below the melting temperature of the crystal, a suitable substance can usually be chosen for the glaze
which has a melting temperature slightly above the tempera-ture region being studied. After the raw glaze has been al-lowed to dry on the crystal, it is placed in a furnace, which has already been heated to a temperature about 20 degrees above the fusing temperature of the glaze. If the specimen is removed from the furnace within one minute after the glaze fuses, there will normally be little reaction between the crystal and the glaze. This can and should be ascertained by removing thin sections from the specimen shortly after firing
the glaze.-and, thereby, measure the extent of initial diffusion due to the glazing process. If the initial diffusion during the glazing is negligible, other specimens prepared in the same manner can be used for diffusion determinations at tem-peratures below the fusion temperature of the glaze.
16.
crystal and the glaze are in the solid state) are to be made in the region just below the melting temperature of the crystal, it becomes more difficult to select a suitable glaze which will fuse just below the fusing temperature of
the crystal and will not react appreciably with the crystal which is, itself, almost ready to melt. This requirement
can usually be met if the glaze and the body are essentially of the same composition, the only difference being that a small amount of flux is added to the glaze. The glaze ma-terial should be finely ground so that it will tend to fuse at a temperature as far below that of the crystal as possi-ble. It is then thoroughly mixed with enough water to form a thin slip. A thin film of the slip is then applied to the
chosen planar surface of the crystal under investigation, but only after the crystal face has been thoroughly cleaned and, if possible, treated in a dilute acid solution in order
to remove any scum or oil from the surface. The thickness of the coating should be as thin as possible and this can be controlled by the amount of water dilution of the slip,
since the surface tension between the slip and the crystal allows only so much slip solution to be applied before run-ning over the side of the crystal. After the slip on the prepared specimen has been allowed to dry at a temperature of 110 degrees centigrade, it is rapidly placed in a furnace which is controlled at the desired temperature; it is removed within one or two minutes after the glaze fuses. It should
17.
not be removed as soon as the glaze melts since it requires a short time for the air bubbles to migrate to the surface
of the glaze and escape.
The above method was successfully used on several one-cubic-centimeter and smaller specimens of cleavlandite and microperthite. In the case of cleavlandite, the glaze slip was made from ground cleavlandite from the same speci-men. The glaze had the following composition:
2.0 grms of cleavlandite 0.3 grms. of Na
2CO3
This was thoroughly ground in a mortar and pestle and then mixed with 3 cc Is of water and applied to the crystal. The glazing was done on different specimens at temperatures of approximately 1080, 1090, 1100, 1110, and 1120 degrees cen-tigrade. A suitable glaze was formed only at the latter two temperatures. The specimens fired at the lower three tem. peratures remained in the furnace for five minutes and in each case there resulted only a surface fusion of the glaze.
The specimens fired at the latter two temperatures remained in the furnace for eight minutes. Plate II is a photomicro-. graph of a thin section cut normal to the glazed surface of one specimen wnich was fired at 111C degrees centigrade for eight minutes. There is no apparent reaction between the glaze and the crystal and it is of interest to note that
this specimen was fired in a carbon arc furnace at a tempera-. ture about ten degrees above the crystals melting temperature. It is not known if the crystal itself reacned the fusing
tem-polarized light
Crossed nicols
Thin-section of Uicroperthite
with adherent glaze coating. (X50) Plate II
-~ I
-19.
perature since it remained in the furnaice for only eight minutes. It is well-known, however, that fused potash and
soda feldspar are extremely viscous due to their high silica content, and possibly, this may preserve their crystalline
structure if they are heated to a temperature a few degrees above their fusing temperature for a short time and then al-lowed to cool. This hypothesis is worthy of investigation.
It is obvious that the crystal in the photograph never fused while the glaze is definitely in the glassy state.
The author planned to have the sodium in the
crushed cleavlandite activated by slow neutrons, forming the Na24 isotope, which would then be used as the glaze material and applied to a crystal of cleavlandite. The diffusion co-efficient could then be determined at a temperature only a few degrees below the fusing temperature of the crystal. This plan did not materialize due to the lack of a suitable furnace and the insufficient activity provided by thermal neutrons at the Massachusetts Institute of Technology cyclo-tron.
Rosenqvist1Ob has used a glaze process in his study of the rates of solid diffusion of radium and lead (RaD) through feldspar crystals. He merely mixed his active nu-clide with crushed window glass, fritted and recrushed it several times, and applied a drop of the viscous material to each feldspar crystal. Since he applied only a point source
used when a thin film of solute atoms is applied to the sol-vent crystal.
A preliminary investigation of diffusion rates of sodium into quartz and feldspars was accomplished in this thesis by use of the following glaze technique: Three cubic centimeters of radioactive sodium (Na22 ) were obtained in the form of a solution of Na$N03. The specific activity of
the solution was more than enough to allow over ten parts of either Na2CO3 or NaCl to be added to one part of the
solu-tion. When this had been done, a drop or two of the prepared solution was then spread over the flat clean end of a cylin-drical specimen, of 0.271 inch diameter, which had been dril-led from a suitable crystal. The water was allowed to evapo-rate leaving a fine white coating of crystals which, in the
case of both solutions, was fused to form a glaze at a tem-perature of 800 degrees centigrade. The diffusion runs were done at temperatures from 550 to 700 degrees centigrade. Up-on visual inspectiUp-on, the glaze cUp-ontaining the NaCl appeared to form the better coating; however, for some unknown reason, more successful experimental results were obtained from the specimens prepared from the Na2CO3 glaze. The activity of the
thin glaze coatings on the 0.271 inch diameter specimens
varied from ten to twenty microrutherfords when measured at a distance of one-half inch from a thin mica window
Geiger-Yueller tube. Each specimen was enclosed in 0.5 inch diameter hard glass tubing capsules during the diffusion runs to
pre-21. vent escape of radioactive sodium into the atmosphere by vaporization.
It was further observed, during the above experi-ments, that the soluble NaCl glaze could be removed after glazing by immersing and agitating the active end of the
specimen in a beaker of hot water. This was repeated several times until no further glaze could be detected on the sur-face; it was then found that an activity of about one-tenth the glaze activity could be measured. This was due to an in-itial diffusion or ion exchange mechanism which took place during the glazing process. Upon sectioning the specimen it was further found that the penetration of active ions was
negligible compared to the penetration obtained after approxi-mately 24 hours of diffusion at temperatures of 500 degrees centigrade and higher.
Ion exchange techniques, whereby an active isotope exchanges position with a stable isotope of the same element located on the surface of the solvent crystal, should prove to be a suitable technique for diffusion studies. It has been found that active lead and sulphur nuclides will rapidly exchange with the same ions respectively of a tarnished sur-face of galena, while there is very little exchange with an untarnished surface.2 2 The same investigator found that radioactive calcium and phosphorus films could be formed on
the surface of the mineral apatite by an ion-exchange mechanism. It is well known that delicate optical mirrors can be m.de by evaporating aluminum or silver on to glass. With
this knowledge, a method was developed whereby thin coatings of copper could be applied to metals, semi-conductors, and ion-ic minerals,. A perspective drawing of this technique is
shown on Plate III. It consists essentially of an evacuated chamber containing a tungsten filament and a support for the specimen to be coated. Thin strips or copper foil, contain-ing radioactive copper (Cu 64), are hung over the filament. The tube is evacuated and the filament is heated by increas-ing the current through the filament by means of a variac until the copper strips melt and the bright globules of
mol-ten copper adhere to the filament by surface mol-tension.* At this stage the copper evaporates rapidly. The process de-pends upon obtaining a suitable vacuum which will increase
the free mean path of the copper atoms tu-a distance greater than the distance from the filament to the specimen. This requires a vacuum pressure of the order of a few microns of mercury or less.
An improvement of the evaporating method described above is a technique known as sputtering. It differs from the former method in that a high potential, varying 'from 1,000 to 20,000 volts, is applied between the filament ana the plate or surrace to be coated.
It seems possible that diffusion studies could be
A molybdenum wire was used as the filament when evapo-rating copper since the surface tension between molybdenum and molten copper is greater than that between tungsten and molten copper.
38 x 200 M.M. TEST TUBE
- SPECIMEN
SPECIMEN
SUPPORT RODS HOLDER
FILAMENT (MOLY. WIRE - 0.015" DIA.)
COPPER WIRE FILAMENT LEADS MICA INSULATOR SHIELD Eg E a
WIRING
6 RUBBER STOPPERLi
I5v
DIAGRAM
VACUUM-EXPERIMENTAL
SETUP FOR EVAPORATING
TECHNIQUE
PLATE
III
F
carried out on minerals which occur naturally with a vari-able ion concentration; e. g., zoned crystals or minerals which show the phenomenon of unmixing or exsolution. If the concentration of an ion in a zoned crystal was detsr-mined at several points in a plane normal to the zoned bands and the change in concentration was again determined
after a diffusion time at a given temperature, the change in concentration would give a concentration variation curve which would lead to a diffusion coefficient. Indeed, it
has already been found by several investigators2 3 that struc-turel homogeniety occurs in some perthitic intergrowths when heated in the region of 700 to over 800 degrees centigrade.
The second important aspect of the experimental techniques used in the study of solid diffusion ratew is the method of determining the concentration gradient of the solute in the solvent.
There are numerous methods used in determining the concentration of solute atoms at a known distance from the solute-solvent interface. The method of measurement used de-pends upon several factors, such as the physical properties of the solvent, e. g., metallic or brittle, radioactive or
stable nuclides, and other factors which make it possible to quantitatively determine the amount of solute present per unit volume of solvent. The following is an outline of sev-eral methods of concentration measurement.
One of the most obvious methods is visual investi-gation with the aid of a microscope. If the solvent is
non-250 opaque, the index of refraction of the solvent will vary in proportion to the concentration of solute atoms present.24,9 If the solvent is opaque, it may be investigated metallo-graphic ally.25
A test based on the variation of microhardness with concentration of solute present has been used in the study of diffusion of copper, magnesium, manganese, and sili.
26
con into aluminum, and surprisingly enough, it is fairly accurate. For example, in the study of diffusion of copper into aluminum, the microhardness varied from about 25 to 90 kgs./mm.2 over a distance of about 400 microns.
One of the most common methods used is to deter-mine the concentration of solute in given sections by cnemi-cal analyses or metallurgicnemi-cal assaying of each section. If the solvent is a metal, thin slices may be cut using a metal lathe, or preferrably, a jeweler's lathe. The cuttings are collected from each slice or section and chemically analyzed. This method was used by Rhines and Mehl 9 during their study
of diffusion of copper into copper alloys.
The sections may be analyzed for the amount of solute using the spectrograph. This has been done by Seith
16
and Peretti on the investigation of diffusion rates of cadmium, indium, tin, antimony, and copper into silver.
Quantitative measurements of the concentration of solute in a section cut from the solvent have been made by means of X-ray investigation.17 This method is based on the
premise that the lattice parameter of a substance X varies with almost a straight line relation when plotted versus the atomic fraction of substance Y present. Data can be obtained27 which seem to show that in the case of two ma-terials with the same structure, their lattice parameter varies essentially as a straight line when plotted versus the atomic percent of the two materials present in the mu-* tually soluble structure.
The investigation of the self diffusion of any element can only be studied by the use of nuclides or isoi-topes of that element. This, in itself, is not truly self-* diffusion since the nuclides of a given element differ in properties such as mass and the number of particles in their nucleus. The approximation, however, is very close, except for the nuclides of the first few light elements of the a-tomic table; for example, deuterium (H2) weighs twice as
much as the Hl nuclide.
A mass spectrometer may be used to determine the respective concentrations of nuclides in a sample. The use of this instrument, needless to say, is not limited to
studies in self-diffusion; in fact, it has been used in the investigation of diffusion of stable isotopes of nickel into
18
copper.1
The availability of radioactive nuclides has been one of the greatest stimulants to the study of diffusion. The first application of radioactive nuclides in the study
27. of diffusion was accomplished over 30 years ago.28 This was an investigation on the rate of diffusion of radio-genic lead into common lead at a temperature of 340 degrees centigrade; the lead was fused. This was followed by the determination of the diffusion rate of lead in the solid state.2 9 Of course, only naturally occurring radiogenic nuclides were used at that time but since the discovery or artificial tracers, about seventeen years ago, many investi-gations on the subject of diffusion, self diffusion in
par-30
ticular, have been made.
There are essentially two methods of measuring the concentration of radioactive solute atoms which have dif~ fused into a solvent. The first is known as the sectioning method, whereby sections are cut from the specimen and the activity of each section is determined by measuring the ra-diation given off by each sample. The second method is re-ferred to as the surface decrease method. The activity of a thin film of radioactive solute atoms, in contact with the solvent, is measured before and after a diffusion period. The decrease in activity, neglecting decay factors, is pro-portional to the concentration of active atoms which have diffused into the solvent. A calibration curve of the loga-rithm of activity of solute material versus the mg./cm.2 of
solvent needed in order to decrease the activity a given amount is required before this method can be used.31 Dif-fusion results based on the surface decrease method have not proven to be as accurate as the sectioning method. A recent
A
28.
investigation3 2 of the self diffusion of iron, however, has
shown that this need not be true if
sufficient precautions
are taken.
The sectioning method was used entirely in the investigations made for this thesis. The sectioning pro-cess requires special care and techniques not only because of the "hot" atoms present but also because of the require-ment of accurately determining the distance of each section from the solute-solvent interface. Since the sections vary from less than 0.001 inch to a few one-thousands of an inch
in thickness, extreme care must be exercised in measuring the width of each section removed. When using a metal lathe or micrometer calipers, one must estimate to the nearest 0.0001 inch which limits results to two significant figures, which is poor. When a jeweler's lathe is employed, the ac-curacy becomes much better.
Sectioning by means of a lathe is limited to ma-terials which can be cut without chipping, breaking, or fracturing. This limits the method to most metals and al-loys, a few semi-conductors, and some solid ',organic com-pounds; e.g., lucite. It is, however, a property lacking in practically all silicates and many other ionic minerals, especially if they have pronounced cleavage directions.
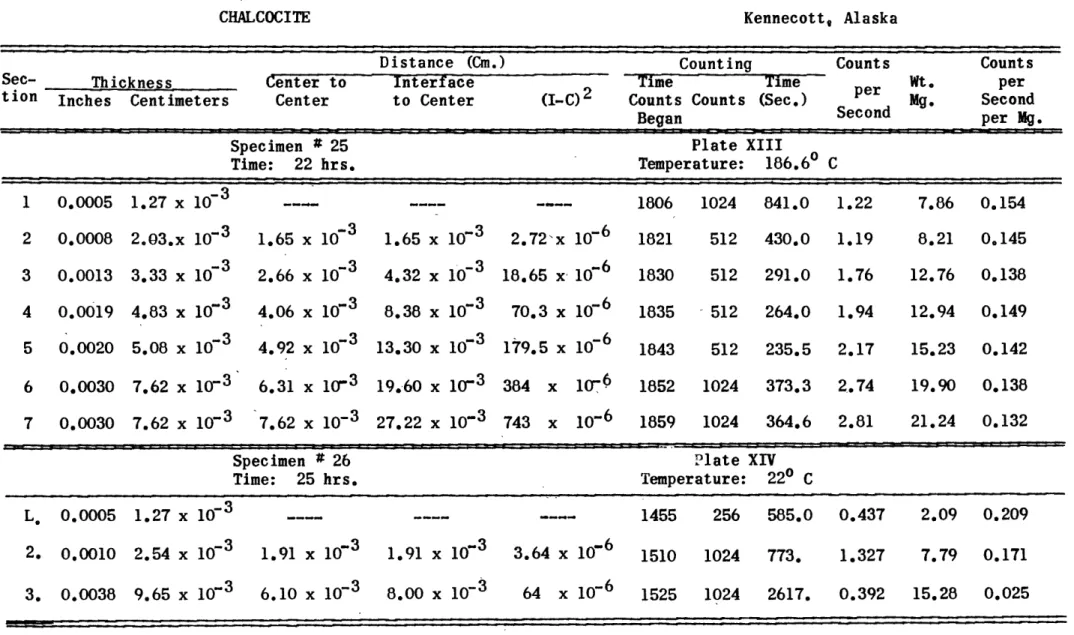
Chalcocite can be sectioned fairly well by means of a metal lathe if certain precautions are heeded. The technique developed for this thesis was as follows: Cylin-drical specimens, of 0.371 inch diameter and about 0.75 inch
long, were cut from select specimens of massive chalcocite. A brass collar was prepared which would clasp the specimen firmly when tightened in the lathe chuck. This binding
about the chalcocite prevented it from chipping when the lathe tool was removing material near the edge of the chal-cocite. Each section of material removed was caught on waxed paper and gently brushed into special counting re-ceptacles. It was found that the fine particles did not cling to this paper while a trace of the material always seemed to adhere to other papers. The width of the section removed was recorded from the lathe micrometer and the weight of the section was determined after the counting had been ac-complished. A generalized flow sheet of the technique used is shown on plate IV.
In the case of the minerals such as quartz, per. thite, and feldspar, which could not be sectioned using a lathe, another technique was developed. Square disks, one inch in width, were cut from size 1 emory paper. These were pressed into special capsules which were also used as
con-tainers of active material during the counting stage. The mineral to be sectioned was then mounted in a drill press and a small amount of material, approximately one milligram, was ground from the revolving specimen when it was brought into contact with the emory paper. A brass collar fitted about the brittle specimen prevented the lathe chuck from crushing the specimen. The remainder of the specimen was then weighed
SCOTCH TAPE
Fl
SRASS COLLAR (TO PREVENT CHIPPINGLATHE OF CHALCOCITE) CHUCK CUTTING TOOL WEIGHING EVAPORATING COPPER FILM ON G-M TUBE SPECIMEN COUNTING
FLOW
SHEET
COMPUTINGINVESTIGATION
FOR
CHALCOCITE
al.
and the thickness of the section determined by measuring the decrease in length using microcalipers. Since the width of each section removed was of the order of a few
thousands of a millimeter and the micrometer was calibrated to read to 0.01 millimeter, it was found to be much more ac-curate to plot concentration versus the weight of a section instead of versus thickness. The total thickness of material removed was, however, recorded. A generalized flow sheet of this technique is given on plate V.
During the grinding process, many of the silicates may give off extremely fine powder, which undoubtedly con-tains some active atoms that may be easily inhaled. To elimi-nate this hazard, the base of the capsule is covered with ap-proximately 0.4 cc's of alcohol. This prevents dust from rising during the grinding and the alcohol evaporates soon after the sectioning has been completed.
C. The Effect of Temperature
The importance of temperature in mineralogy as a source of energy has already been pointed out by Professor
33
Buerger. Its effect on diffusion rates is of extreme in. terest, not only because of the rapid increase of diffusion of ions with increase in temperature, but also because of the effect on diffusion rates of first and second order trans-formations wuiicn are also functions or temperature.
--a*- REPEAT IN ORDER TO BRASS COLLAR GLAZE SLIP APPLIED TO SPECIMEN OBTAIN SEVERAL SECTIONS -. SPECIMEN EMORY PAPER IN BASE OF CAPSULE
(COVERED WITH A FEW
CC'S OF ALCOHOL)
FLOW
SHEET
REWEIGHING OF SPECIEN (DIFFERENCE IN TWOI7
WEIGHINGS IS
WEIGHT OF SECTION . REMOVED)FOR
INVESTIGATION
OF
G-M TUBESILICATE
MINERALS
COMPUTING330 is that it tends to oscillate about its equilibrium
posi-tion with a frequency which is determined by its mass and the bond strength between neighboring atoms. When the atom receives energy, as in the form of heat, its frequency does not change significantly but the magnitude of its oscilla-tions increases. If the magnitude becomes great enough to break some of the bonds holding the atom in place, the atom
may jump to a new position. The energy which it must over-come in order to accomplish this is known as the activation energy.
It is common to represent this activation energy graphically by a curve of varying amplitude showing energy slumps, or atom equilibrium locations, and energy peaks of height proportional to the activation energy. A typical diagram is shown in figure 2 where it is evicient that the probability of atom A exchanging position with atom B is more likely than atom B exchanging position with atom C
since the energy barriers differ. If the energy barrier is represented by a value of E cal/atom, the probability that
either atom B or C will reach the activation energy is pro. portional to e R where e is the natural logarithm, k is the Boltzmann constant, and T is the absolute centigrade temperature.
If e~ is the probability that . will be reached
is K= -f- e where f is the vibrational frequency. Dush-man and Langmuir34 have proposed that the diffusion coeffi-cient is approximately equal to the product of the probability per unit time that an atom will jump and the jump distance
squared
(
5
),
or:
D =K 6 -(10) therefore, D = -(1
ACTIVATION
E.NE-RGY
Figure 2. Graphical Representation of Activation Energies. Since the oscillation frequency and the jump dis-tance are fairly independent of temperature, a constant (D )
is introduced, and:
D =D . erE (12)
If both ' and kT are multiplied by Avogadro's
number, No - k will be replaced by the gas constant (R), and
cal./mole, thus:
D
=Do
*0 e-4
(13)
The equation has proven to be fairly accurate when checked
with experimental diffusion results which are limited to
the temperature ranges of a crystal structure wnich is under-.
going very slow disordering rates, but it has been found
that the value of Do varies considerably. This should not
be too surprising since it was assumed that Do did not vary
with temperature and it is common knowledge that 6
,the
jump distance, usually increases with temperature. It is
further assumed that the activation energy is not a function
of temperature and this also is not true.
The value of equation (13),
however, lies in its
usefulness for determination of the activation energy of a
particular
species
of solute atom in a given solvent system
over a given temperature range.
First, it is required to de.
termine experimentally the diffusion coefficient at, at
least, two different temperatures and preferably at several
intermediate temperatures for improved precision. There-.
fore, if D
2and D, are the two diffusion coefficients deter-.
mined at temperatures T2 and T
1respectively, it follows that:
D2 D - e 2 and D = Do * e 1 (14)
therefore,
and
in D2 = ln Do-2
in D
1= ln D
0k
35.
Subtrac ting
ln(D
2- Di)
=-
(15)
(16)
therefore, ln(D2 - Di)TiT2
This is the slope of the line shown in figure
3.
There-fore if the slope of the line is determined graphically,
where the logarithm of diffusion coefficients is plotted
D10
D, I -I- -- - _ - - - - -
_---TZ+
Figure 3. Graph of Diffusion results at given Temperatures
versus the reciprocal of the absolute centigrade
tempera-ture (Kelvin), the activation energy is:
Q
=
2.303 x R x slope
(17)
or,
Q
= 4.583 x slope(18)
In equation (18), R has the value of 1.99 cal./K./mole,
2.303 is the conversion factor used to convert from natural
to base 10 logarithms; hence,
Q
will have the units of
cal./mole.
37.
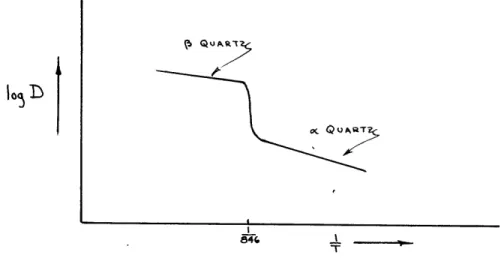
The effect of second order transformations on
dif-fusion coefficients may now be considered. If the difdif-fusion
rates of a solute, such as sodium, were measured in a solvent
such as
oquartz and the logarithms of the diffusion
coeffi-cients were plotted versus the reciprocal of the given
tem-peratures on semi-logarithm paper, the result should be
ap-proximately a streight line as previously explained. If,
however, the line were extended with the same slope to
tem-peratures over 573 degrees centigrade, it would be in error.
Sodium ions would tend to diffuse through
(quartz at a
higher rate due to the more open structure, and this increase
in diffusion would take place,
over a few degrees below 573
degrees, in which the
oquartz structure inverts to the
quartz structure.
Diffusion experiments would need to be
made at temperatures over 573 degrees centigrade.. The
re-sulting curve would probably be similar to that shown in
figure 4. The slope of the two fairly straight lines need
not be the same and, therefore, the energies of activation
for sodium in quartz would be different depending upon whether
the quartz solent was in the
oor
Q
state.
Plate VI shows the relationship of diffusion
coef-ficients for first and second order transformations when they
are plotted versus the reciprocal of temperature.
The left
side of the plate is taken from Professor Buerger's work.
35The log D versus l/T curve for a disordering transformation
U.
38.
is based upon results obtained in this thesis on the
investi-gation of diffusion rates in high and low temperature
struc-tural modifications of chalcocoite. The log D versus l/T
1 QQA,
105 D
-r
Figure 4. Variation of Diffusion in
c(and
(
Quartz
diffusion curves shown on this plate should serve as a
warning against attempts to determine the energy of
acti-vation of a particular system when based on only two diffusion
runs
at widely different temperatures, especially so when the
structural transformations of the mineral are not known,
This is particularly true of the feldspar minerals.
It is interesting to note the special case of the
transformation of c< iron to C iron. The self diffusion
coefficients of iron suddenly decrease when
ociron
trans-forms to
r
iron, where
r
iron is a higher temperature form
LOG D
T
T
FIRST ORDER
TRANSFORMATION
T-LOG D
I
SECOND
ORDER TRANSFORMATION
PLATE
VI
3e. E Ksf
T-40.
D. Mechanism of Diffusion
The relative importance of grain surface,
bound-ary, and volume diffusion rates is of considerable
in-terest. Grain boundary and surface diffusion would
nor-mally be expected to be rather significant when compared to
diffusion through a solid. This has been found to be true
in the study of diffusion of thorium along tungsten fila-o
36
ment wires.
In this case, surface diffusion was found to
be more rapid than grain boundary diffusion and much more
rapid than volume diffusion.
Several investigators37
have found that grain
boundary diffusion through metals is quite negligible,
es-pecially at high temperatures.
Wagnez
also believes this
to 'be true of semi-conductors and several ionic minerals;
i.e., at high temperatures, grain volume diffusion seems
to be of primary importance, while at low temperatures,
grain surface and boundary diffusion rates are much more
significant.
This effect can be determined by diffusing a
solute through pressed tablets which are composed of grains,
or crystals, of given size; in this way, the degree of
grain surface and boundaries can be varied from one
mentto another by varying the grain size of different
speci-Dr.
Carl Wagner, oral communication.
*
The terms low and high temperature become much more specific
when applied to a given mineral; e.g., a temperature over 105
degrees centigrade would be high for chalcocite since the
dif-fusion rate shows a significant increase at this temperature
and higher.
41.
mens. Identical diffusion experiments can then be
per-formed on
the tablets and the effect of grain boundaries
and surface area can then be ascertained.
The relative importance of grain surface, grain
boundary, and volume diffusion is extremely important when
applied to various geologic phenomena such as replacement,
pseudomorphs, basic fronts, reaction rims and zones, and
'38
ichor flow. Investigations
have already been made on
the rates of diffusion of solutions into granular material
with the interesting result that the rate is not dependent
upon the permeability or porosity of the rock. There seems
to be little disagreement upon the fairly rapid migration
of solutions through fractures, joints, and openings in
rocks. The importance of diffusion in geologic phenomena,
nevertheless, ultimately depends on the rate of grain volume
diffusion, or true solid diffusion, in order to have a
crys-tal of one composition changed to a cryscrys-tal of another
com-position by addition of ions.
Solid diffusion is usually broken down into three
basic mechanisms, especially in the case of metals. These
are interstitial diffusion, diffusion by direct intercnange,
and the so-called vacancy diffusion mechanism. These three
mechanisms are shown on plate
VII.
Interstitial diffusion takes place by movement of
ions through space surrounded by normal atomic sites. This
is probably a more common process in the case of a small atom
42.
such as carbon or aluminum diffusion through a crystal
structure made up of larger atoms such as carbon or copper
respectively.
A series of calculations have been made by several
investigators39 on the energy requirements needed for the
different diffusion mechanisms in the case of s elf diffusion
of f.c.c. copper. It was found that the activation energy
needed to cause a copper atom to jump from its equilibrium
site to an interstitial position is approximately 220,000
cal./mole, but the energy needed for a copper a
tom to move
from one interstitial position to another is only about
11,500 cal./mole.
Diffusion by direct interchange may occur by the
simultaneous exchange of position of two atoms, which is
known
as pair interchange, or it may occur by a cyclic
in.-terchange of
three, four, or more atoms. This
has recently
been called ring diffusion but a more descriptive term,
"cyclic", was proposed almost twenty years ago.
40The energy
of adtivation needed in the copper system for pair
inter-change is approximately 110,000 cal./mole.
For cyclic
in-terchange, it is lowered to a value of about 91,000 cal./mole.
In order to have a direct interchange of two atoms the
crys-tal structure would need to be strongly distorted during the
interchange. Because of this "space problem", the mechanism
is not accepted with much favor. It is important to note,
DIRECT
INTERCHANGE
CYCLIC (RING)
00000
00
0
o
Oo
00000
00
0
oo
o
00000
INTERSTITIAL
DIFFUSION
0 01,0 0 0 0 0
O OO
OO O
000000
d0
VACANCY
DIFFUSION
00000
00000
0.
00
00000
1
00000
00
-00
00000
00000
4
00000
09000
0000
00000
2
00000
000 0
00o60
00000
5
00000
0
-000
00000
00000
3
00000
00000
000- 0
00000
6
MECHANISM
OF DIFFUSION
PLATE
Vil
43.PAIR
however, that the cyclic type of interchange need not
re-quire much distortion of the crystal structure.
The third mechanism, vacancy diffusion, takes
place by an atom moving to a vacant site and thereby
cre-ating a vacancy in the site previously occupied. In the
case of copper, once again, the activation energy required
for a copper atom to move to a vacant site is about 23,500
cal./mole. The energy needed to create a vacancy within
the copper structure has already been given as having a
value of 220,000 cal./mole; however, the energy needed to
cause an atom to move on the surface of the crystal and form
a vacancy there is much less; it is of the order of 41,500
cal./mole. It is known, furthermore, through thermodynamic
reasoning that a given substance has a finite number of
vacant atomic sites at any temperature above absolute because
of the increase in entropy that results from the disorder that
they introduce. For example, the number of vanant sites in
a sodium chloride crystal is about one percent of the total
sites at a temperature near 800 degrees centigrade.
41The activation energy determined experimentally
from self diffusion studies of copper is about 47,000 cal.!
mole. This seems to indicate that vacancy diffusion is a
favored meonanism. It is
very probable, however, that all
other mechanisms occur but to a lesser extent.
The probable mechanism of solid diffusion in
min-erals, in silicates in particular, differs from the above
mentioned methods
in
a very basic
manner.
The silicates
are composed of specific structures or networks based not
only upon various arrangements of the silica tetrahedron
but also upon the number of shared oxygen atoms of each
tetrahedron. The result is a structural framework, formed
from the tetrahedrons, with positive ions located in the
larger openings of the framework. When the structure
re-ceives energy in the form of temperature, it tends to
be-come more open and the atoms are then more capable of
migrating or diffusing from one open space or cage to
an-other.
Basically, this is an interstitial type of diffusion
but it might be more descriptive to refer to the mechanism
as interstitial diffusion through a network or interstitial
network diffusion.
E.
Driving
Force for
Diffusion
An examination of Fick's Laws suggests that the
concentration gradient between two bodies is the driving
force which causes net diffusion from one body to the other.
Other investigations show that this is not the sole solution
of the driving force problem.
Darken42
investigated the
dif-fusion of carbon in two specimens of austenite iron which
were joined together along a planar contact. One specimen
contained 3.80% Si and 0.48% C; the second specimen contained
0.05%
Si and O.44% C as shown in the diagram below. If the
concentration gradient is the driving force, one would expect
the carbon c
shown by the
concentratio
the values a
4
oncentration to approach the concentration as
d6tted
line during diffusion; however, the
n after a diffusion time t
was found to bave
s shown by the diagram. The explanation for
Figure 5. Diffusion of Carbon in Iron
this is that carbon has a higher than normal thermodynamic
activity when in the presence of silicon; therefore, activity
may also be a driving force for diffusion.
A third factor, however, seems to be the
omnitent driving force for diffusion. This is the chemical
po-tential which is based upon the premise that a force (f)
acts
upon an impurity or solute atom in a solvent system causing
the solute to move in a direction +x, or:
f - potential gradient = - U
where - is the molar chemical potential gradient of the
solute atom along the i direction and N0 is Avogadro's number.