VALIDATED-READY-TO-USE GC-MS/MS METHOD FOR DIOXIN ANALYSIS IN
FOOD AND FEED FOLLOWING NEW THE EU REGULATION
L’Homme B.1, Sandy C.2, Scholl G.1, Eppe G.1, Focant J. -F.1 1
University of Liege, Allee du 6 août, B6, 4000 Liege, Belgium; 2Agilent Technologies, Wharfedale Road 610, Wokingham, Berkshire RG41 5TP, United Kingdom.
Introduction
Criteria for sampling and analyzing dioxins (including polychlorinated dibenzo-p-dioxins (PCDD) and polychlorinated dibenzofurans (PCDF)) and dioxin-like PCBs (DL-PCB) in feeding stuff and in certain foodstuff are given in Commission Regulations (EU) 278/2012 and 252/20121,2. These European Regulations give guidelines, requirements and analytical criteria to be met by a method for the official control of levels of dioxins. At the time the abstract is written (May 2014), gas chromatography coupled to high-resolution mass spectrometry (GC-HRMS) is the only method allowed for confirmatory analyses whereas GC-MS/MS can exclusively be used as a screening method as CALUX bioassay for instance.
Today, GC triple quadrupole technology reaches very high performances3-5 similar to GC-HRMS for dioxin analysis. A working group formed within the network of European Reference Laboratory (EU-RL) and National Reference Laboratories (NRLs) of EU Member States has successfully investigated the capability of GC-MS/MS for potential use as an alternative confirmatory method. Hence, in Dioxin 2012 symposium (Cairns, Australia), some specific criteria have been proposed as basic requirement for dioxin analysis6 and included in a new amendment to Regulations cited hereinbefore. In May 2014, this new amendment was already voted7, and to the best of what we know, should enter into force in July 2014. This amendment states that GC-MS/MS can be used as a confirmatory method for the official control of dioxins and gives performances required for MS/MS. In this communication, we present a fully validated GC-MS/MS method for the control of PCDD, PCDF, and DL-PCB in feed (vegetable oil). We show that the method meets requirement set by the EU Regulation. We discuss the following analytical criteria: selectivity, quantification/qualification multiple reaction monitoring (MRM) transitions, (instrumental) limits of detection and quantitation, linearity, accuracy, reproducibility, robustness, and measurement uncertainty. We base our results on quality control (QC) samples, fortified samples, real samples (unknown), procedure blanks, and proficiency testing (PT) samples.
Materials and methods
Chemicals
All chemicals (solvents and standards) are taken from the dioxin routine laboratory under ISO17025 QA/QC requirements. All congeners of PCDD/F and DL-PCBs are quantitated against their own 13C-labeled internal standards (EDF-4144, Cambridge isotope laboratories and MBP-MKX, Wellington laboratories). Recoveries are measured with recovery standards (EDF-4145, Cambridge isotope laboratories). Calibration curves are recorded with already prepared standard solutions for PCDD/F and NO-PCB (EDF-4143, Cambridge isotope laboratories), and lab prepared for MO and NDL-PCB using EC-4987, EC-5179, EC-4058 (Cambridge isotope laboratories), and MBP-MKX standards. QC samples consist in pork fat used in the routine on a 1-sample/serie of-10-samples basis. Procedure blanks follow the same procedure than the samples and are recorded on the same rate than QCs.
Analytical procedure
Extraction of fat if needed is performed with accelerated solvent extraction (ASETM 350, Dionex). Clean up is performed with PowerPrepTM system (FMS Inc.) using mixed bed acid/basic silica column, alumina column, and carbon column. Two fractions are collected for analysis: one consisting in dioxins, furans, and NO-PCB, the other in MO and NDL-PCB.
For analysis, we use GC-QQQ 7000C Agilent system equipped with PTV and 7693A automated liquid sampler. We inject 5µL for PCDD/F and NO-PCB analysis whereas we inject 2µL for MO and NDL-PCB. PTV is
operated on solvent vent mode. The temperature program is: start at 45°C (3min) and ramp at 720°C/min until 320°C; vent flow is 100mL/min at pressure of 10psi for 2.8min. Purge flow is set to 1200mL/min after 5min. GC column is the classic DB-5ms 60m x 250µm x 0.25µm. GC oven temperature program for dioxin fraction: start at 120°C (5min), ramp at 25°C/min until 250°C (5min), then 3°C/min until 285°C (15min). For MO-PCB fraction, leave 0min at 285°C. On MS side, we use the 7000C EI ion source, nitrogen collision flow of 1.5mL/min, and helium quench flow of 2.25mL/min. Quads resolution is set to unit mass.
Results and discussion
Validation criteria
Criteria specified by the SANCO document7, draft of the upcoming amendment (July 2014), were taken systematically to perform the validation. Table 1 summarizes all criteria to be met for GC-MS/MS to use this instrumentation as a confirmatory method for official control of dioxins. Some of these criteria are not different from GC-HRMS (i.e. selectivity), some are specific (i.e. LOQ determination).
Table1: Criteria to be met for GC-MS/MS for analysis of dioxin according to EU Regulation.
PCDD/Fs and DL-PCBs NDL-PCBs
Criteria GC-MS/MS (SANCO 11950/2013R2) GC-MS/MS (SANCO 11950/2013R2)
Detectable quantity
-PCDD/F upper femtogram (10^-15g)
NDL-PCB nanogram (10^-9g) -NO-PCB low picogram (10^-12g)
-MO-PCB nanogram (10^-9g)
Selectivity
-Chromatographic separation of
Relative RT ±0.25% IS vs analyte 1,2,3,4,7,8-HxCDF and 1,2,3,6,7,8-HxCDF
<25% valley peak to peak
MRM tansitions
-Monitoring 2 specific precursors with each -Monitoring at least 1 precursor ion and 2 product ions specific product ion transition for all labeled and
unlabeled analytes -Tolerance ratio ±20% if rel. intens. >50% -Relative ion intensities max ±15% -Tolerance ratio ±25% if rel. intens. 20-50% -Resolution MS quadrupoles = unit -Resolution MS quadrupoles = unit
Blank -Used for LOQ calculation -Used for LOQ calculation
-Blank value <30% of maximul level ML
iLOQ
-iLOQ calculated from lowest calibration point
-ditto -lowest concentration point on cali. Must give acceptable and consistent deviation to the average RRF
-Average RRF calculated for all points -Deviation to average RRF <30%
LOQ
-LOQ caluclated from average blank level
-ditto -LOQ < 1/5 of maximum level ML
-Difference ub and lb levels <20%ML -Diff. ub and lb for sum ind-PCB @ ML <20%
Accuracy Reproducibility
-Demonstrate performances at 0.5ML, ML, 2ML -Demonstrate performances at 0.5ML, ML, 2ML -Trueness (accuracy) ±20% -Trueness for sum ind-PCB @ ML ±30% -Within-lab reproducibility (RSD) <15% -Within-lab reproducibility (RSD) <20%
Control -QC chart for blanks -QC chart for blanks
-QC charts control sample -QC charts control sample
Recovery -Individual internal std in range 60-120% -Individual internal std in range 50-120%
-Out of range OK if contribu. to TEQ<10% -Out of range OK if contribu. to sum ind-PCB<10%
Measurement uncertainty
-Expanded measurement uncertainty
-Coverage factor = 2 (CL=95%) -Expanded measurement uncertainty -If separate determination of congeners, make -Coverage factor = 2 (CL=95%) sum of separate uncertainty for sum of PCDD/F
and DL-PCBs
Limit of quantitation and instrumental limit of quantitation
The document doesn’t state exactly how to calculate the instrumental limit of quantitation (iLOQ) and ‘matrix’ limit of quantitation (LOQ) that takes the blank level into account. We use the specific definition proposed by Kotz et al.6: iLOQ is calculated using replicates injections of the lowest calibration point if acceptable regarding the criteria. We took 8 replicates and determined standard deviation associated. iLOQ is defined as 10 times standard deviation. We obtained similar values than the ones obtained for GC-HRMS where the definition is based on signal to noise (S/N) ratio. For LOQ, one of the most important criteria since results are reported as a
function of LOQ (upperbound/medium/lower bound values) for dioxin analysis, we based the calculation on blanks replicates analyses. The following procedure is similar to the one used for GC-HRMS. We analyzed 10 blanks and an average value is determined for each congener. LOQ is defined as the average value of the blank plus six times the standard deviation. This definition is meaningful since, when a sample is analyzed, if levels are greater than LOQ, signals are statistically coming from the sample and not from the background.
Selectivity and quant/qual transitions
Selectivity criteria for MS/MS are not specific. Chromatographic separation is doing most of the work and a GC oven temperature program can be either used before HRMS or MS/MS. However chromatograms look differently since triple quadrupole systems filtrate ions and provide a flat baseline. We always prefer to use unsmoothed chromatograms to stay as close as possible to raw data. Internal standard and target retention times are checked and must not be different of more than 3 seconds (internal standard always before target).
Correct integration as well as absence of interference is verified manually and by checking quant/qual transition ratio. The quantitation MRM transition gives the higher response for an analyte whereas the qualification transition gives a lower response (often Quant+2 > Quant+2). Ratios Quant/qual transitions are determined experimentally from the calibration curve using constant MS parameters such as collision energy. Tolerance is ±15% for PCDD/F and DL-PCB and more for NDL-PCB (see Table 1). A closer look to raw data is mandatory whenever a congener is out of range to guarantee accurate result.
Accuracy and reproducibility
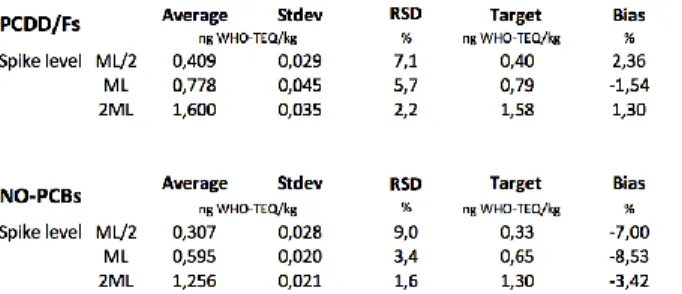
Spiked materials (vegetable oil) were used to assess bias of the method for PCDD, PCDF, NO-PCB, MO-PCB, and NDL-PCB. Six series of samples spiked at 0.5 maximum level (ML), ML, 2ML were injected over 3 days (2 series per day) providing also within lab reproducibility data. Table 2 shows results for the dioxin fraction, which accounts for more than 95% of the total toxic equivalency quantity (TEQ) of the sample.
Table 2: Bias of the method for PCDD/F and NO-PCB using 6 series of samples spiked at 3 levels around maximum level (ML).
The Regulation states that bias of the method (systematic error) must be <20% and within lab reproducibility (random error), expressed in terms of %RSD, must be <15%. These very good results were obtained and reported by a different operator than who spiked samples without knowing target levels in samples, giving added value to reproducibility data.
We also participated to a proficiency testing (PT) on vegetable oil (Rikilt, Wageningen, Netherlands) in 2013. Two materials were analyzed, one naturally contaminated by fish oil, the other artificially fortified with dioxins and PCBs. Results (Table 3) show very good accuracy of the method, perfectly meeting requirements of EU Regulation.
Table 3: Results of proficiency testing on vegetable oil (Rikilt, 2013).
Reported Target Value Accuracy Material 1 pg/g TEQ pg/g TEQ
PCDD/Fs 1,10 1,01 8,8% DL-PCBs 0,80 0,89 -10,3% Total TEQ 1,90 1,90 -0,1% Material 2 PCDD/Fs 0,55 0,48 15,6% DL-PCBs 0,82 0,85 -3,0% Total TEQ 1,38 1,33 3,7%
Control and robustness
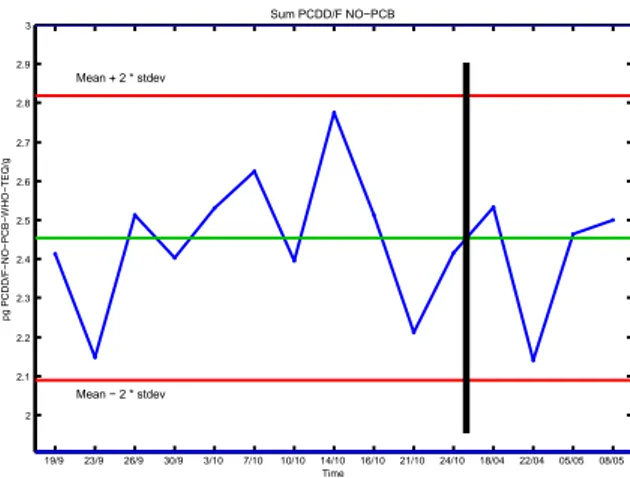
Blanks samples and quality control (QC) samples (pork fat) prepared in the lab were injected (2 per week) during 2 months (September-October 2013) and, after a break period, during April 2014. Figure 1 represents a quality control chart for QC samples (always corrected by blanks) during this period.
Figure 1: QC chart over September-October period and April period.
We have done 15 injections and remained under control, within average ± 2 times standard deviation, even after the 6 months break (after black line on Figure 1) when columns were changed several times and the system switched off as well. We did not have problem to get back to the original very high performances meaning that the method is robust over that period. Note that the average value and standard deviation of the chart were determined previously by 10 different QC injections. Blanks control chart has also been recorded to check blanks and background level. An out-of-control blank is measured when its level is higher than LOQ (determined as average blank + 6 times standard deviation), which, so far, has never happened whatsoever. Conclusion
A GC-MS/MS method has been developed and fully validated looking systematically to criteria lay down in the upcoming EU Regulation that will allow the use of GC-MS/MS as a confirmatory method for official control of dioxins, furans, and dioxin-like PCBs. We prove that this technology meets requirements and can achieve performances similar to GC-HRMS.
Acknowledgements
Agilent Technologies for instrumental support; University of Liege, Belgium;
Research Training Fund for Industry and Agriculture (F.R.I.A) for financial support of Ph.D; Wim Traag (Rikilt) for PT samples.
References:
1. Commission Regulation (EC) No 278/2012 of 28 March 2012 amending Regulation (EC) No 152/2009 (OJ L 91, 29.3.2012, p. 8–22)
2. Commission Regulation (EU) No 252/2012 of 21 March 2012 repealing Regulation (EC) No 1883/2006 (OJ L 84, 23.3.2012, p. 1–22)
3. Ingelido AM et al. (2011) Rapid Commun. Mass Spectrom, 26: 236-242 4. Sandy C et al. (2011) Organohalogen Compd 73: 1370-1371
5. Kotz A et al. (2011) Organohalogen Compd 73 : 688-691 6. Kotz A et al. (2012) Organohalogen Compd 74 : 156-159 7. SANCO/11950/2013 Rev2 19/9 23/9 26/9 30/9 3/10 7/10 10/10 14/10 16/10 21/10 24/10 18/04 22/04 05/05 08/05 2 2.1 2.2 2.3 2.4 2.5 2.6 2.7 2.8 2.9 3 p g P C D D /F − N O − P C B − W H O − T E Q /g Time Sum PCDD/F NO−PCB Mean + 2 * stdev Mean − 2 * stdev