Alternative modeling of fixed effects in test day models to increase their usefulness for management decisions
5
0
0
Texte intégral
(2) structures among known test days, e.g. accounting for cow specific lactation curves. Predictions would then be obtained directly from the solutions. As long as we are interested into deviations of animals from mean yields this should work well but fixed effects and especially contemporary group definition may be more problematic. Since early days of test day model research (Ptak & Schaeffer, 1993) use of a herdtest date fixed effect (HTD) was considered optimal as it allows theoretically unbiased comparison of animals because of the theoretically unbiased estimation of contemporary groups yield levels. Therefore most TDM contemporary groups are based on this effects. One might however identify and especially in the context of prediction of future yields, different shortcomings. First future HTD can not simply be predicted because this effect does not model any time or seasonal trends. Secondly, current definition of HTD is not very robust against low number of animals in contemporary groups. Especially with seasonal calvings, even large herds may have from time to time very few animals that just freshened or were not yet dry.. Luxembourgish dairy population it was decided to precorrect milk, fat and protein test day yields for age-season-stage of lactation, lactation curves coming from the current VIT test day model: 2 y c = y − KASRZ km + b km1 (D / c ) + b km 2 (D / c ). + b km 3 ln (c / D ) + b km 4 [ln (c / D )]2. where yc is the corrected test day yield, y is the measured test day yield, KASRZkm is the constant effect during lactation (age at calving * season interval * interval between calving * breed * region * class of year of calving), D is the day in milk and c a constant term equal to 380. Model 1 The precorrected data set was then introduced in the following random regression model (RRM):. y c = Xb + Q(Wh + Za + p) + e where b vector of HTD fixed effects, h vector of common herd period of calving environmental random regression coefficients, a vector of genetic random regression coefficients, p vector of permanent environmental random regression coefficients, e vector of residual effects, X, W, Z are incidence matrices, Q is the covariate matrix for the second order Legendre polynomials. This model is very close to the classical RRM used currently except for the common herd environmental effect. This effect was introduced as preliminary research showed that its introduction improved consistency of heritabilities and genetic correlations during the lactation as parts of the formerly genetic (co)variances were considered environmental (Rabier, 2002). The common herd effect was defined inside 5 periods of calving of 2 years (<1992/04/01, 1992/04/01-1994/03/31, 1994/04/01-1996/03/31, 1996/04/01-1998/03/31, >1998/03/31).. The aim of this paper was therefore primarily to study the evolution of this HTD effect with the data of the Luxembourgish dairy population and to see how we can first predict its value at the next test date. Secondly we propose a simple remodeling of this effect in order to use it in a management purpose.. Materials and Methods Data Data were extracted by the VIT (Vereinnigte Informationssysteme Tierhaltung Germany) who manages Luxembourgish data and contained 499524 first lactation test day records (between days in milk 4 and 330) for milk, fat and protein yields from 58881 Holstein and Red and White cows. The pedigree file contained 106896 animals.. Study of fixed HTD solutions Precorrection HTD solutions obtained from Model 1 were studied. At population level means were computed for every month across all the herds and years.. The official Luxembourgish dairy population data (herdbook, conformation, performances, ... ) are processed by VIT and included in the German data bases. Given the small size of the 129.
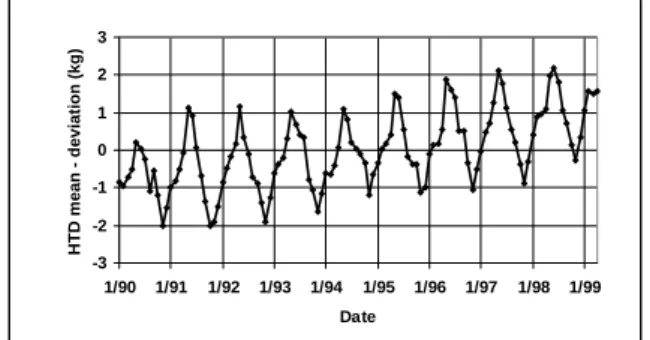
(3) Model 2. Results and Discussion. If predictability of future tests is a major issue, replacing the fixed HTD effect by alternative fixed effects spanning over several test days with an additional HTD random effect could be a promising modification. The prediction of a given herd mean at a given test day would then simply be the sum of solutions of the new fixed effects. Therefore an alternative model was defined:. Analysis of the HTD effects from Model 1 HTD solution showed a large dispersion. This underlines the large differences among herds. Figure 1 gives the evolution of monthly HTD solutions for milk.. HTD mean - deviation (kg). 3. y c = Um + Tt + Xb + Q(Wh + Za + p) + e where m vector of herd test month period (HTMp) fixed effects, t vector of herd test year (HTY) fixed effect, b vector of herd test day random effects (HTDr), U, T, X, are incidence matrix, all the other symbols stay the same.. 2 1 0 -1 -2 -3 1/90. 1/91. 1/92. 1/93. 1/94. 1/95. 1/96. 1/97. 1/98. 1/99. Date. Figure 1. Evolution of the monthly HTD milk solutions across time.. In order to allow stable predictions for current test years, the HTY effect spanned the two last years. The HTMp effect was defined inside time periods of four, respectively five years for newer years allowing for major changes inside a herd over the years.. Two trends are visible in these HTD solutions. First overall production is progressing over time. Secondly, over time monthly HTD means show very similar patterns within year, where the maximum corresponds generally to pastern release and the minimum to the month of November.. Comparison of solutions from Model 1 and Model 2 Comparison of solutions from Model 1 and Model 2. Possible bias in rankings due to the use of Model 2 were studied by comparing breeding values for lactation yields obtained by integration of the Legendre polynomials for each animal from 0 to 305 days in milk. Comparison of fixed effect solutions from Model 2 (HTY + HYMp) with fixed HTD solutions from Model 1 allowed to access the potential for predictability of herd test day mean effects.. The comparisons of EBVs from both models showed that the new modeling proposition lead to few rerankings. Table 1 gives the Spearman rank correlation for all the cows in the pedigree file. Values were consistently over 0.99. Table 1 gives also the distribution parameters of the absolute difference and this for milk, fat and protein yields.. Variance components. Table 1. Comparison of 305 day lactation EBVs from both models.. The variance components used in this study were based on those computed by Rabier (Rabier, 2002) using subsamples of the same data, Model 1 EM-REML. For Model 1 and Model 2 the same variance components were used, only for Model 2, error variance was artificially subdivided into two parts, a part considered linked to HTDr and a part considered being the reduced error variance. The 1/1 ratio was chosen for this preliminary study.. Rank Absolute difference (kg) Trait Correlation Mean Std Max ------------------------------ Sires ------------------------------Milk 0.993 22.456 25.444 404.06 Fat 0.993 0.7506 0.7904 10.394 Protein 0.991 0.5916 0.6579 11.942 ------------------------------ Cows ------------------------------Milk 0.991 31.526 32.644 903.44 Fat 0.993 1.0767 1.0877 38.722 Protein 0.991 0.8209 0.8254 22.749. 130.
(4) showed that prediction of HTD results from the sum of HTY + HTMp solutions would have been possible. As shown in Figure 4 most larger differences that were observed are simply due to the fact that original HTD classes were small.. Figure 2 and 3 show the frequency distribution of the absolute difference for milk for the sires and for the cows (cows with records and female ancestors) in the pedigree file.. Number of HTD records. 0 ,4 0 0 ,3 0 0 ,2 0 0 ,1 0 0 ,0 0 0. 10 20 30 A b s o lu te d iffe re n c e (x 1 0 k g ). 40. 10 8 6 4 2 0 0. Figure 2. Frequency distribution of the absolute EBV differences for sires.. 2. 4. 6. 8. 10. 12. 14. 16. 18. 20. A b s o lu te d iffe r e n c e (0 .1 k g c la s s ). Figure 4. Dispersion diagram plotting the mean number of HTD records within 0.1 kg classes of absolute difference for milk yields.. 0 .4 0. Frequency. 12. 0 .3 0 0 .2 0. Conclusions. 0 .1 0 0 .0 0 0. 10. 20. 30. Additional research will be needed as we reported only for first lactation yields and we did not reestimated (co)variance components. However the present results are highly encouraging. The alternative modeling of fixed effects to increase their usefulness for daily herd management can be done inexpensively and give very interesting results. The expected bias in the EBVs was extremely small and nearly no reranking occurred. Differences between fixed HTD effects and new HTY + HTMp effects were generally small and were mostly due to the small size of some HTD classes. Obviously one might doubt on the usefulness of very small HTD classes.. 40. A b s o lu te d if fe r e n c e ( x 1 0 k g ). Figure 3. Frequency distribution of the absolute EBV differences for cows.. Rerankings were surprisingly rare showing that potential bias in rankings is limited. Table 2. Comparison of HTY + HTMp from Model 2 with HTD from Model 1.. Trait Milk Fat Protein. Correlation 0.918 0.919 0.919. Absolute difference Mean Std Max 1.00 0.91 17.6 0.046 0.042 0.87 0.037 0.032 0.49. The introduction of the new model allows a better predicting of the herd mean performances over time. This is somewhat unusual thinking, because genetic evaluation systems are setup actually in a way to try to predict only unbiased EBVs. However in the future alternative use of results from genetic evaluation systems will become an important issue. Especially the possibility to model the data in a correct manner and to obtain jointly estimates of environmental and genetic effects having the desired (BLUE and BLUP) properties. Progress in this field is very important in order to justify the rising costs of present and future milk recording schemes.. Table 2 gives details about the comparison of the absolute difference between the contemporary group solution defined as (HTY + HTMp) and HTD. Absolute differences were generally very small with some exceptions. The highest difference, 17.6, occurred for a test date in which only one test day yield was recorded (Figure 4). In such a situation the fixed HTD solution from Model 1 makes anyway not much sense. Table 2 gives also the Pearson correlations comparing solutions from HTY + HTMp (Model 2) with those from HTD (Model 1). Results here. 131.
(5) Rabier, F. 2002. Personal communication. Schaeffer, L.R. & Jamrozik, J. 1996. Multiple-Trait Prediction of lactation yields for dairy cows . J. Dairy Sci. 79, 2044-2055. Swalve, H.H. 2000. Theoretical basis and computational method for different test-day genetic evaluation methods. J. Dairy Sci. 83, 1115-1124. Van Bebber, J., Reinsch, N., Junge, W. & Kalm E. 1999. Monitoring daily milk yields with a recursive test day repeatability model (Kalman Filter). J. Dairy Sci. 82, 2421-2429. VanRaden, P. 1997. Lactation yields and accuracies Computed from test day yields and (co)variances by best prediction . J. Dairy Sci. 80, 3015-3022.. Acknowledgments Nicolas Gengler who is Chercheur qualifié of the FNRS (Brussels, Belgium) acknowledges his financial support. The authors gratefully acknowledge the financial support of the Luxembourgish Herdbook Federation, a breeders cooperative.. References Ptak, E. & Schaeffer, L.R. 1993. Use of test day yields for genetic evaluation of dairy sires and cows. Livest. Prod. Sci. 34, 23-34.. 132.
(6)
Figure
Documents relatifs
In order to study non-flow effects that are not correlated with the reaction plane, as well as the fluctuations of v 2 , we compare two different analysis methods: (1) event
« Les femmes dans le Civil and Public Services Association : dynamique de classe, dynamique de sexe»
C’est ainsi que les motions visant à faire avancer la situation des femmes, que ce soit pour de meilleurs congés maternité, pour des tests de cancer de sein sur les lieux de
Pour B,« dans les villages vacances, on est quasiment toujours sur la problématique de chaîne du déplacement ».Avec cette connaissance du secteur du tourisme social, par
Abstract: In order to meet the requirement of dairy cattle breeding and modern cattle farm management, the dairy cattle registration and herd management system was
As a preliminary step in this process, a numerical model was built to reproduce penetration tests conducted in static and dynamic conditions.. Two-dimensional Discrete
A new catalyst design strategy based on optimizing electronic structure has been proposed and then applied to a very important environmental application, the
Research and Development of Mediterranean Pasture and Forage Resources Réunion conjointe du Réseau FAO-CIHEAM de Recherche et Développement sur les Ovins et les Caprins
AOP under three distinct weather conditions (background, haze, and dust days) over Beijing were compared by using the retrieved skyradiometer and sunphotometer data combined with
