A Design Strategy Applied to Sulfur Resistant
Lean NO, Automotive Catalysts
by
Hairong Tang
Submitted to the Department of Chemical Engineering
in partial fulfillment of the requirements for the degree of
Doctor of Philosophy
at the
MASSACHUSETTS INSTITUTE OF TECHNOLOGY
August 2005
©
Massachusetts Institute of Technology 2005. All rights reserved.
r
Author
...
'~/' '. -. . . . .:.,' . .. .. .. . . . .J/I...
Department of Chemical Engineering
August 11, 2005
...-....- :
...~
%-~
...
~
~
~
. . . .Bernhardt L. Trout
Associate Professor of Chemical Engineering
Thesis Supervisor
Accepted
by...
MASCHSI INSITUT, MASSACHUSES INSTRuTE OF TECHNOLOGYSEP 12 2005
.. ,. .... ... . ...
Daniel Blankschtein
Professor of Chemical Engineering
Chairman, Committee for Graduate Students
A~hl!%
s
A Design Strategy Applied to Sulfur Resistant Lean NOx
Automotive Catalysts
by
Hairong Tang
Submitted to the Department of Chemical Engineering on August 11, 2005, in partial fulfillment of the
requirements for the degree of Doctor of Philosophy
Abstract
Catalyst poisoning due to sulfur compounds derived from fuel sulfur presents a major challenge, intractable thus far, to development of many advanced technologies for automotive catalysts such as the lean NO, trap. Under lean conditions, sulfur will be oxidized to S 3 and then form sulfate on the trap. The sulfate on the trap is
thermodynamically very stable and, thus, difficult to purge. The NO, trap will then be deactivated over time. Our objective has been to build up a framework for the design of selective, sulfur resistant, oxidation automotive catalysts, which are active for the oxidation of NO to NO2 but relatively inactive for the oxidation of SO2 to SO3.
It is well known that the catalytic properties of alloys are often superior to those of pure metals, because of either the electronic effect or the ensemble effect or both. The ensemble effect is due to a change in distribution and availability of surface reaction sites, while the electronic effect is due to a change in electronic structure, leading to a change in rate constants of elementary steps. However, a very large number of possible compositions of alloys exist for any particular application. Therefore, a fundamental understanding of the relationship between the electronic structure, the composition, and the activity of alloys, which could aid in catalyst design, is first developed. This is accomplished by constructing a generalized weighted d-band center model for the prediction of the binding strength of chemisorbed molecules, in which the various atoms in the molecules bind unequally to multiple types of surface atoms. This model is then applied to estimate the adsorption energies of SO2 and NO at
both initial states and transition states on various surfaces. Both energetic data and electronic structure data are obtained from first principles density functional theory calculations.
Our model is found to predict well the relative stability of adsorbates on surfaces and can be used to predict the effects of different compositions on the energy of adsorption. A strong linear correlation is found between our new weighting of the positions of the d band of the surface and the molecular adsorption energy. These linear relationships are then used together with energy decomposition scheme for a
coadsorbed system on surfaces, to predict the reactivity of SO2 and NO oxidation on different surfaces. A catalyst which is selective for the oxidation of NO over SO2 is
then developed. This study should aid in the development of more effective catalysts for an extremely important environmental application.
Thesis Supervisor: Bernhardt L. Trout
Acknowledgments
First of all, I would like to thank my thesis advisor, Professor Bernhardt L. Trout, for encouraging me to take the challenge to change my major and join department of chemical engineering at MIT instead of chemistry department at Harvard, devel-oping my skills in research, writing, and communicating by offering critical thinking in tackling engineering problems and providing many great opportunities, generously giving his time to help me with everything, and always being an encouraging, un-derstanding, supportive, and friendly PhD advisor. I have to say that it has been a great pleasure to work with him, and I am very glad that I chose to study at MIT.
I would also like to thank my thesis committee members: Professor Gerbrand Ceder, Professor William H. Green, Jr., and Professor Klavs F. Jensen for their help and valuable suggestions in guiding this thesis. I thank very much Prof. Ceder from the Department of Materials Science and Engineering for offering great guidance and valuable advice, especially in the work of the surface phase diagram. Prof. Ceder also introduced me to know some excellent students in his group, such as, Anton Van dei' Ven (now on the faculty at the University of Michigan), who has helped me significantly and saved me a tremendous amount of time in the phase diagram study. I1 am grateful to Prof. Green for being the first professor, other than Prof. Trout, to welcome me to join chemical engineering at MIT, continually enouraging me and giving me useful suggestions during my whole PhD research, in addition to being one of my references during my career search. I also thank Prof. Jensen for his input and helpful recommendations during each individual meeting, and his help and encouragement in the core course Chemical Reaction Engineering.
I also want to thank Professor Jefferson W. Tester for being nice to me all the time, spending time to attend to my seminars, making suggestions that he thinks good for me, and being willing to be one of my references during my career search. I thank Professor Charles Musgrave from Department of Chemical Engineering at Stanford for being like a second advisor outside of MIT. I thank Professor Daniel Blankschtein for encouraging me during my PhD study, especially before I took the
qualifying exam. I thank Professor Patrick S. Doyle for being nice, friendly, and encouraging to me, helping me a great deal in the core course Transport Phenomena and in the preparation of qualifying exam, in addition to spending time to write me a recommendation letter for me. I thank very much Gwen Wilcox for her friendship and efforts, with everything including the Chinese New Year Party. I really had a good time with her after she became Prof. Trout's assistant.
Another good side of joining MIT is getting the chance to make many excellent friends. Jhih-wei Chu and Xi Lin deserve special thanks for their friendship and help in getting my project going in many ways. I would also like to thank every Trout group member, both past and the current, for providing a friendly, supportive, and fun work atmosphere in the basement over the years. Special thanks also go for Ramin Haghgooie, Keith E. Tyo, Patrick T. Underhill, Oluwayemisi Oluwoleo, Jungmee Kang, and many other classmates for their kindness and friendship and for helping me to adapt to American culcure.
I thank many friends from China, Zhenhua Li, Xianfeng Liu, Jerry Chen, Jing Zou etc, for listening to my complains all the time, encouraging me all the time, and letting me keep confidence all the time.
Finally, I would like to acknowledge my great parents and grandparents for al-lowing their only kid to study abroad, and giving me their constant understanding, support, and love. Without them, I would not be able to go through these years. I
Contents
1 Introduction to Automotive Catalysts
1.1 Automotive catalysts exhaust control systems ... 1.2 NOx control under lean condition ...
1.2.1 Selective Catalysis Reduction (SCR) technology 1.2.2 Lean NOx traps (Adsorbers) ...
1.3 Current approaches for catalyst design ... 1.4 Goal and objectives ...
2 Computational Methods
2.1 Overview of total energy calculations ... 2.2 Born-Oppenheimer approximation ...
2.3 Density functional theory (DFT) ... 2.3.1 Electron-electron interactions ... 2.3.2 Hohenberg-Kohn theorems ...
2.3.3 Kohn-Sham energy functional and equations ...
2.3.4 Approximations for describing the exchange-correlation energie 2.4 Periodic supercells ...
2.4.1 Bloch's theorem ... 2.4.2 k-point sampling ... 2.4.3 Plane wave basis sets ... 2.5 Pseudopotential approximation ...
2.5.1 The idea of pseudopotential approximation ... 2.5.2 Vanderbilt's ultrasoft pseudopotential ...
17 17 18 19 20 21 23 25 25 26 27 27 27 28 s 29 31 31 32 33 34 34 36
2.5.3 Generation procedure of Vanderbilt's ultrasoft PP in literature 36
2.6 Minimum Energy Paths and the Nudged Elastic Band method ... . 38
2.7 Monte-Carlo simulations ... . 40
3 Phase Diagram of Oxygen Adsorbed on Platinum(111)
43
3.1 M otivation . . . 443.2 Details of calculations . . . 45
3.2.1 Density functional theory (DFT) for total energies ... . 45
3.2.2 Cluster expansion for lateral interaction parameters ... . 48
3.2.3 Monte Carlo simulations . ... 50
3.3 Results and discussions . . . 52
3.3.1 Formation energies of oxygen adsorbed on Pt(111) ... . 52
3.3.2 Lateral interaction parameters . ... 54
3.3.3 Phase diagram of O/Pt(111) ... . 58
3.3.4 Phase under experimental conditions ... 63
3.4 Conclusions ... 65
4 Development of Electronic Composition-Property Relationship and
Its Application to SO2 Chemisorption on Pt(111) Surfaces, Alloys,
and Overlayers
67
4.1 M otivation . . . 684.2 Details of calculations . . . 69
4.3 Results and discussions . . . 70
4.3.1 Development of new weighted d-band center model ... . 70
4.3.2 Application of new model to SO2 chemisorption on Pt(111) surfaces, alloys, and overlayers ... 72
4.4 Conclusions ... 77
5 NO Chemisorption on Pt(111), Rh/Pt(111), and Pd/Pt(111)
79
5.1 M otivation . . . 795.3 Results and discussions . . . 84
5.3.1 Adsorption of NO on Clean Pt(111)Surfaces ... . 84
5.3.2 NO Chemisorption at fcc Site on Alloy Surfaces and Overlayers 85 5.4 Conclusions ... 92
6 Rational Design of Selective, Sulfur-Resistant, Oxidation Emissions
Catalysts
95
6.1 M otivation . . . 966.2 Details of calculations . . . 98
6.3 Results and Discussions ... ... . 99
6.3.1 Strategy for Selective Catalyst Design ... 99
6.3.2 Estimation of Exs - EXs in X +0 - XO (X=SO2 and NO) 105 6.3.3 Validation of the Design Strategy by NEB Calculations ... . 116
6.4 Conclusions ... 117
7 Conclusions and Recommended Future Work
119
7.1 Surface phase diagram of O/Pt(111) ... . 1197.2 Development of an electronic composition-property relationship and its application to SO2 and NO chemisorption ... 120
7.3 Design of selective, sulfur-resistant, oxidation emissions catalysts . . . 121
List of Figures
1-1 Conversion eficiency of CO, HC, and NOT vs. Air/fuel ratio ... 19
1-2 Illustration of processes of NO, removal with the lean NO. trap tech-nology ... 21
1-3 Illustration of the impact of sulfur from the fuel on the lean NOx trap. 22
2-1 Schematic illustration of the all-electronic (AE) wave function and elec-tronic potential (Z/r) (solid lines) vs. distance from atomic nucleus, r. The corresponding pseudo wave function and pseudopotential are also plotted (dashed lines). The radius at which all-electron and pseudo-electron values match is marked r ... ... . 35
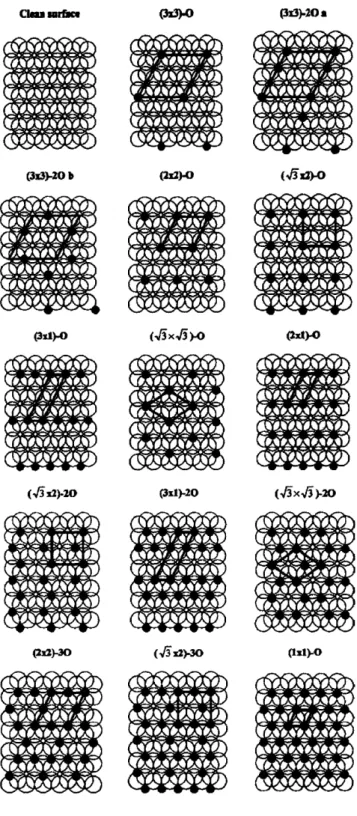
3-1 Adsorbed oxygen configurations calculated using DFT-GGA. Large empty circles represent Pt atoms and small filled circles represent O atoms. Unit cells are marked in each configuration ... . 47
3-2 Lateral interactions between and among oxygen atoms adsorbed on Pt(111). Small circles represent oxygen atoms and large circles repre-sent platinum atoms ... 49
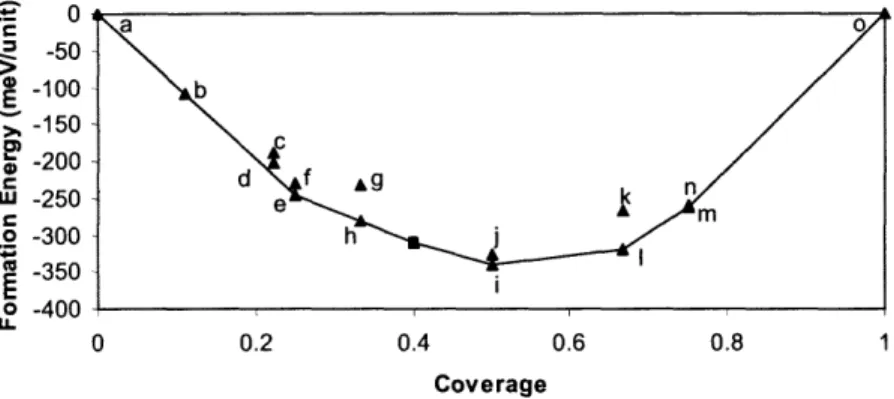
3-3 Formation energies of adsorbed oxygen atoms on Pt(111). (The square point was not included in the fitting of the lateral interaction param-eters but was used as a test for our cluster expansion). Labels (a-o) correspond to those in Table 3.1 ... 52
3-4 Comparison among the changes of projected density of states (pDOS) of Pt atoms at different distances from an adsorbed oxygen atom. (The differences are with respect to Pt atoms of the same symmetry at clean surfaces.) ... 57
3-5 Side view of the configuration p(2x2)-O ... ... . 58
3-6 Phase diagram of O/Pt(111): The solid lines denote continuous phase transitions and the dotted lines denote first order phase transitions. . 59
3-7 A sample configuration of the ordered oxygen phase having the symme-try p(2x1) on Pt(111), with p(2x1) rows rotated by 120° with respect to each other ... 60
3-8 Regions characterized as p(2x2) oxygen islands in a snapshot of a GCMC calculation (T = 100 K, p = -979, and 0 = 0.09 ML) .... . 62
3-9 Oxygen on Pt(111) dosed at 82 K and warmed to 152 K. Bright atoms are Pt and dark atoms are O. 70 AX 70
A.
Reproduced with permissionfrom Ref. (Stipe et al., 1997) ... 64
4-1 Schematic of SO2 adsorbed to alloyed Pt (111) surfaces in which the
surface atom labeled b is replaced by another atom, Pd in this case. (a) top view; (b) side view with bond lengths of the Pd-Pt system. .. 70
4-2 Adsorption energies of SO2 on different alloyed Pt (111) surfaces and
overlayers vs. weighted d-band center of the surfaces: (a) Pd-Pt series; (b) Cu-Pt series; and (c) Ru-Pt series. (a') Pd-Pt series (by Pallassana et al.'s model (Pallassana et al., 2000)) ... 73
4-3 Local d-projected density of state (pDOS) of different atoms of various alloyed surfaces: (a) Pd alloyed Pt(111) surface; (b) Cu alloyed Pt(111) surface; and (c) Ru alloyed Pt(111) surface. (Energy values in the legend are the d-band centers for each metal surface atom described
4-4 Linear relationship between stable SO2 adsorption on various alloyed
Pt(1 11) surfaces and overlayers vs. weighted d-band center of the sur-faces . ... 77
5-1 Schematic of NO adsorbed at various sites on clean Pt (111) surfaces: (a) top view of NO at fcc sites; (a') side view of NO at fcc sites; (b) top view of NO at hcp sites; (a') side view of NO at hcp sites; (c) top view of NO at top sites; (a') side view of NO at top sites ... 83
5-2 Adsorption energies of NO on Rh alloyed Pt (111) surfaces and overlay-ers vs. weighted d-band center of the surfaces calculated by Pallassana et al.'s model (Pallassana et al. , 2000) ... 88
5-3 Adsorption energies of NO on Pd alloyed Pt (111) surfaces and over-layers vs. weighted d-band center of the surfaces: (a) By Pallassana et al.'s model (Pallassana et al., 2000); (b) By our model (Tang & Trout, 2005a) ... 90
6-1 Illustration of possible cases of the energy barrier vs. d-band center
(Ed) for NO oxidation (dashed line) and SO2 oxidation (solid line).
.
1016-2 Energy decomposition scheme for a co-adsorbed system on surface. All
the terms are defined in the text ...
101
6-3 NEB chain images of oxidation reactions: (a) SO2+O-*SO3 (b) NO+O--NO 2.
The first, middle, and the last images in each row are the initial state (IS), the transition state (TS), and the final state (FS) respectively. 103
6-4 Linear relationship between adsorption of SO2in its most stable config-uration at the initial state (fcc site) on various alloyed Pt(111) surfaces and overlayers vs. the weighted d-band center of the surfaces .... 107
6-5 Linear relationship between NO adsorption at the initial state (fcc site) on various alloyed Pt(111) surfaces and overlayers vs. the weighted d-band center of the surfaces. The vacant square points marked as iMd/Pt(111) are added to test the generality of the linear relationship. 108
6-6 Linear relationship between SO2 adsorption at the transition state on
various alloyed Pt(111) surfaces and overlayers vs. the weighted d-band center of the surfaces ... 109 6-7 Linear relationship between NO adsorption at the transition state on
various alloyed Pt (111) surfaces and overlayers vs. the weighted d-band center of the surfaces ... 110 6-8 Local projected density of state (pDOS) of (a) d orbitals of M in
lMd/Pt(lll), (b) Px orbitals of N for NO adsorption at TS (top) on 1Md/Pt(111), (c) Px orbitals of N for NO adsorption at IS (fcc) on
1Md/Pt(111), where M=Au, Pt, Ir, Rh, and Ti ... 113
6-9 Correlation of the energy differences of SO2 and NO between the
ini-tial state and the transition state on various alloyed Pt(111) surfaces (1MX/Pt(111), with x=a for SO2 and x=d for NO) vs. the surface
d-band center of the surfaces. M of each point is marked in the plot. . 114
6-10 Plot of selectivity of the oxidation of NO at 700 K vs. the surface
d-band center of the surfaces (1Mx/Pt(111), with x=a for SO2 and
x=d for NO). M of each point is marked in the plot. The solid line is for the selectivity calculated by Eq. (6.12), and the dashed line is for the effective selectivity which includes the reactants chemisorption and products desorption steps ... 115 6-11 Minimum energy paths of the oxidation of (a) SO2 (b) NO on various
List of Tables
3.1 Formation energies (in meV) for O on Pt(111) for various coverages.
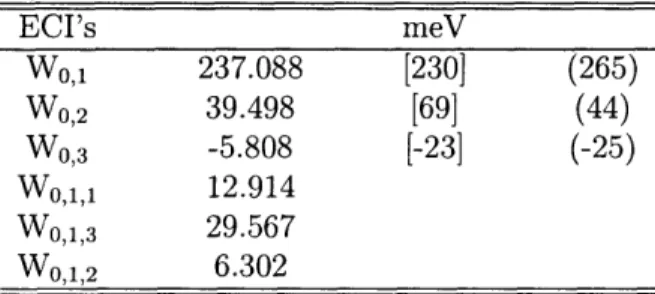
(All of the configurations can be found in Figure 3-1.) ... . 53 3.2 Fitted ECIs by using a cluster expansion with the first set of site
op-erators for O/Pt(111). (i, j, k in Vj or Vi,j,k are marked Figure 3-2) 54 3.3 Fitted ECIs by using a cluster expansion with the second set of site
operators for O/Pt(111). In brackets, we list the interaction parame-ters fitted by Piercy et al. from the experimental O/Ru(0001) phase diagram (Piercy et al. , 1992). In parenthesis, we list the interac-tion parameters derived by Stampfl et al. from DFT computainterac-tions for O/Ru(0001) (Stampfl et al., 1999). (i, j, k in W.,- or Wi,j,k are marked in Figure 3-2) ... . 55 3.4 Comparison between effective cluster interactions corresponding to the
first set of site operators. The interaction parameters listed in the V-ECI column were fitted directly by the cluster expansion with the first set of site operators. Those in the V-W column were transformed from interaction parameters fitted with the second set of site operators. (i, j, k in Vij or Vi,j, are marked in Figure 3-2.) ... . 55
4.1 Binding energies (BE) of SO2 on nMX/Pt(111) and comparison of
weighted d-band center of the surfaces calculated by our model and Pallassana et. al.'s model (Pallassana et al. , 2000) ... . 74
5.1 Adsorption energies (AE) and geometric parameters for NO chemisorp-tion at various sites on clean Pt(111) surfaces ... 85
5.2 Adsorption energies (AE) of NO chemisorption on: (a) Rh/Pt(111) surfaces and (b) Pd/Pt(111) surfaces ... 86 5.3 Bond strength and bond length between alloyed species and platinum
atoms. Adsorption energy (AE) of NO at an fcc site on 1M/Pt(111)
is also listed for reference ... . 93
6.1 Adsorption energies (AE) of the most stable configurations of SO2
with initial geometries on various surface alloys nMx/Pt(111) and the weighted d-band center (Ed) of each surface ... 106 6.2 Adsorption energies (AE) (units of KJ/mol) of NO chemisorbed on (a)
Rh/Pt(111) surfaces and (b) Pd/Pt(111) surfaces and the weighted d-band center of each surface (Ed) (units of eV) ... 108 6.3 Energy barriers (Ea) via NEB for the oxidation of (a) SO2 and (b) NO
on various surface alloys nMx/Pt(111) and the selectivity for oxidation
Chapter 1
Introduction to Automotive
Catalysts
Automotive catalysts were designed to mitigate the exhaust from the tailpipe of au-tomobile. They have been one of the greatest successes of heterogeneous catalysis over the last three decades, having brought a tremendous benefit to our air qual-ity. Driven by more and more stringent emission regulations, the field of automotive catalysis will perpetually stay at the very edge of technology. Research and develop-ment of this field mainly focuses on two directions: upstream direction of power plant applications, such as fuel cell vehicles, and downstream applications, such as exhaust emissions aftertreatment. The latter is especially important for the development of fuel efficient, lean-burn vehicles, both diesel and spark-ignited. In this study, we will focus on the downstream direction.
1.1 Automotive catalysts exhaust control systems
The automotive catalyst exhaust system controls: (1) the partial combustion product-carbon monoxide (CO), (2) the residual uncombusted hydroproduct-carbons (HC), (3) nitro-gen oxides (NO,), and (4) particular matter (PM). Among those, CO and HC are converted under oxidizing conditions (with excess air) while NO_ is reduced to N2
conversion efficiency for the three species (1, 2, and 3) as a function of the air/fuel ratio. Figure 1-1 shows that the conversion efficiency of the oxidation reactions (re-moval of CO or HC) increases with the increase of the air/fuel ratio, while that of the reduction reactions (removal of NO_) decreases with the increase of the air/fuel ratio. (Shelef & McCabe, 2000) Therefore, only when the air/fuel ratio is controlled sufficiently close to the stoichiometric value (around 14.7), can all three pollutants be converted (essentially to CO2, H20 and N2) with high efficiency over a single
cata-lyst. (Gross et al. , n.d.) The three-way automotive catalyst (TWC) operates at this value of air/fuel, being a combination of platinum, palladium, and rhodium, in which, rhodium is introduced especially for reduction of NO. However, operating TWCs at stoichiometry precludes taking advantage of operating the vehicle under lean condi-tions, a condition with a large excess of air, where there is an opportunity to improve the fuel economy due to lower pumping losses, higher ratio of the constant-pressure to constant-volume specific heats of the burnt gas, and reduced heat loss to the walls of the combustion chamber. As shown in Figure 1-1, the main challenge for lean condition operation is how to remove the NOx from an exhaust stream containing a
large excess of oxygen.
1.2 NOx control under lean condition
Two possible ways to enhance the efficiency of NO, removal under lean conditions have been developed: (1) selective catalysis, in which NO, can be reduced by a reductant, present in the exhaust or added deliberately (Shelef, 1995) and (2) NO, traps which can store NO. for a period of lean operation followed by a short duration catalytic, reductive purging of the stored NO_ to N2. (Takahashi, 1995) However,
catalyst poisoning due to sulfur compounds coming from sulfur in the fuel presents a major challenge, intractable thus far, to development of many of these advanced technologies. (Shelef & McCabe, 2000) We discuss the details below.
Oxidation:
CO+iO
2 2-CO
2(HC)
+
0
2
-->
H
2
0
+ C0
2Reduction:
NO+CO -+N
2
+CO
2
NO+H
22 N
2+H
20
Figure 1-1: Conversion efficiency of CO, HC, and NO_ vs. Air/fuel ratio.
1.2.1 Selective Catalysis Reduction (SCR) technology
Background on SCR technology
"Selective" is used here because the catalytic reduction of the NOs with a reductant occurs preferentially to the oxidation of the reductant with oxygen. (The commonly used reducing agents are anhydrous or aqueous ammonia NH3 and aqueous urea
CO(NH2)2.) Therefore, it allows the NO. reduction reaction to take place in an
oxidizing atmosphere. The choice for the type of catalyst is determined by the tem-perature of the exhaust environment. A problem with SCR technology is that the selectivity is not as yet adequate (Shelef, 1995) and the unfavored reducing agents (ammonia or urea) are needed. Another important but unsolved issue is the cata-lyst poisoning by the sulfur in the exhaust, which originate in the fuel. This will be discussed in the next subsection.
Impact of fuel sulfur on SCR technology
In order to cover a wide operating temperature range while still maintaining the high NO. conversion efficiency, an SCR technology which is effective at temperature below 250°C will be needed. However, these SCR systems are very sensitive to sulfur at those low temperatures. Another adverse effect of sulfur when using SCR is the potential to form ammonia sulfates, which can then deposit on the catalyst surface.
1.2.2 Lean NO. traps (Adsorbers)
Background on lean NO. traps
Another prospective method to remove NO. from the lean exhaust is to use a NO, trap. The idea of this method is illustrated in Figure 1-2. With this technology, shown in Figure 1-2, NO is catalytically oxidized to NO2 and then stored on a chemical trap,
usually made of barium or calcium oxides, as nitrates under lean conditions. Then, the system is temporarily switched to a short period of rich conditions, the stored NO. being reduced to nitrogen and released. NO. trap technology, therefore, can only be called a partial lean-burn strategy, since a periodical brief operation under rich conditions is required to remove the stored NO,. However, the fuel economy penalty due to the occasional short duration of rich operation can be offset by a gain in the conversion efficiency of NO. at the maximum fuel economy.
Impact of fuel sulfur on lean NOx traps
Given the similarities in the chemical properties of gaseous sulfur and nitrogen oxides, the NO, trap is extremely sensitive to sulfur poisoning. As mentioned in the last subsection, the material used for NOx traps is usually a basic oxide, such as BaO or CaO, which adsorb the acidic oxides of nitrogen. They adsorb not only the oxides of nitrogen, but also the oxides of sulfur. More specifically, shown in Figure 1-3, SO2
from the sulfur in the fuel can catalytically react with oxygen to form S 3. (The Pt particles incorporated within the trap promote the oxidation reaction of SO2 to
1 .. n 0 30 Time (s)
rich
lean I>
7
®
N.0
0LI-L
FrCIlAl "
Figure 1-2: Illustration of processes of NOx removal with the lean NO, trap
technol-ogy.
BaSO4). Because the thermodynamic stability of the surface sulfates is considerably
higher than that of the surface nitrates, the stable sulfates can not be decomposed during the purging cycles and, thus, render the adsorbing capabilities of the NO. trap ineffective. In addition, SO3 can also be catalytically converted to sulfate in the exhaust stream resulting in higher particulate emissions.
There are several possible approaches to solve the sulfur poisoning problem and realize a wide implementation of lean NO, trap technology: (1) restrict the sulfur content in the fuel to a very low level, (2) make the trapping materials more selective to NO2adsorption, and (3) search for new selective catalysts active in the oxidation of
NO to NO2 and relatively inactive in the oxidation of SO2 to SO3. (Shelef & McCabe,
2000) The last one is the main goal of this thesis.
1.3
Current approaches for catalyst design
It is well known that the catalytic properties of alloys are often superior to those of pure metals because of either the electronic effect (due to the change in electronic
lean
Ilean
A1,0,
A YFigure 1-3: Illustration of the impact of sulfur from the fuel on the lean NOs trap.
structure) or the ensemble effect (due to the change in distribution and availability of surface reaction sites) or both. (Sachtler, 1973) But so far, most heterogeneous catalysts are designed via continual incremental improvements of existing catalysts. The incremental improvements are made by applying heuristics and rules of thumb to change existing catalysts and then testing these changes empirically until better catalysts are found. In many cases, this approach has been effective. For example, TWCs, based on supported Pt, Rh, and Pd together with ceria and other additives have been continually improved since the 1970's and are one of the great triumphs of catalyst design. They have led to much less pollution in the air in all cities in which they are installed in automobiles. However, a major problem with the incre-mental design approach is that further improvement is very hard, because decades of implementation of this approach has led to catalysts that are near their limit of optimization, and this approach does not lead to the ability to propose completely
new catalysts, such as alloys.
Another, more recent approach to catalyst design is the combinatorial approach. In this approach, many catalyst formulations are synthesized and tested rapidly in order to optimize catalyst properties. This is an important approach but is limited
by the speed of the combinatorial search. The parameter space of the search is necessarily limited, and the combinatorial approach itself, cannot propose which part of parameter space to choose. For example, to choose bimetallic catalysts from 20 metals with 5 proportions of the metals, a researcher would have to perform (20 x
19 2 X 5) = 950 combinations. Certainly, it would be desirable to be able to propose a priori more limited ranges of compositions to explore.
Fortunately, there is an alternative approach- rational catalyst design based on the relationships between the intrinsic properties of materials and their catalytic activities by using molecular simulations. To the best of our knowledge, this approach has led to the design of only one new catalyst, a non-coking steam reforming catalyst by N0rskov et al. (Besenbacher et al. , 1998) This catalyst design was based on the ensemble effect, adding a dopant to the surface to prevent nucleation of carbon material without affecting steam reforming.
In this thesis, N0rskov's ideas will be used as a spring board to design new auto-motive catalysts based on molecular simulations.
1.4 Goal and objectives
The goal of this thesis is to design a new selective, sulfur resistant, oxidation auto-motive catalyst, which can be active for the oxidation of NO to NO2 but relatively
inactive in the oxidation of SO2 to S 3. Molecular simulations are employed for this
purpose. Specifically, the objectives of this thesis are to:
1. Identify surface structures on the surface phase diagram of O/Pt(111) and rate limiting steps.
2. Develop and verify a generalized electronic composition-property relationship which can be applied to a complex adsorption system.
Chapter 2
Computational Methods
In this chapter, the principles of the methodologies that are employed in this thesis are briefly summarized.
2.1 Overview of total energy calculations
Nearly all physical properties are related to total energies or to differences between total energies of matter. The matter can be in the gas phase, or in a condensed phase; it can be solid liquid or amorphous, homogeneous or heterogeneous (molecules in solution., interfaces, adsorbates on surfaces). For example, at zero K, the equilibrium lattice constant of a crystal is the one that minimizes the total energy. Therefore, if total energies can be calculated, any physical property related to a total energy or to a difference between total energies can be determined computationally. To do that, we can unambiguously describe the system as a number of nuclei and electrons interacting through Coulombic forces by a Hamiltonian in the following general form:
PA
2 N 2 P N1
P NfI__H-'~
-E-
2
hV2 +
ZZ
J+1
Ej
i=2MI I-
2
v +~ JRi- Rl
+JR ri
H
1M1.i=1
I<J
i<j
I
ri
-rjl
I=1 i=1
I
(2.1)
Where R={RI}, I=1...P, is a set of nuclear coordinates, and r={ri}, i=1...N, is a set of electronic coordinates. Z and MI are the nuclear charges and masses, respectively. Atomic units are employed here. The length unit is the Bohr radius a(=0.5292
A);
the charge unit is the charge of the electron, e; and the mass unit is the mass of the
electron, m.
Eq. (2.1) can be written in a more compact way as:
HT = n + Te + V nn+ Vee + ne
(2.2)
Each item in Eq. (2.2) corresponds to that in Eq. (2.1). Tn and Vn are the kinetic and potential nuclear operators. Te is the kinetic operator of electrons. Vee is the electron-electron interaction. Vne is the nuclear-electron interaction.
In principle, all the properties can be derived by solving the many-body Schrddinger equation in Eq. (2.3) (where (R,r) is the many-body wave function). However, in practice, this problem is intractable. Therefore, simplifying assumptions and approx-imations are necessary to describe the electronic structure of molecules and solids, but they still should be able to preserve accuracy to an acceptable level. These simplifications and approximations are summarized in the following sections.
HPT(R,
r) = E(R, r)
(2.3)
2.2 Born-Oppenheimer approximation
Because of the large difference in mass between the electrons and nuclei, the time scale associated with the motion of the nuclei is much shower than that associated with the motion of the electrons. Therefore, the nuclei can be treated adiabatically, leading to a separation of electronic and nuclear coordinates in the many-body wave function, as shown in Eq. (2.4), where i can be any electronic Eigenstate. Eq. (2.4) is the so-called Born-Oppenheimer (B-O) approximation. This approximation reduces the many-body problem to the dynamics of electrons in some frozen-in configuration of the nuclei, as expressed in Eq. (2.5).
(Te + Vee + Vne
) i (R, r) = Ei ci (R,
r)
2.3 Density functional theory (DFT)
2.3.1 Electron-electron interactions
Even with B-O approximation, the many-body problem still remains formidable. One of the most difficult aspects is caused by the need to take into account the effects of the electron-electron interactions (Vee in Eq. (2.2)). This includes electron-electron repulsion, due to Coulomb interaction (VH in Eq. (2.6)), and electron exchange and correlation energy (Vxc in Eq. (2.6)). As we know, the wave function of a many-electron system must be antisymmetric, because many-electrons are Fermions. The ex-change energy is the reduction of the Coulomb energy of the electronic system due to the antisymmetry of the wave function, which causes a spatial separation between electrons with the same spins. It can be included in a total energy calculations by the Hartree-Fock approximation. The correlation energy is defined as the difference between the energy in the Hartree-Fock limit and the exact nonrelativistic energy of a system. The challenge is to calculate accurately the exchange and correlation energies. The current state-of-the-art and widely used methodology that allows for
modeling the the electron-electron interactions with minimal simplifying assumptions is density functional theory (DFT). (Hohenberg & Kohn, 1964; Kohn & Sham, 1965)
Vee VH + VXC
(2.6)
2.3.2 Hohenberg-Kohn theorems
The two main theorems that serve as the foundation of DFT were proved by Hohen-berg and Kohn in the early sixties. (HohenHohen-berg & Kohn, 1964) The first one says that the total electronic energy, including exchange and correlation, of a system in the ground state is uniquely determined by the electron density. This theorem thus establishes the existence of a functional that maps the electron density into energy.
However, it does not provide the explicit form of the functional. The second one states that the exact electron density minimizes the electronic energy and also provides a variational principal to solve for the electron density, and hence energy.
2.3.3
Kohn-Sham energy functional and equations
Combining Eq. (2.2), Eq. (2.6) and Hohenberg-Kohn theorems, the Kohn-Sham total energy functional for a set of electronic states
4'i
can be written as:E
KS[fv,=-2 ,|
4*V24bdr+Vn(r)n(r)dr+
J
||
r1(r')
drdr'+Exc[n(r)]
(2.7)where En is the static total electron-nuclear (or ion) potential. All of the items in Eq. (2.7) are functions of electron density n(r) as given in Eq. (2.8). Notice that the energy associated with nuclear repulsion is not a function of electron density and can be added to the total energy as a constant for given nuclear positions.
n(r)
= a
i(r)
12
(2.8)
i
A set of wave functions Oi/ that minimize the Kohn-Sham energy functional in Eq. (2.7) can be obtained by the self-consistent solutions to the Kohn-Sham equations in Eq. (2.9) (Kohn & Sham, 1965):
[-2
+ n(r) + VH(r) + Vxc(r)]4'j(r) = /(r)
(2.9)
2where VH is the Hartree potential of the electrons:
VH(r)
=
f
(r)
dr'
(2.10)
Vxc is the exchange-correlation potential given by:
Vxc
aExcn(r)]
9
c(r)=
(2.11)
The Kohn-Sham equations in Eq. (2.9) allow one to map the interacting many-electron system onto a system of non-interacting electrons moving in an effective potential due to all the other electrons.
2.3.4 Approximations for describing the exchange-correlation
energies
The calculation of exchange-correlation energies is nontrivial. Many functionals have been developed for better describing the exchange-correlation energies in recent years.
Local D)ensity Approximation-LDA
LDA uses the form of the exchange-correlation functional for a homogeneous electron gas. For Vxc[n(r)]= x[n(r)]+/c[n(r)], LDA has the exchange term adopted the form deduced by Dirac (Dirac, n.d.):
3 3
Vx [n(r)] -- ()1/ 3 n(r)/ 3 (2.12)
4
rwhile the correlation term Vc[n(r)] can been determined from quantum Monte Carlo simulations. (Ceperley & Alder, 1980) LDA is successful in many systems, especially those where the electronic density is quite uniform, such as bulk metals. However, LDA fails in a number of situations, including the metallic surfaces, because the XC potential decays exponentially, whereas it should follow a power law.
Generalized Gradient Approximation-GGA
GGA is an improvement over LDA, in which not only the local electron density is considered but also the gradients in the electron density. Previous studies in our group have tested and confirmed that the Perdew-Wang '91 (PW91) GGA functional (Perdew et al., 1992) works well for our systems (Lin et al. , 2001; Lin et al. , 2002;
Lin et al. , 2004a). The form of this exchange functional is: (Perdew & Wang, 1991)
Vx vLDA(
1 +alssinh-l(a
2s) + (a
3+ a
4e-10°°S
2)s2
)
VLDA 1 +
alssinh-
(a2s) + a5s4(2.13)
1~~~~~~~~~~~ +for
where a1=0.19645, a2=7.7956, a3=0.2743, a4=-0.1508, a5=0.004, and s = for
kF
= (3ir
2n)
1/
3The PW91 correlation functional is given by: (Perdew & Wang, 1991)
Vc
=
CD+ n(t,
r,)
(2.14)
withH
=Ho
+ fH1, where,Hor~g~ln[2+
t
2+
At
4=
932
ln[1+ 1+
±At2
+
A2t4
]
(2.15)
2a 0 1 +
At24
ks
22
Zl _ y[C~l~s_ CcO) _3Cx 3t212 H1 =v[C,(r
8)
-Cc
- ]gtexp[-100g4( t2] (2.16) 7 kF g (1+()2/3+(1-)2/3 t = Vnlk
- (4kF)1/2 2 2gksn,-a
=0.09,
/
=vCc(0), v
= 16(37 2)1/3, Cc(0) =0.004235,
Cx
=-0.001667,
2a I A = - exp[2AJ ] (2.17)Q'x
[ g3132 ] - 1In summary, DFT can be used to determine the ground state energy and the elec-tron density while bypassing the calculation of the elecelec-tronic wavefunctions. The solu-tion is achieved variasolu-tionally, by changing the electron density and solving for the elec-tronic energy iteratively until the energy is minimized for a given configuration. The
absolute error in these calculations is on the order of several kcal/mol; however, cancel-lation of errors allows for very accurate determination of relative energies. In this
the-sis, all the calculations are performed by using Dacapo (http://www.fysik.dtu.dk/CAMP/dacapo.htr n.d.), a well established total energy code based on DFT, developed by N0rskov and
2.4 Periodic supercells
After the approximations in the previous two sections, it is still impossible to handle an infinite number of noninteracting electrons moving in the potential of an infinite number of nuclei or ions. This issue can be solved by applying Bloch's theorem to the wave functions of a periodic system.
2.4.1 Bloch's theorem
The ions in a perfect crystal are arranged periodically (at OK). Therefore, the external potential, which acts on the electrons will also be periodic. That is, V(r) = V(r + 1), where is a lattice vector of the crystal (the length of the unit cell).
Bloch's theorem uses the periodicity of a crystal to reduce the infinite number of one-electron wavefunctions to simply the number of electrons in the unit cell of the crystal. The wavefunction is written as the product of a wavelike part and a periodic cell part: (Aschcroft & Mermin, 1976)
oi(r) = exp[ik. r]fi(r)
(2.18)
The second term is the periodic cell part. This can be expressed by expanding it into a finite number of plane waves, the wave vectors of which being reciprocal lattice vectors, G, of the crystal, (G.
1
= 27rm, wherem
is an integer.)fi(r)
= E
Ci,cexp[iG
.r]
(2.19)
G
Therefore, by submitting Eq. (2.19) into Eq. (2.18), each electronic wavefunction can be written as a sum of plane waves,
i (r)
= E ci,k+Gexp[i(k + G) .r] (2.20) G2.4.2 k-point sampling
By the use of Bloch's theorem, the problem of the infinite number of electronic wave functions has now been changed into the problem of calculating a finite number of wave functions at an infinite number of reciprocal space vectors within the first Brillouin zone. The first Brillouin zone can be mapped out by a continuous set of points, {k k = (kx, ky, kz)}, throughout that region of reciprocal space (k-space). The occupied states at each k-point contribute to the electronic potential of the bulk solid. Since the set k} is continuous, there are an infinite number of k-points in the Brillouin zone. Therefore, in principle, an infinite number of calculations are needed to compute this potential. However, the electronic wavefunctions at k-points that are very close together will be almost identical. It is therefore possible to represent the electronic wave functions over a region of reciprocal space at a small number of k-points. The error incurred by this approximation can be made arbitrarily small by choosing a sufficiently dense set of k-points.
Methods have been devised for obtaining very accurate approximations to the electronic potential from a filled electronic band by calculating the electronic wave functions at special sets of k-points. The two most common methods are those of Chadi and Cohen (Chadi & Cohen, 1973) and Monkhorst and Pack (Monkhorst & Pack, 1976). The method by Monkhorst and Pack is used in the course of this work. It can yield not only the sets of points identical to those given by Chadi and Cohen's method, but also additional sets with the same properties. It is based on generating a set of periodic functions which are orthonormal on a uniformly spaced set of special points in the Brillouin zone (refer to Eq. (2.21)).
1 P(q)
Smn(q) =
3
E jAm(kj)An(kj)=
mn (2.21)j=l
where, q is an integer that determines the number of special points in the set. P(q) is the symmetry-dependent number of points, j, from the set of points in the irreducible wedge of the Brillouin zone. w is the weight associated with kj and is simply the
ratio of the order of the entire point group to the order of the group of the wave vector at kj. For example, if kj is a general point in the (1,1,1) direction of the simple-cubic
lattice, wj -= 48/6 = 8.
2.4.3 Plane wave basis sets
The electronic wave functions at each k-point are now expressed in terms of a discrete plane wave basis set. In principle, this Fourier series is infinite. However, the coef-ficients Ci,k+G for the plane waves with a smaller kinetic energy 2 -k
+ Gl
2typically
have a more important role than those with a larger kinetic energy. Therefore, we can only include the G vectors with kinetic energies lower than a maximum cutoff energy Ecut ( k + Gl2 < Ecu). The introduction of a plane wave energy cutoff reduces the basis set- to a finite size.
This kinetic energy cut-off will lead to an error in the total energy of the system, but, in principle, it is possible to make this error arbitrarily small by increasing the size of the basis set by allowing a larger energy cut-off. The cut-off that is used in practice depends on the system under investigation. The Ecut used in this thesis is
25 Rydbergs.
Another advantage of expanding the electronic wave functions in terms of plane wave basis sets is that the Kohn-Sham equations take a particularly simple form. Substitution of Eq. (2.20) in to the Kohn-Sham equations, Eq. (2.9), gives:
S
I k+G2GG +1, (G
G')
+
f/H(G- G')+ lxc(G-G')]Cik+G
= EiCi,k+G (2.22)G'
It can be seen in this form that the reciprocal space representation of the kinetic energy is diagonal and the various potentials can be described in terms of their Fourier transforms. A usual method of solving the plane wave expansion of Eq. (2.22) is by diagonalization of the Hamiltonian matrix whose elements Hk+G,k+G' are given by the term in the brackets above. It follows that the size of the Hamiltonian matrix
is determined by the energy cut-off 2 k + GI 2. This matrix size can be intractably
be overcome by the use of the pseudopotential approximation, described in the next section.
2.5 Pseudopotential approximation
2.5.1 The idea of pseudopotential approximation
It is well known that most physical properties of solids are dependent on the valence electrons to a much greater degree than that of the tightly bound core electrons. For this reason, the pseudopotential approximation is introduced. In this approximation, the core electrons and the strong nuclear potential are removed and replaced with a weaker pseudopotential, which acts on a set of pseudo wave functions, rather than the true valence wave functions.
The schematic diagram in Figure 2-1 shows these functions. The valence wave functions oscillate rapidly in the region occupied by the core electrons because of the strong ionic potential. These oscillations maintain the orthogonality between the core and valence electrons. The pseudopotential is constructed in such a way that there are no radial nodes in the pseudo wavefunction in the core region. Moreover the pseudo wave functions and pseudopotential are identical to the all-electron wave function and potential outside the cut-off radius (re in Figure 2-1). This condition has to be carefully checked as it is possible for the pseudopotential to introduce new non-physical states (so called ghost states) into the calculation.
The pseudopotential is also constructed such that its scattering properties for the pseudo wave functions are identical to those of the ion and core electrons for the valence wave functions. In general, this will be different for each angular momentum component of the valence wave function. Therefore, the pseudopotential must be angular momentum dependent. Pseudopotentials with an angular momentum depen-dance are called non-local pseudopotentials.
r
Figure 2-1: Schematic illustration of the all-electronic (AE) wave function and elec-tronic potential (Z/r) (solid lines) vs. distance from atomic nucleus, r. The corre-sponding pseudo wave function and pseudopotential are also plotted (dashed lines). The radius at which all-electron and pseudoelectron values match is marked r.
2.5.2 Vanderbilt's ultrasoft pseudopotential
A pseudopotential is not unique, and several methods of generation exist. The one used in this thesis is called Vanderbilt's ultrasoft pseudopotential (PP), which has a separable form well suited for plane-wave solid-state calculations and transition-metal systems. (Vanderbilt, 1990; Laasonen et al., 1993)
In Vanderbilt's ultrasoft PP scheme, the total energy of valence electrons, de-scribed by the wave functions, Xi, can be written as:
Etot
=
E()m--2
+VNLIkm)+J vlc(r)n(r)dr+
J
f
-)()drdr'+Exc[n(r)]
(2.23)
Different from Eq. (2.7), the PP contains both a local part, V.° c= EI VZW°c(r -RI ), and a nonlocal part, VNL =
EijI
Dj)4I/3)(/3JI, where the function, /I = i(r- RI),as well as the coefficients D(° ), characterize the PP.
The electron density in Eq. (2.23) is given by:
n(r)
E[qlm(r)
2+ E
Qij(¢mlI)(I¢m)]
(2.24)
m ij,I
where Q, (r) = Qj (r- RI) is the augmentation function, localized in the core regions and also part of the PP. Therefore, the electron density in Eq. (2.24) is now separated into two parts: a soft delocalized contribution given by the squared moduli of the wave functions and a hard contribution localized at the cores. The ultrasoft PP is fully determined by the qualities VC°c, D ), Qij(r) and Oi(r).
2.5.3 Generation procedure of Vanderbilt's ultrasoft PP in
literature
As usual, the generation of Vanderbilt's ultrasoft PP also starts with the all-electron calculations on a free atom in some reference configuration, leading to a screened
potential VAE using the Schrddinger equation:
[T
+ VAE(r)]Oi(r) = iOi(r) (2.25)Here, i is a composite index, i={eilm}, and T is the kinetic-energy operator.
Next, cutoff radii r are chosen, and for each
4i
obtained above, a pseudo wave function i is constructed, subject only to the constraint that it joins smoothly to ?/iat rI. A smooth local potential Vlo(r) is also generated in such a way that it matches
VAE(r) at r and r,. Then, local orbitals, Xi) = (- T-
Vo
)Iqi), are formed. (Theyvanish beyond r where Vo = VAE and i = i.)
Define Bij = (ilX j). Now, the quantities needed to specify the PP are: Qij(r) =
¥*(r)¢j(r) -
(r)Oj(r), /13i)
= j(B-1)ijJXj).
Let qij = (ikJb3)R- (il 3)R, where R is a diagnostic radius, which is chosen large
enough that all pseudo- and AE quantities agree at and beyond R. q3i) obeys the following secular equation:
(T + Vc +
EDiJli) (l)lIi) = ei(1
~iin~~~~
+
E
ij
qi3i)
(3jl)li)
(2.26)
where )ij Bj + ejqij3.
Therefore, by a "descreening" procedure, we can obtain
Vl°Oc(r) = Vo(r)- Ir - ,d r ' - exc(r) (2.27)
D?
)= D
-f
Vo~(r')n(r')dr'
(2.28)
The PP generated in the procedure above obeys the criteria that any method should follow. These are: (1) The core charge produced by the pseudo wave functions must be the same as that produced by the atomic wave functions. This ensures that the pseudo atom produces the same scattering properties as the ionic core. (2) Pseudo-electron eigenvalues must be the same as the valence eigenvalues obtained from the atomic wave functions. (3) Pseudo wave functions, as well as their first and
second derivative, must be continuous at the core radius and also be non-oscillatory.
2.6 Minimum Energy Paths and the Nudged
Elas-tic Band method
In order to understand chemical and physical processes occurring in a complicated system, it is useful to find a Minimum Energy Path (MEP) connecting two local min-ima on the potential energy surface of a system. The transition state of the reaction corresponds to the saddle point along this path. Many computational methods have been proposed to find the MEPs. (Elber & Karplus, 1987; Czerminski & Elber, 1990; Choi & Elber, 1991; Ulisky & Elber, 1990; Olender & Elber, 1997; Weinan et al., 2002; J6nsson et al., 1998; Henkelman & J6nsson, 2000; Henkelman et al. , 2000; Maragakis et al. , 2002; Chu et al. , 2003) A very popular one is the Nudged Elastic Band (NEB) method. (J6nsson et al., 1998) The NEB method is based on the chain-of-states representation of a path. (Elber & Karplus, 1987) It determines the MEP by creating intermediate images along the path that represent replicas of the original system. Spring constants between the adjacent images are added to insure the conti-nuity of the path. By minimizing the force along the path (tangential direction) and perpendicular to the path, the band will be converged to the MEP. Thus, the NEB method has provided a framework to search for a MEP and the saddle point. It has been widely applied to surface reactions and diffusion processes on surfaces. (Eichler & Hafner, 1999; Ciobica et al. , 2000; Ciobica & van Santen, 2002; Fordell et al. 2002;
Trushin
et al. , 2002; Xu & Mavrikakis, 2002; Lin et al. , 2004b) Therefore, this thesis also uses the NEB method to find the MEPs.More details about NEB are given in this paragraph. First, let a string of images be denoted by
[ro, r,
r2, ..., rN], where the endpoints are fixed as the initial (ro)optimization algorithm. The objective function is:
N N-1
S(io,
...
,
iN) =
E
V(i) + E
k(A
li-
1)
2(2.29)
i=1 i=O
where Ali is defined as the distance between replica i-1 and i, Al is the average distance between replicas. Then, minimize the objective function with the respect to the intermediate images, r,..., rN. This mimics an elastic band, strung between two fixed endpoints, made up of N beads and N-1 springs with the spring constant k (in Eq. (2.29)).
The problem with this is that the elastic band tends to cut corners and gets pulled off the MEP by the spring forces in regions where the MEP is curved. Also, the images tend to slide down towards the endpoints. Both problems can be solved by a force projection, the so called "nudging". To do this, a tangent vector, T, along the path
has to lbe defined for each replica. The forces on each replica in the framework of NEB can then be written as:
F = F' + FJ
A
(2.30)F
=
-VV (1 - (q)
(2.31)
N-1
Fi
=
(
-=
2k(Ali - Al))
(2.32)
i=1
where -': is the force component in the off-path direction (perpendicular to the tangent direction) and comes only from the potential energy instead of the elastic bands. il is the component in the tangent direction, and comes only from the elastic bands. As we can see in Eq. (2.31), in the off-path direction, the spring forces do not interfere with the true forces. This prevents the corner-cutting problem. Similarly in Eq. (2.32), the true forces also do not compete with the spring forces along the tangent direction, which cures the sliding-down problem. Therefore, a stationary point under the NEB forces is a MEP.
It is also important to eliminate the rigid body translation and rotation of the
between replicas in the root-mean-square (RMS) best-fit space. (Chu et al. , 2003) Furthermore, to ensure that the true saddle point is obtained, the climbing image (CI) algorithm (Henkelman et al., 2000), which is a slight modification of NEB, can be utilized. In the CI calculation, an image with the highest energy is selected after several iterations. For this image, other than including the perpendicular projection of the force, the inverse of the tangent component of the force is also included, instead of the spring force. Therefore, this intermediate image will move down on the potential energy surface to the MEP in the perpendicular direction and up in the direction of the reaction coordinate. As a result, this method insures rigorous convergence to the saddle point without any significant increase in the computational cost.
2.7 Monte-Carlo simulations
Chapter 3 of this thesis uses Monte Carlo methods to simulate the surface phase diagram of O/Pt(111). Different oxygen adsorption configurations are sampled with the probability given by (Landau & Binder, 2000):
exp(-Hs/kBT) (2.33)
Z
where s is a particular state that a system is in, kB is Boltzmann's constant and Z is the partition function with the form:
Z
=
Eexp(-HS/kBT)
(2.34)
This is achieved by a Markov chain of configurations, where each configuration can be derived from a previous one with a proper transition probability, due to Metropolis.
The simulation starts with an arbitrary configuration which is composed of an array of lattice sites with the occupation variable +1 (occupied) or -1 (unoccupied). A new configuration is generated by selecting sites and changing their occupation variables from +1(-1) to -1(+1) according to a pre-established rule in which a tran-sition probability w(i f) is compared to a random number between 0 and 1. i
represents the initial state, and f corresponds to the state after the transition. The
criterion for the transition is the following:
If E(Jf) < E(j),
(i - f) = 1 (2.35)
If E(Yf) > E(6),
w(i
f) =exp(- E(df)
-E(6z)
(2.36)
kBT
where 1E(a) is the grand canonical energy of configuration a defined as
E(a) = H() -
UN
(2.37)
H is the enthalpy, p is the chemical potential, and N is the number of oxygen atoms in the simulation. If the transition probability is larger than a chosen random number, the new configuration 6f is accepted, otherwise, the previous one vi is kept.
Once converged, thermodynamic averages (i.e. the average enthalpy) can be ob-tained by
H -3 H5P (2.38)
Two types of simulations can be performed: (1) vary temperature T at a constant chemical potential u and (2) vary chemical potential p at a constant temperature T. At each fixed p and T, a large number of configurations are sampled with the Metropolis algorithm. Usually, about 4000-6000 MC steps are necessary for our sys-tem to obtain the convergence after the equilibrium.
The phase transitions can be characterized by discontinuities or divergences of thermodynamic potentials. For example, first order transitions will have a disconti-nuity in enthalpy H vs. temperature T or coverage x vs. chemical potential P; contin-uous phase transitions will have a divergence in the heat capacity (Cp in Eq. (2.39))
or susceptibility (X. in Eq. (2.40)) vs. chemical potential.
H (H2) -
(H)
2(2.39)
kBT2
x
_(N
2) - (N)2(2.40)
Chapter 3
Phase Diagram of Oxygen
Adsorbed on Platinum(111)
A complete phase diagram of oxygen atoms adsorbed on a Pt(111) surface with oxygen coverages below half a monolayer has been computed for the first time, and compared with the surface phase diagrams of related systems. Effective interaction parameters of a lattice model for the triangular lattice of the fcc sites of the Pt(111) surface were determined from first principles computations. Oxygen forms on the platinum(111) surface two stable ordered phases, which persist up to high temperatures. They are the p(2x2) and p(2x1) phases, having coverages of 1/4 and 1/2 monolayer respectively. At the coverage of 2/5 monolayer, another stable phase consisting of p(2x1) rows but with every two rows offset by an empty site is predicted by our model, but this phase is stable only below 250 K. All three phases undergo continuous phase transitions to the disordered state upon heating. At coverages lower than 1/4 monolayer and at low temperatures, oxygen atoms cluster into p(2x2) islands, in agreement with observa-tions from an STM study. The formation of p(2x2) oxygen islands is a consequence of attractive third nearest neighbors interactions, despite strong repulsion between the first and second nearest neighbors. Two regions separated by first-order phase boundaries are found at coverages between 0.26 monolayer and 0.37 monolayer and coverages between 0.43 monolayer and 0.5 monolayer.