HAL Id: hal-00925638
https://hal.uca.fr/hal-00925638
Submitted on 8 Jan 2014
HAL is a multi-disciplinary open access
archive for the deposit and dissemination of
sci-entific research documents, whether they are
pub-lished or not. The documents may come from
teaching and research institutions in France or
abroad, or from public or private research centers.
L’archive ouverte pluridisciplinaire HAL, est
destinée au dépôt et à la diffusion de documents
scientifiques de niveau recherche, publiés ou non,
émanant des établissements d’enseignement et de
recherche français ou étrangers, des laboratoires
publics ou privés.
DEM modeling of penetration test in static and dynamic
conditions
Quoc Anh Tran, Bastien Chevalier, Pierre Breul
To cite this version:
Quoc Anh Tran, Bastien Chevalier, Pierre Breul. DEM modeling of penetration test in static and
dy-namic conditions. POWDERS AND GRAINS 2013: Proceedings of the 7th International Conference
on Micromechanics of Granular Media, Jul 2013, Sydney, Australia. pp.225-228, �10.1063/1.4811908�.
�hal-00925638�
DEM modeling of penetration test in static and dynamic
conditions
TRAN Quoc Anh, CHEVALIER Bastien, BREUL Pierre
Clermont Université, Université Blaise Pascal, Institut Pascal, BP 10448, F-63000 Clermont-Ferrand, France CNRS, UMR 6602, Institut Pascal, F-63171 Aubière, France.
Abstract. Recent developments in dynamic penetration testing made it possible to measure a force-displacement
response of the soil during each single blow. Mechanical properties other than the classical tip resistance could be deduced and possibly linked to properties usually measured from model tests. However, the loading process implied in penetration test is highly non homogeneous and very different from those of laboratory model tests. It is then important to find out how to link the properties obtained from both kinds of tests. As a preliminary step in this process, a numerical model was built to reproduce penetration tests conducted in static and dynamic conditions. Two-dimensional Discrete Element Method, based on molecular dynamics was used. A rod was driven in a confined sample either with a constant velocity (static conditions) or by applying a blow on it (dynamic conditions). The magnitudes of rod velocity used in both static and dynamic conditions tests were similar. The model was validated based on the qualitative comparison between classical experimental results and numerical results. The repeatability of numerical tests was also checked in terms of tip resistance and volume deformations.
Keywords: Discrete Element Method; In-situ Testing; Penetration Test; granular material PACS: 83.80.Fg; 45.70.Vn; 81.70.-q
INTRODUCTION
In geotechnical engineering, penetration tests such as CPT, DCP, SPT, Panda are commonly used to determine the mechnical properties of soils.
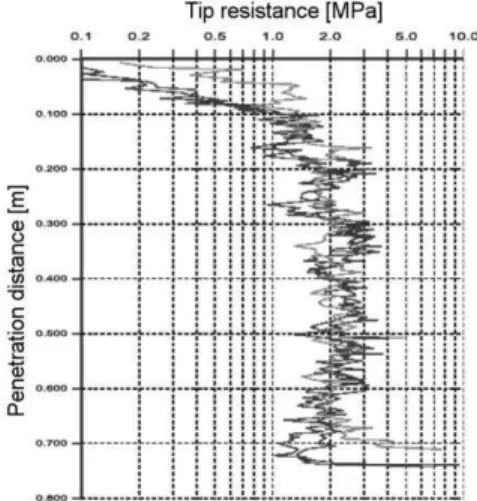
FIGURE 1. Experimental dynamic penetration test result
(Benz-Navarrete, 2009).
Recent developments in dynamic penetration tests made it possible to measure, for each blow, the force displacement response of the soil (Benz Navarrete, 2009). Additional mechanical parameters other than the tip resistance could be deduced from this response. However, due to the highly non homogeneous way of loading in penetration test, the relation between these parameters and classical mechanical properties of soils remains difficult to understand. It is important to focus
on the micro-scale mechanisms involved in order to evaluate their influence on the macro-scale parameters measured in dynamic tests.
Several authors investigated the mechanisms involved in penetration tests, and particularly for constant velocity penetration, called ‘static’ conditions. Discrete Element Method (DEM) was commonly used to model such tests in 2-dimensions (Huang and Ma, 1994; Huang and Hsu 2004; Calvetti and Nova, 2005; Jiang et al., 2006) and also in 3-dimensions (Benz-Navarrete, 2009; Arroyo et al., 2011; McDowell et al.; 2012). Few of them studied the penetration test in conditions other than ‘static’ conditions, even if a lot of penetration tests involved a rod driven by a series of blow, i.e. ‘dynamic’ conditions.
The penetration process involves the driving of several rods and a spike in the soil. This process results in very large deformation of the penetrated material. In ‘dynamic’ conditions, the duration of the blow of the hammer on the rods in very short of few milliseconds. DEM is particularly indicated to model such solicitation in granular material. In this study, molecular dynamics-based DEM was used (Cundall et al., 1979), with Itasca software PFC2D.
In this paper, a numerical model of penetration test was built with 2-dimensional DEM. to test samples of granular material. The purpose is to obtain a profile response of the sample under dynamic penetration as obtained classically in experimental conditions (Fig.1) and also a force displacement response for each blow (Fig.2). In order to validate the numerical model,
penetration tests in ‘static’ conditions were also conducted. Once validated, this model should be used to analyze the mechanisms of penetration in ‘dynamic’ conditions.
FIGURE 2. Force-displacement response during one blow
in dynamic penetration test (Benz-Navarrete, 2009).
NUMERICAL MODEL
The numerical model was made of a sample of 5 000 cylindrical particles with a length of, 4 mm, placed in a box with size of, 0.30 x 0.45 m. Particle diameters are equally distributed between maximal and minimal diameter presenting a ratio of, 2. Linear contact laws were used with normal and tangential stiffness of kn = 106 N.m-1 and ks = 0.75 x 10⁶ N.m-1.
Coulomb friction criterion was used between particles with a coefficient of, µ = 1.0. Nor local either viscous damping was used.
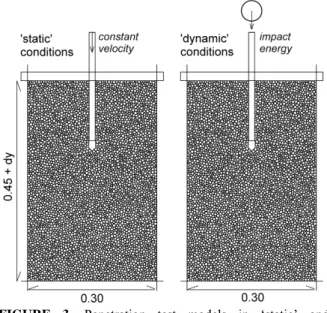
FIGURE 3. Penetration test models in ‘static’ and
‘dynamic’ conditions.
The model was prepared with two steps. First, the particles were progressively inflated without any friction or gravity until a minimal porosity of 0.155 was obtained. The sample was then stabilized under
gravity and final friction value before applying on its top surface a vertical confining pressure equal to 4 times the weight of the sample. At the end of the generation process, the ratio of horizontal to vertical stress was of, 0.5, which is close to the at rest earth pressure coefficient. The vertical confining pressure was assumed to represent an over height of material located above the sample. The effect of free surface could be eliminated (see Fig.1), and the number of particles reduced.
Penetration tests were conducted with a vertical rod with a spike at its bottom edge. The rod was driven vertically following two different ways: at constant velocity (‘static’ conditions) or by applying a blow at the top of the rod (‘dynamic’ conditions) (Fig.3). Friction coefficient was equal to 0.3 for the spike and to 1.0 for the top plate. Three different samples with different particle arrangements were tested (S1, S2 and
S3).
TESTS IN STATIC CONDITIONS
The penetration test was conducted on the three samples with a constant velocity of, 1.25 m.s-1. The tip resistance Fc vs. depth obtained for S1 is given on
Fig.4. Tip resistance Fc was steady in the sample and
the no free surface effects could be observed. Below 0.20 m depth, an oscillation of tip force could be observed due to the effect of the test box bottom.
FIGURE 4. Tip resistance vs. depth for sample S1 in ‘static’
conditions.
The density of probability of Fc between depth 0.05
and 0.20 m for the 3 samples is shown on Fig.5. A very good repeatability of the penetration test was obtained in static conditions. The average value of Fc
and its scattering were very similar from one sample to the other.
FIGURE 5. Probability density of Fc for ‘static’ conditions.
The penetration test in static conditions was well reproduced by the numerical model. With the vertical confining stress, it was possible to measure a steady tip resistance through the height of the sample. The same result is obtained in experimental test on homogeneous soils as soon as the testing depth is far enough from free surface.
TESTS IN DYNAMIC CONDITIONS
Before conducting a test in ‘dynamic’ conditions, a ‘static’ penetration of the samples was performed until a depth of 0.05 m was reached. Then, five blows were successively applied on the rod with an impacting ball. The energy transferred to the soil comes from the kinetic energy of impacting ball with a mass of, 0.5 kg an initial velocity of 1.25 m.s-1. The duration of the shock between impacting ball and rod was of, 2.2 ms; the peak value of the rod velocity was of 1.20 m.s-1. The magnitude of the rod velocity was then very close between ‘static’ and ‘dynamic’ conditions. The three samples were tested. The force displacement response obtained for one of the blows is shown on Fig.6.
FIGURE 6. Force vs. displacement for one blow.
The force - displacement response obtained with the numerical model was qualitatively close to the classical result obtained in experiments. Three phases could be observed: a loading phase for very small displacement, a plastic phase where the major part of deformation were observed, and an unloading phase where the rod stabilized.
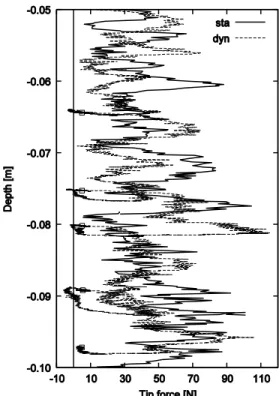
The curves of tip resistance vs. depth obtained in both static and ‘dynamic’ conditions are compared on Fig.7 for the sample S1. The magnitudes of tip
resistance obtained with both test conditions were very close. The response of particles to the two different solicitations was similar.
FIGURE 7. Tip resistance vs. depth for sample S1in ‘static’
and ‘dynamic’ conditions.
In order to compare more precisely the resistances obtained from both tests, a dynamic tip resistance Fd
was calculated for each blow, given by:
1
11
i i i i t df
t
e
t
e
t
e
F
(1)where e(ti) is the penetration distance and f(ti) resulting
vertical force between rod and particles at the time ti.
In the same time, a ‘static’ tip resistance Fc was
calculated for the range of depth corresponding to each blow. Figure 8 shows the values of Fd versus Fc for the
total of the 15 blows conducted. The correlation obtained was fairly good considering the scattering obtained in the responses of the samples to the solicitation.
FIGURE 8. Correlation between Fd and Fc (the dotted lines
represents the amplitude of standard deviation around the average point <Fc>,<Fd>).
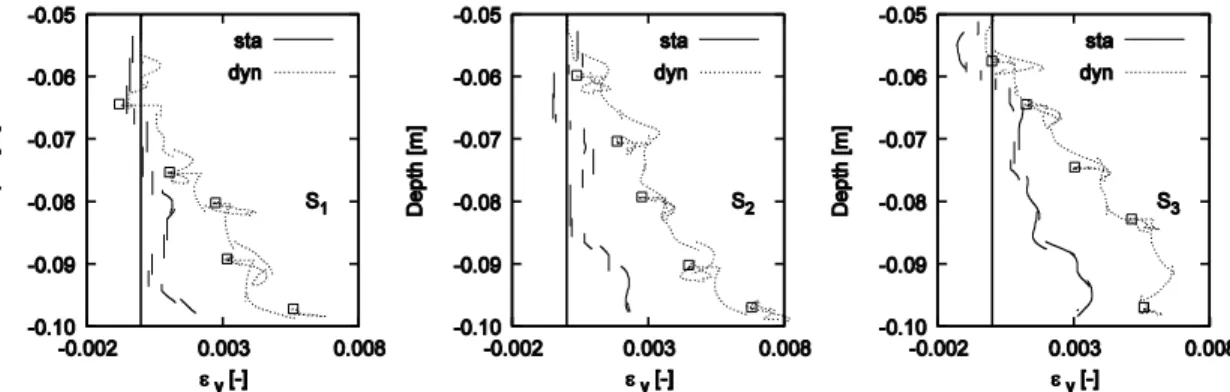
In terms of sample deformation, the volume variation of the sample during tests was computed in each case and compared between ‘static’ and ‘dynamic’ conditions (Fig.9). The penetration process resulted in a slight expansion of the samples. The expansion in dynamic conditions was more important than in static conditions.
CONCLUSION
In this paper, a discrete numerical modeling of penetration tests was proposed. The penetration was conducted with two different processes: at constant velocity on one side and with impact load of the rod on the other side. Both conditions were performed with similar magnitude of the rod velocity and several samples were tested. The results showed a very good repeatability of the tests and a revealed a material response close to what was expected, according to experimental results. The correlation between sample response in static and dynamic conditions was fairly good, in terms of tip resistance as well as volume deformation. The numerical model was considered validated from this point of view.
The direction of this research will be dedicated to the analysis of the mechanisms involved in the penetration process in dynamic conditions. The analysis should also focus on the interpretation of the force displacement response measured for one blow and on the mechanical properties extracted from its three phases. Finally, parametric study on the numerical model should be conducted to evaluate their influence on macro-mechanical properties.
FIGURE 9. Volumic strain of the sample during test for ‘static’ and ‘dynamic’ conditions for S1, S2 and S3.
REFERENCES
1. Arroyo, M., Butlanska, J., Gens, A., Calvetti, F. & Jamiolkowski,M. (2011). Cone penetration tests in a virtual calibration chamber. Géotechnique, 61(6), pp.525-531.
2. Benz Navarrete, M. (2009). Mesures dynamiques lors du battage du pénétramètre panda 2. PhD thesis, Université Blaise Pascal, Clermont-Fd II.
3. Calvetti, F. & Nova, R. (2005). Micro-macro relationships from DEM simulated element and in-situ tests. Proc. 5th Int. Conf. Micromech. Granular Media: Powders and Grains 2005, Stuttgart I, pp.245-250. 4. Cundall P. A., Strack O. D. L. (1979). A discrete
numerical model for granular assemblies. Geotechnique, 29(1), pp.47-65.
5. Huang, A. B. & Hsu, H. H. (2004). Advanced calibration chambers for cone penetration testing in cohesionless soils. In ISC-2 Geotechnical and Geophysical Site Characterization (Viana, A. & Mayne, P. W. (eds)). National Chiao Tung University: Millpress Science Publishers, pp.147-166.
6. Huang, A. B. & Ma, M. Y. (1994). An analytical study of cone penetration test in granular material. Can. Geotech. J. 31(1), pp.91-193.
7. Jiang, M. J., Yu, H.-S. & Harris, D. (2006). Discrete element modeling of deep penetration in granular soils. Int. J. Num. Anal. Methods Geomech. 30(4), pp.335-361. 8. McDowell, G. R., Falagush, O., Yu, H. S. (2012). A particle refinement method for simulating DEM of cone penetration testing in granular materials. Géotechnique Letters, Vol.2, Issue July-September, pp.141-147.