R eview Ar ticle Ar chitec tur e an d Human Be h a v io r E-mail: [email protected]
Achieving informed decision-making for net zero energy buildings
design using building performance simulation tools
Shady Attia1,2 (), Andre De Herde2, Elisabeth Gratia2, Jan L.M. Hensen3
1. Interdisciplinary Laboratory of Performance-Integrated Design (LIPID), École Polytechnique Fédérale de Lausanne, Switzerland 2. Architecture et climat, Université catholique de Louvain, 1348 Louvain La Neuve, Belgium
3. Building Physics and Services, Eindhoven University of Technology, The Netherlands
Abstract
Building performance simulation (BPS) is the basis for informed decision-making of Net Zero Energy Buildings (NZEBs) design. This paper aims to investigate the use of building performance simulation tools as a method of informing the design decision of NZEBs. The aim of this study is to evaluate the effect of a simulation-based decision aid, ZEBO, on informed decision-making using sensitivity analysis. The objective is to assess the effect of ZEBO and other building performance simulation tools on three specific outcomes: (i) knowledge and satisfaction when using simulation for NZEB design; (ii) users’ decision-making attitudes and patterns, and (iii) performance robustness based on an energy analysis. The paper utilizes three design case studies comprising a framework to test the use of BPS tools. The paper provides results that shed light on the effectiveness of sensitivity analysis as an approach for informing the design decisions of NZEBs.
Keywords decision support, early stage, net zero, design, simulation, architects Article History Received: 30 August 2012 Revised: 30 November 2012 Accepted: 20 December 2012
© Tsinghua University Press and Springer-Verlag Berlin Heidelberg 2013
1 Introduction 1.1 Background
The design of Net Zero Energy Buildings (NZEBs) is a challenging problem of increasing importance. The NZEB objective has raised the bar of building performance and will change the way buildings are designed and constructed. During the coming years, the building design community at large will be galvanized by mandatory codes and standards that aim to reach neutral or zero energy built environments (ASHRAE 2008; EU 2009; IEA 2008). At the same time, lessons from practice show that designing a robust NZEB is a complex, costly, and tedious task (Renard et al. 2008; Achten et al. 2009; Kurnitski et al. 2011; Marszal et al. 2011; Zeiler 2011; Attia 2012a; Georges et al. 2012; Pless et al. 2012). The uncertainty of decision-making for NZEBs is high (Athienitis et al. 2010; Kolokotsa et al. 2011; Marszal
and Heiselberg 2011). Designers have been faced with a pool of various choices to arrive to the NZEB performance objective. Combining passive and active systems early on is a challenge, as is, more importantly, guiding designers towards the NZEB objective that requires high energy and indoor comfort performance criteria. An international effort to define the main building design aspects for NZEBs is ongoing in the International Energy Agency (IEA) joint Solar Heating and Cooling (SHC) Task40 and Energy Conservation in Buildings and Community systems (ECBCS) Annex52 titled “Towards Net Zero Energy Solar Buildings” (Sartori et al. 2012). Table 1 shows a simplified model for six main building design aspects that designers should address early on during the conceptual stage. In fact, the integration of such design aspects during the early design phases is extremely complex and time consuming and requires a high level of expertise as well as software packages that are currently not available. At this stage, the architects
are in a constant search for a design direction to make an informed decision. Also, decisions taken during this stage can determine the success or failure of the design. Twenty percent of the design decisions taken during early design phases subsequently influence 80% of all design decisions (Bogenstätter 2000). In order to design and construct such buildings it is important to insure informed decision-making during the early design phases of NZEBs.
Therefore, building performance simulation (BPS) tools have the potential to provide an effective means to support informed design decision-making of NZEBs. However, certain barriers block architects’ use of BPS decision support for NZEB design during early design stages. The most important barrier is informing design decisions prior to the decision- making and early on in the design process (Shaviv 1999; Hayter et al. 2001; Charron et al. 2006). The barriers to informing the decision-making and providing guidance to architects during the early stages of NZEB design have been quoted by a number of previous studies around the world (Riether and Butler 2008; Weytjens et al. 2010; Attia and De Herde 2011a; Attia et al. 2012c). Currently, simulation tools are mostly used in the later stages of NZEB design by specialists as evaluation tools, rather than by architects as guidance tools. In this context, this paper aims to evaluate the effect of a simulation-based decision aid on achieving informed design decision-making by architects during early stages of the design of NZEBs.
In this paper, three design case studies are described which comprise a framework for integrating BPS in the design, and the merit of the sensitivity analysis as an effective approach to support the decision-making of NZEB designs is evaluated. This is a part of a PhD study that aimed to examine the impact of informing the decision-making using parametric analysis and BPS (Attia 2012b). For the study used a pre- and post-workshop open-ended written questionnaire, a Likert scale (15) questionnaire, an after- scenario questionnaire, and a group discussion with the
design participants, administered to assess the benefits of the simulation and sensitivity analysis guidance.
With its focus on the design experience, this article will be of interest to architects, educators, researchers, simulation practitioners, and developers. The article determines the needs of research and practice so we can ascertain and quantify the effort needed to understand and apply BPS tools.
One professional architectural group and two student groups participated. For the professional architectural group we found that simulation-based decision aid improved the knowledge of architects about the design of NZEBs. Simulation appears to promote informed decision-making regarding NZEB design. Those participants who used the BPS tools and sensitivity analysis technique in the design of NZEBs created more energy-efficient buildings with better performance results. In this paper, three design case studies are described which comprise a framework for integrating BPS in the design, and the merit of the sensitivity analysis as an effective approach to support the decision-making of NZEB designs is evaluated.
This paper is organized into five sections. The first section identifies the research problem within the BPS community. The second section identifies the research methods and usability metrics outline and case studies setting. The analysis of the energy performance simulation results and the self- reported usability findings are presented in Section 4. The final section discusses the research findings and limitations along with the implications for the design practice community and future research.
1.2 Past research
Informed decision-making, or informed design choice, forms an essential basis for the design of high performance buildings and NZEBs. This concept is based on providing knowledge prior to the decision-making to influence the decision attitude. Decision aids have developed significantly
Table 1 The six main building design aspects of NZEBs design
1. Balance index: There are several definitions for NZEBs that are based on energy, environmental or economic balance. Therefore, a NZEB simulation tool must allow the variation of the balance metric.
2. Comfort level and climate: The net zero energy definition is very sensitive toward climate. Consequentially, designing NZEBs depends on the thermal comfort level. Different comfort models, e.g. static model and the adaptive model, can influence the “net zero” objective.
3. Passive strategies: Passive strategies are very fundamental in the design of NZEB including daylighting, natural ventilation, thermal mass and shading.
4. Energy efficiency: By definition, an NZEB must be a very efficient building. This implies complying with energy efficiency codes and standards and considering the building envelope performance, low infiltration rates, and reducing artificial lighting and plug loads.
5. Renewable energy systems (RES): RES are an integral part of NZEB that needs to be addressed early on in relation to building from addressing the panels’ area, mounting position, row spacing and inclination.
6. Innovative solutions and technologies: The aggressive nature of “net zero” objective requires always implementing innovative and new solutions and technologies.
in their sophistication, both in terms of their scope and the technologies used. They are tools developed to help designers make decisions, particularly in areas of performance uncertainty of NZEB design and the range of BPS tools now in existence reflects that there have been on the field.
Recently, BPS decision support tools have become more informative aiming to aid before making a decision including parametric analysis automated optimisation techniques.
There is an extensive body of literature examining the effects of BPS tools as informative decision aids. For example, the work of Morbitzer (2003) examined the integration of simulation into the building design process. The work of Donn (2004) investigated the influence of simulation-based environmental design decision support tools in architecture. Mourshed’s work (2006) investigated the optimization of architectural design decision-making. In 2007, Hansen (2007) investigated the role of sensitivity analysis as a methodical approach to the development of design strategies for environmentally sustainable buildings. Finally, the work of Hopfe (2009) examined the use of uncertainty and sensitivity analysis in BPS for decision support and design optimization. By reviewing this work systematically we found that BPS improved the decision-making in a number of ways:
Increasing designers’ knowledge of the design problem and options. For example, knowing the most influential design parameters that influence the energy performance and their range and their impact.
Reducing decision uncertainty, particularly the relative merits or disadvantages of different design strategies or alternatives, and where it is important to take into account the influence of the design choice on energy performance for NZEBs.
Increasing the design robustness, this means designing NZEBs that are energy efficient meeting the exact performance desired, and minimally, impacted by external forces such as environment, climate change and occupant behaviour.
Currently, few tools exist that support design pre- decisions. The disadvantage of most existing tools is that they operate as post design evaluation tools. On the other hand, pre-decisions tools are informative tools that provide facts before taking any design decision. Existing tools include jEPlus and iDbuild, which allow parametric analysis or sensitivity analysis (Zhang and Korolija 2010; Petersen and Svendsen 2010). The potential of parametric tools to bridge the “informative support” barrier is very high, because they can provide constructive feedback with very few iterations and at the same time allow a wide range of solution space. Similarly to those tools, it will be shown in this paper that these quality domains are features of an NZEB decision
support tool that is under development, ZEBO (Attia et al. 2012b) (see description in Section 2.2). During the case studies, a significant effort was made to measure the influence of sensitivity analysis on decision-making. Furthermore, it will be shown that not only has the NZEB design objective been achieved, but also ZEBO has been used to test the effectiveness of using BPS to achieve informed decision-making.
2 Designing and conducting the study
Two types of data were collected, mainly preference and performance data. The preference data were used to collect information from participants using self-reported metrics. The performance data were used to collect information on the energy performance of the final design. During the design of the NZEB case study, the followings were documented during their evaluation: (i) the knowledge and satisfaction concerning the use of simulation for NZEB design, (ii) the decision-making attitude and behaviour, and (iii) the energy analysis-based performance robustness of three groups (see Section 3). The energy evaluations were compared with the results of a quantitative assessment of the overall design performance (see Section 4.3). Finally the results were compared and presented (see Section 4).
2.1 Workshop design
2.1.1 Workshop participants
Three workshops took place in Cairo, Egypt, to examine the effect of using the BPS tools and sensitivity analysis technique in the design of NZEBs. The workshops were announced and three groups of participants were recruited as described in Section 3.
2.1.2 Workshop preparation
Prior to starting the workshops, participants were asked to achieve proficiency in the use of geometrical modelling in DesignBuilder (2011a, b) using the video tutorials provided online. For ZEBO, participants were asked to view a tutorial video and install the tool to become familiar with the application (Attia 2011). At the beginning of the workshop, participants were given an introductory crash course in use of the selected energy simulation tools, requiring a time investment of eight hours. Throughout the crash course, participants were required to follow a guidebook checklist on how to carry out successful simulations. The checklist was developed after reviewing the work of Bambardekar and Poerschke (2009) and Rocky Mountain Institute (RMI) (2011) and was used to remind participants to use the minimum
number of steps and to make the steps explicit. During the introductory tutorial participants were taught to:
create a simple building geometry model in ZEBO; perform a simulation and sensitivity analysis exercise
provided to the participants in ZEBO;
create a simple building geometry model in DesignBuilder; perform a simulation exercise in DesignBuilder, where
the main building components as well as typical occupancy and equipment schedules were provided to the participants. During the software instruction portion of the workshop, participants followed procedures as demonstrated by the checklist and instructor to create a model. The RMI Building_Model_Checklist was used to remind participants about the minimum steps of the simulation and to make them explicit (RMI 2011). The checklist offered the possibility of verification and instilled a kind of discipline of higher input performance. The use of the checklist was established for a higher standard of baseline performance.
2.2 Sensitivity analysis for decision support
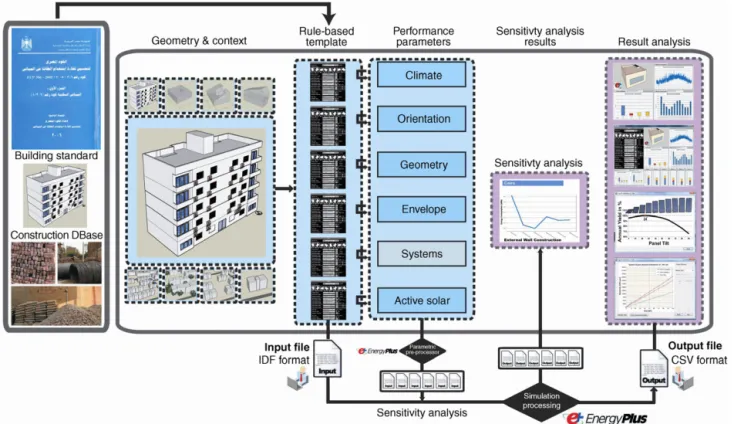
The simulation-based decision aid ZEBO was used in this study. A detailed description of ZEBO can be found under Attia et al. (2012b). Figure 1 shows the tool flow chart of ZEBO. The video tutorial explains how to use the tool (Attia 2011). ZEBO is a sensitivity-based simulation tool used for NZEB design during early design stages. The tool underpins a representative residential benchmark and was tested in a previous study (Attia et al. 2012a; Attia and De Herde 2011b). It is based on a residential benchmark coupling sensitivity analysis modelling with the energy simulation software EnergyPlus as a means of developing a decision support tool to allow designers to rapidly and flexibly assess the thermal comfort and energy performance of early design alternatives (DOE 2011a,b). ZEBO models a simple rectangular building created to mechanically represent cooled
apartment units within the Egyptian climatic and urban context. ZEBO Beta Version 3 was used for this study, including a video clip on how to use the tool. Participants were asked to use the sensitivity analysis features of the tool prior to the decision-making. This step introduces designers to the impact of varying the parameter values prior to the decision-making. The sensitivity analysis results form the basis for informed decision-making. In contrast to the classical design approach, where simulation is used as a post-decision evaluative tool, the designer is informed on the impact of his decision prior to the decision-making.
To address the NZEB objective, the interface first addresses the passive design strategies and then the active design strategies. Input categories are divided into eight groups: Weather File, Orientation, Zone Dimensions, North and South Window Width and Type, Shading Devices and Dimensions, Wall Type, Wall Insulation Type and Thickness, and Roof Insulation Type and Thickness. The weather file is selected by a pull down menu. The file is an EPW file type for eleven Egyptian cities downloaded from the DOE EnergyPlus weather file library (DOE 2011a). Once the weather file is selected, the standard requirements of the chosen location are automatically set as default values, allowing the creation of the baseline case. The user is then allowed to change the parameter input without exceeding the minimum standard requirement. It is possible to define the horizontal shading options and determine the shading device locations and dimensions above the windows. Also the wall section can be selected, including the wall type, insulation material and insulation thickness. At the end of this process, and prior to pressing the EnergyPlus button, the tool will update the EnergyPlus input file with the input parameters.
Lessons learned from practice show the importance of informing architects with active system requirements to integrate them in the envelope and become a basic part of
the NZEB design concept. Therefore, an extra integral module of ZEBO allows the estimation of the energy generation and required photovoltaic and solar water heater panel area. The solar active tool module is based on earlier research by the author and informs the decision-making on the physical integration within the building envelope, addressing the panels’ area, mounting position, row spacing and inclination (Attia and De Herde 2010). The idea of this module is to inform the designer as early as possible on the spatial and physical implication of the NZEB objective. The renewable system module is an implementation of simulation results that estimate the average performance of a photovoltaic (PV) system in different locations and positions in Egypt. The active design intervention can be done as a last step as it depends on the total energy consumed. The solar active module allows the selection of different parameters including the PV panel type, panel tilt, panel orientation, panel efficiency and mounting to optimise the electrical yield. Once the simulation has been run, the output graphics are displayed. Graphs are generated by reading the CSV output file using Excel macros. For each case, ZEBO output displays the results in three different graphs: the outdoor temperatures graph, the monthly end use graph, and the energy consumption breakdown graph (see Fig. 2).
2.3 Simulation intervention and controls
Group 1 already had an initial low energy design and
wished to improve it and therefore used only one design improvement iteration. The second and third groups had to create their designs during the workshop with two additional design improvement iterations as shown in Fig. 1. The first design, created without lecturing or simulation tools, was used as the control for the first and second interventions. The first iteration for Groups 2 and 3 was carried out after participants had received lectures on the design of NZEBs including rules of thumbs and design guidelines. The second iteration for both groups (Groups 2 and 3) was carried out after using ZEBO and DesignBuilder simulation tools.
2.4 Comparisons and evaluation metrics
In order to determine the effect on informed decision- making, the main comparison considered the improved design versus the control. In order to further assess the effect on informed decision-making, correlations between knowledge, satisfaction, and attitude outcomes were examined. Most of the analyses in this study were undertaken on a group basis. However, according to the model of informed decision-making, we should be able to demonstrate good knowledge, attitudes, and uptake of simulation at the level of the individual participant as evidence of informed decision-making by the individual. The data were therefore analysed accordingly, and participants whose knowledge scores were above the median were defined as “high
knowledge”. The attitude and intention outcomes were then dichotomized, again on the basis of the median scores, as “high” and “low”. The evaluation data were based on two types of metrics as described below.
2.4.1 Preference data
Self-reported data is a very important method used in the medical field for measuring medical decision-making. Self- reported data give the most important information about users’ perception of a system and their interaction with it. For this study, self-reported data were collected to obtain the most important information about users’ perceptions of the BPS simulation tools used (sensitivity analysis) and their interaction with them. At attitude and behaviour level, the data may inform about how users feel about the decisions taken. These kinds of reactions are the main thing that the self-reported metrics aimed to document. The self-reported data were captured in a usability test with a Likert rating scale, following the scenario satisfaction questions, open- ended questions, and group discussion (Lewis 1991; ISO 2006; Tullis and Albert 2008).
To maintain reliability and validity two measures were taken. Firstly, we opted to use questionnaires that are consistent in measuring the users’ preference. A measurement is said to be reliable or consistent if the measurement can produce similar results if used again in similar circumstances. This involves splitting a test into two and having the same participant doing both halves of the test. If the two halves of the test provide similar results this would suggest that the test has internal reliability. Secondly, we avoided the lack of validity by comparing the results of the self-report with another self-report on the same topic with all groups. Leading questions were avoided, open questions were added to allow respondents to expand upon their replies and confidentiality was reinforced to allow respondents to give more truthful responses. To guarantee the reliability and validity of the self-report techniques we implemented the System Usability Scale (SUS) questionnaires, defined by ISO 9241-11:1998 standard (ISO 1998). Ten ordinary (pre-defined) SUS questions were used as shown in Figs. 511 (as shown in Section 4). The analysis of the responses was based on the reporting framework ANSI/INCITS 354-2001 (ANSI 2001).
2.4.2 Performance data
One performance indicator was captured to measure the influence of sensitivity analysis decision support on the energy performance of the designed buildings. A simulation model was required for the original and improved designs of all participants. The objective of this study was to estimate the effect of applying energy simulation and sensitivity analysis. An improved energy performance version of the first design
was required as part of the participants’ final submittal. The influence of the tools used was analysed and the total energy consumption was used as an indicator for evaluation. Comfort was considered as a design constraint. Any design solution had to comply with the Givoni comfort model for hot climates (Givoni 1992).
3 Case studies framework
This section describes three different design case studies for NZEBs in which simulation was used to test and measure the ability to achieve informed decision-making for design. Three design workshops were organized early in 2011 in Cairo, Egypt, to design and develop three case studies. As mentioned before, we provided all participants with rudimentary software training and asked for volunteers for more in-depth study of the BPS tools package. The aim was to provide opportunities for all participants to attain basic proficiency in using the software package with the help of a checklist developed to enable them to better understand the complexities of performing simulations. This introduction to BPS is meant to build a common-ground for future investigation of design decision support by BPS during the design development of the case studies in the workshops.
Among the variety of definitions, in practice many practitioners have opted to meet the site NZEB goal, as with this approach there is no need to adjust for grid generation and transmission losses, utility emission rates, or utility cost structures. As these values can vary greatly by location, the site NZEB goal simplifies energy calculations and provides a more level playing field. Therefore for this study the NZEB definition is: “An NZEB is grid connected energy efficient building that balances its total annual energy needs by on-site electricity generation”.
Most participants participated in a previous introductory workshop on BPS tools in 2010 (Attia et al. 2011). Before or parallel to that, all participants were instructed in various analysis techniques, including reading a sun path diagram, analysing thermal comfort, using the Database of Egyptian Building Envelop (DEBE) (Attia and Wanas 2012), and using the Weather Tool and Climate Consultant for climate visualization (Milne 2011). Weather Tool is a visualisation and analysis program for hourly climate data. It recognises a wide range of international weather file formats as well as allowing users to specify customised data import formats for ASCII files. It also provides a wide range of display options, including both 2D and 3D graphs as well as wind roses and sun-path diagrams. The tool allows generating full psychrometric and bioclimatic analysis, which is a unique mechanism for assessing the relative potential of different passive design systems. Solar radiation analysis can be accurately determined and optimum orientations for specific
building design criteria. The tool allows comprehensive pre-design climate/site analysis. Climate Consultant is a graphic-based computer program that displays climate data in several of ways useful to architects, including temperatures, humidity, wind velocity, sky cover, solar radiation graphics and psychrometric charts for every hour of the year. Climate Consultant 5.0 also plots sun dials and sun shading charts overlaid with the hours when solar heating is needed or when shading is required. The psychrometric chart analysis shows the most appropriate passive design strategies in each climate, while the new wind wheel integrates wind velocity and direction data with concurrent temperatures and humidities and can be animated hourly, daily, or monthly.
3.1 Case study 1
3.1.1 Description
The case study took place during a four-day workshop from 17 to 20 January 2011. The workshop was scheduled to meet 8 hours per day in the German Development Cooperation Building in Cairo. Group 1 entailed five architects, one urban planner and four architecture graduate students. The goals of the workshops were to design a low energy resource efficient building cluster with six apartments of 80 m2 consuming in average 3000 kWh/year and generate on site the same amount on energy annually. We have included in this paper several NZEB samples with an elaborated results analysis on the performance. This design project is called iHouse and is part of the activities of the Egyptian Earth Construction Association (EECA). The EECA aims to adopt and validate a design for an affordable and energy efficient prototype as a demonstration and monitoring building. Initially the group had an original design proposal and wished to simulate its performance and improve its design to become an NZEB.
3.1.2 Design project
From the first day of the workshop, the analysis and design problem was undertaken. The design problem consisted of proposing a new residential cluster for relocated inhabitants of slums areas in Cairo. The residential cluster should be attractive and resource efficient, integrating socio-economic and environmental aspects. The project is part of the framework of the innovation component (iThink) of the EgyptianGerman Private Sector Development Programme (PSDP), which identifies a resource efficient housing as an innovative product with a high potential to be successfully introduced to the Egyptian market. Housing in Egypt and especially the quick allocation and reconstruction of a sufficient number of units for the continuously growing urban population remain a challenge for politicians, planners,
and private developers. Therefore, the iHouse network targets the introduction of a resource efficient building, the “iHouse”, for the Egyptian market. The overall aim of the project is to develop an innovative approach to creating an affordable resource efficient house in Egypt through adopting and validating innovative architectural design in a comprehensive manual and to build one iHouse prototype as a demonstration and testing facility. EECA is a non-profit organization working to develop, apply, and disseminate alternative building technologies that are appropriate for the Egyptian context (see Table 2).
The 11 participants were divided into five groups with one volunteer to perform the role of simulation specialist. The role of the simulation specialist was experimenting with this model and come out with pragmatic reasoning. The large workshop size made it impossible for the workshop staff to provide all of the simulations in a timely manner. Therefore, computer savvy individuals willing to learn new software amongst workshop participants made us consider this delivery option. In the workshop, participants were asked to volunteer after being given only a succinct verbal explanation of the software along with examples of screen captures of the software’s output and interface. In the workshop, the participants received an introductory training in the BPS tools before their volunteering for a more advanced instruction. Although the non-modelling group members worked on various other analysis and design issues, the simulation volunteers had a chance to apply their emerging skills to the preparation of the models of the building. The preliminary analysis addressed the envelope and site, envelope and geometry, occupancy schedules, construction, openings, lighting, and solar electric and thermal technologies. For cooling of the building, the following three options were investigated: purely mechanical air-conditioning, purely natural ventilation, and mixed-mode ventilation.
To support the simulation specialist in his or her modelling effort, two extra night sessions were organized to model the building as a base-case by the workshop staff. In contrast with simplified simulation modelling exercises done by all of the workshop participants, the geometric complexity of the building made very clear the need for a preliminary paper-based analysis aimed at properly organizing the computer thermal and airflow network. The preparation of ZEBO and DesignBuilder base-case models was discussed collectively under supervision by the workshop staff. ZEBO was used first during the parametric analysis for sensitivity analysis to inform the decision making. For example, the tool will run 8 different simulations interval for orientation allowing the user to decide on the best orientation. Running the tool would present the optimal orientation for a shoebox in relation to energy consumption. The user then implements his or her decision in the base- case model using DesignBuilder. After each “simulation
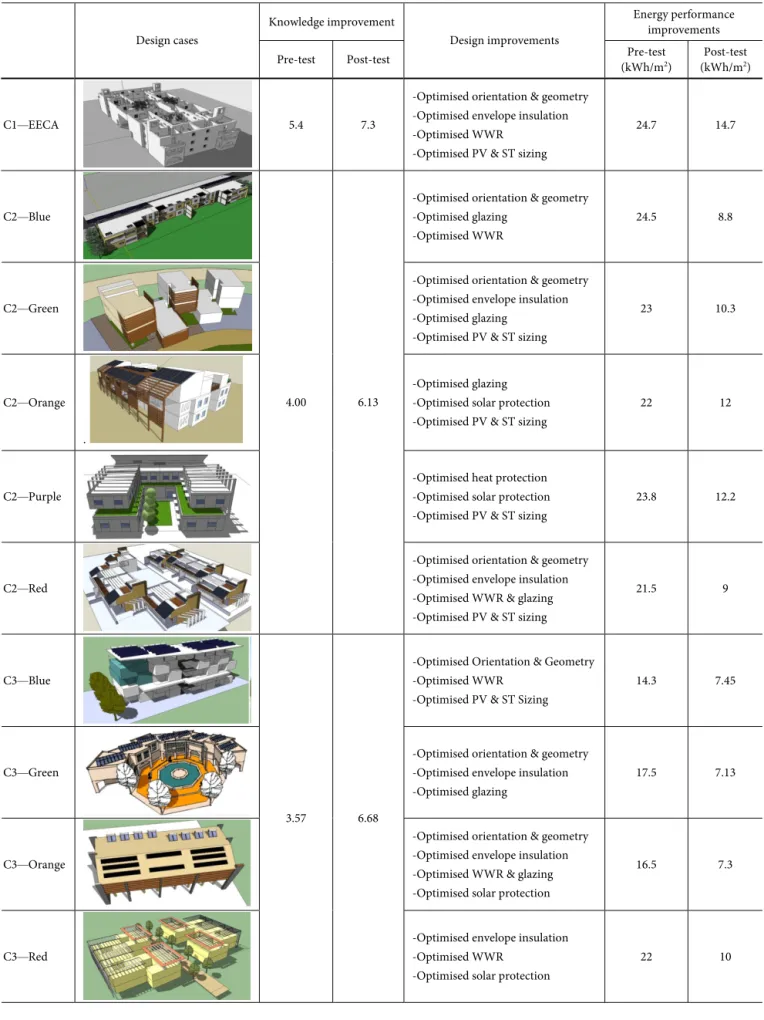
Table 2 The workshop outcomes and the design improvements after using the BPS tools (ST: Solar Thermal)
Knowledge improvement Energy performance
improvements Design cases Pre-test Post-test Design improvements Pre-test (kWh/m2 ) Post-test (kWh/m2 ) C1—EECA 5.4 7.3
-Optimised orientation & geometry -Optimised envelope insulation -Optimised WWR
-Optimised PV & ST sizing
24.7 14.7
C2—Blue
-Optimised orientation & geometry -Optimised glazing
-Optimised WWR
24.5 8.8
C2—Green
-Optimised orientation & geometry -Optimised envelope insulation -Optimised glazing
-Optimised PV & ST sizing
23 10.3
C2—Orange
.
-Optimised glazing -Optimised solar protection -Optimised PV & ST sizing
22 12
C2—Purple
-Optimised heat protection -Optimised solar protection -Optimised PV & ST sizing
23.8 12.2
C2—Red
4.00 6.13
-Optimised orientation & geometry -Optimised envelope insulation -Optimised WWR & glazing -Optimised PV & ST sizing
21.5 9
C3—Blue
-Optimised Orientation & Geometry -Optimised WWR
-Optimised PV & ST Sizing
14.3 7.45
C3—Green
-Optimised orientation & geometry -Optimised envelope insulation -Optimised glazing
17.5 7.13
C3—Orange
-Optimised orientation & geometry -Optimised envelope insulation -Optimised WWR & glazing -Optimised solar protection
16.5 7.3
C3—Red
3.57 6.68
-Optimised envelope insulation -Optimised WWR
-Optimised solar protection
specialist” had completed the base-case models and then linked and cursorily tested them, he or she individually modified the model or internal parameters to reflect the particular option assigned to her or his group. The simulations had to investigate various upgrades to the building envelope that were consistent with each option. The workshop staff supervised the simulation specialist during the whole simulation process and the results interpretation process.
The first BPS-related task required participants to prepare an analysis of the existing building. The aim of this analysis was to provide an in-depth understanding of the site climate of New Cairo and the comfort and energy aspects of the precedent design. The second task was to improve the design by running a sensitivity analysis using ZEBO for various building design parameters. The sensitivity analysis was performed in teams typically composed of two participants. Sensitivity analysis determined the contribution of individual design variables to the total performance of the design solution. Each group had to: (i) determine input parameters to be included (provided to participants), (ii) generate a simulation and create an output distribution, and (iii) assess the influence of each input parameter on the output.
3.1.3 Design outcomes
The final design of the EECA group was based on clustering the residential apartment units in a compact configuration (see Table 2). Its performance characteristics are described in Table 3.
3.2 Case study 2
3.2.1 Description
Group 2 comprise 23 architecture students who participated in a five-day workshop to research, analyse and propose a design for an NZEB using BPS tools. The workshop started from 19 to 23 February 2011. The student participants included undergraduate students from the architecture department at Faculty of Fine Arts in Cairo. The undergraduate students ranged from 2nd year to 5th year students. The students comprised five teams, consisting of four to five students per team. Each team was responsible for an individual design concept for a net zero energy residential cluster consuming in average 3000 kWh/year and generate on site the same amount on energy annually. The majority of the work took place in the design studios of the EECA in Cairo. In conjunction with the studio environment, keynote speakers, invited guests, and other interested parties participated in the educational experience.
The workshop focused on developing a conceptual plan for eight residential units utilizing principles of energy efficiency, environmental design, community and art. BPS tools and sensitivity analysis had to be used in the decision- making process and the results may have adverse or unintended effects on the other principles. The workshop title objective was assessing the effectiveness in integration building performance simulation tools in the design process of net zero energy buildings. During the workshop process,
Table 3 Simulation input for the NZEB designs
Group U-value (W/(m2.K)) (walls) U-value (W/(m2.K)) (roof) WWR Glazing Vt U- value (W/(m2.K))SHGC Shading
SF Occu-pants Fresh air Lighting Lighting density AC- VRF (COP) Flat plate (total) PV (MonoC) (14%) per apt. Case study 1 EECA 0.77 0.4 30% Sgl, gry 0.6 1 0.48 0.6 3.0 16m2 16 m2 Blue 0.27 0.2 30% Dbl, lE, argon 0.37 0.25 0.24 0.6 2.7 16m2 14 m2 Green 1.4 0.5 20% Dbl, lE, argon 0.52 0.24 0.29 0.6 2.7 20m 2 * 16 m2 Orange 0.05 0.04 30% Dbl, lE, argon 0.7 0.24 0.38 0.6 2.8 16m2 16 m2 Purple 0.22 0.2 40% Dbl, clr, film 0.54 0.47 0.55 0.75 2.8 16m2 18 m2 Case study 2 Red 1.23 0.5 17% Dbl, lE, argon 0.64 0.24 0.27 0.9 2.8 16m 2 18 m2 Blue 1.4 0.67 22% Dbl, clr, film 0.54 0.47 0.55 0.7 2.5 16m 2 14 m2 Green 0.75 0.5 30% Dbl, lE, argon 0.37 0.25 0.24 0.6 2.5 16m2 14 m2 Orange 0.56 0.34 25% Dbl, lE, argon 0.7 0.24 0.38 0.4 2.5 16m2 14 m2 Case study 3 Red 0.66 0.38 15% Dbl, clr, air 0.79 0.5 0.7 0.6 5 persons 5 L/s per person 300 lx 8 W/m 2 2.5 16m2 14 m2 * Evacuated tubes. Vt: visible transmittance in %.
design duties among team members were necessary to ensure consistency. The first design created without lecturing and without simulation tools was used as control for the first and second interventions. The second design was created after receiving lectures on NZEB design and the third design for both groups was after using ZEBO and DesignBuilder simulation tools.
3.2.2 Design project
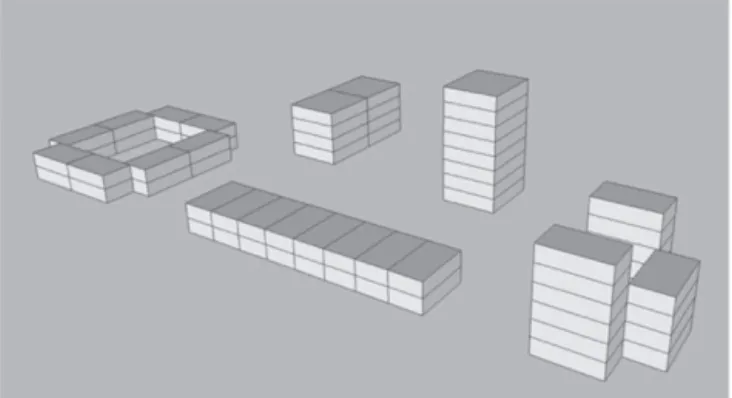
The residential cluster had to be located in the Fifth Settlement of New Cairo, a new satellite city of Cairo. The cluster comprised eight apartment units, each 150 m2 and accommodating five family members. The units had to be mechanically air conditioned. Students were asked to arrange the eight units into a cluster. Figure 3 shows different possible arrangements of the eight units. Students were not restricted to using anything shown in the figure. Students had to define the physical performance of the design parameters. The performance parameters of all design outcomes are described in Table 3.
3.2.3 Design outcomes
Blue group The final design of the Blue group was based on clustering the residential apartment units horizontally on two floors. The idea was then to create a shed protecting the roof and south as shown in Table 2.
Green group The final design of the Green group was based on clustering the residential apartment units on a curved arch as shown in Table 2.
Orange group The final design of the Orange group was based on clustering the residential apartment units around a courtyard. The courtyard is opened from the north side and creates a U-shape cluster as shown in Table 2.
Purple group The final design of the Purple group was based on clustering the residential apartment units around a courtyard. The courtyard is opened from the north side and creates a U-shape cluster as shown in Table 2.
Fig. 3 Different possible arrangements of the eight units
Red group The final design of the Red group was based on clustering the residential apartment units around a courtyard as shown in Table 2.
3.3 Case study 3
3.3.1 Description
Group 3 was a mixed group of university professors, pro- fessional architects, and post-graduates, with 19 participants. The workshop ran from 27 February until 3 March 2011. The participants were divided into four teams, each consisting of four to five members. Each team was responsible for an individual design concept for a net zero energy residential cluster. The majority of the work took place in the design studios of EECA in Cairo. Participants were exposed to the same procedure as used in Workshop 1, as mentioned in Section 3.2.1.
3.3.2 Design project
Participants were assigned to the same project as described in Section 3.2.2. The performance parameters of all design outcomes are described in Table 3.
3.3.3 Design outcomes
Blue group The final design of the Blue group was based on clustering the residential apartment units vertically on four floors. The idea was to create each apartment on two floors and set them in a staggered configuration. The whole cluster was oriented east west as shown in Table 2.
Green group The final design of the Green group was based on clustering the residential apartment units on two floors forming a semi circle. The idea was to create a semi open courtyard in the south with several deciduous trees aiming to block the sun from the south as shown in Table 2.
Orange group The final design of the Orange group was based on clustering the residential apartment units vertically on four floors while creating a shading screen covering the roof and south facade. The whole cluster was oriented east west as shown in Table 2.
Red group The final design of the Red group was based on designing each residential apartment unit as courtyard housing. Each unit was then clustered around a rectangular urban courtyard in Table 2.
4 Results
The effects of the use of BPS and sensitivity analysis were evaluated by means of three design case studies using a control trial and extended usability testing for preference and
performance indicator. Section 4.1 identifies the influence of BPS knowledge on the decision-making attitudes and patterns. Then the results of the scenario questionnaire are reported in Section 4.2. Section 4.3 verifies the improved design through the energy performance comparison of the three case studies using BPS tools. Finally, Sections 4.4 and 4.5 deal with the outcome of the open-ended questions and workshop discussions together with associated material and observations.
4.1 Satisfaction
Using self-reported metrics, the background knowledge and understanding of NZEBs design and the satisfaction with the use of BPS decision support were determined.
4.1.1 Knowledge
Evaluating the effectiveness of BPS tools in informing design required an understanding of the participants’ pre- and post-simulation knowledge. Respondents completed pre- and post-simulation surveys to assess the value of the BPS tools to further the participants’ understanding of NZEBs’ design influences and their relation to the use of simulation. The survey questions used a scale of 0 (none) to 10 (expert), a five-point Likert scale with the responses “very advanced”, “advanced”, “fair”, “poor”, and “no skills”.
In order to assess participants’ knowledge about NZEB design issues, participants were asked “How would you assess your ability to design NZEB?” Table 4 shows the paired t-test analysis of pre- and post-responses, showing a statistically significant increase. A significant increase in knowledge uptake was recorded for the three groups. Moreover, the repetition of this increase in all three group samples is a strong evidence that the use of BPS increased the knowledge uptake. This indicates participant perception of growth in informative knowledge of the basic tenets of decision-making.
4.1.2 Satisfaction (After-Scenario Questionnaire)
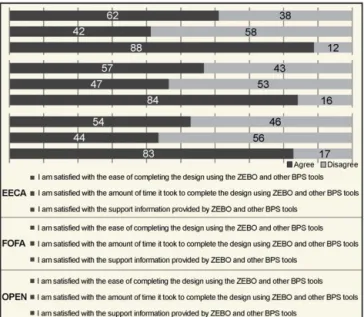
The After-Scenario Questionnaire (ASQ) developed by Lewis (1991) was used to measure three fundamental areas of usability: effectiveness (question 1), efficiency (question 2), and satisfaction (all three questions). We modified Lewis’s questionnaire slightly to measure how far using ZEBO and
other BPS tools informed their decision-making. Participants were asked to fill in an online questionnaire by responding to three statements accompanied by a seven-point Likert rating scale of ‘‘strongly disagree’’ to ‘‘strongly agree’’, as shown in Fig. 4.
The results indicate a low level of satisfaction regarding the ease of completing the design using ZEBO and other BPS tools for all groups. Similarly results indicate a low level of satisfaction with the amount of time taken to complete the design using ZEBO and other BPS tools. The explanation for this low rating for both questions can be found in Sections 4.4 and 4.5. On the other hand, participants’ satisfaction with the information support was reported to be high. Surprisingly, the patterns of answers of the three groups almost match. These findings have unlimited generalizability because the sample size for the factor analysis was relatively large (52 participants). Also the resulting factor structure was very clear.
4.2 Decision-making attitudes and patterns
Another self-reported usability metric was a post-workshop questionnaire that was administered to participants regarding
Fig. 4 The After-Scenario Questionnaire results of the EECA, FOFA and OPEN groups
Table 4 Pre- and post-test analysis
Item Pre-test mean Post-test mean Mean difference t p n
How would you assess your ability to design NZEB? (EECA) 5.40 7.30 –1.900 –5.01 0.0007 10 How would you assess your ability to design NZEB? (FOFA) 4.00 6.13 –2.130 –8.66 0.0318 23 How would you assess your ability to design NZEB? (OPEN ) 3.57 6.68 –3.110 –8.88 0.0001 19
how far using ZEBO and other BPS tools informed their decision-making and led to higher reliability and robustness of the NZEB design. Participants were asked to fill in an online questionnaire with six questions.
4.2.1 Informed decision-making
Figures 5 and 6 show that participants’ questionnaire responses vividly indicate agreement with the statements “guides your decision-making” and “informs your decision- making”. With regard to the “guiding” question, Most of Group 1 respondents strongly agreed or agreed while few
Fig. 5 Participants’ responses to a question related to the guidance of decision-making
Fig. 6 Participants’ responses to a question related to the informed decision-making
were undecided. The results of Group 2 and Group 3 were similar. In total, 71.2% of participants recognized the importance of BPS tools in guiding the decision-making of NZEBs design even though 6.0% of all three groups disagreed with the statement.
With regard to the “informing” question and as shown in Fig. 6 most of the participants recognized the importance of BPS tools in informing the decision-making of NZEBs design and none of the questionnaire respondents disagreed with the statement. In Groups 1, 2 and 3, almost all respondents strongly agreed or agreed with the statement while few were undecided.
However, as shown in Fig. 7, participants disagreed with the statement “makes you confident about your decision- making”. In total one third of participants disagreed that the use of ZEBO and other BPS tools made them confident about their decision-making in NZEBs design while almost half of the respondents were undecided. In the open-ended questions and discussion respondents indicated that the simulation process and the results have to be well presented and understood, so that they can gain confidence from the information (see Sections 4.4 and 4.5).
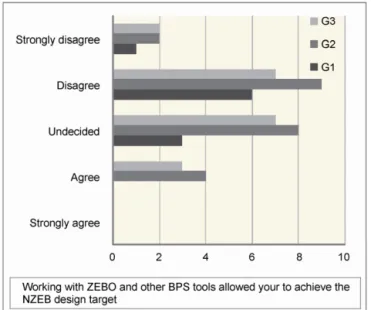
4.2.2 Reliability and robustness of design
Figure 8 shows that participants’ questionnaire responses indicate disagreement with the statement “allows you to achieve the NZEB design target”. In total more than half the participants disagreed that the use of ZEBO and other BPS tools allowed them to achieve the NZEB design target while one third were undecided. The open-ended questions and discussion revealed that respondents considered other
Fig. 7 Participants’ responses to a question related to the confidence in decision-making
Fig. 8 Participants’ responses to a question related to the achieving the NZEB target
important aspects to achieve the NZEB design target. One respondent quoted “For instance how the building looks like,
how stable it will be, the budget and time so in this decision- making the energy is one egg in the basket and there are 11 others in the basket.” (See Sections 4.4 and 4.5)
However, participants’ questionnaire responses vividly indicate agreement with the statements “is essential for NZEB design” and “produces reliable and robust NZEB design”. According to Fig. 9, more than two thirds of the participants agreed that the use of ZEBO and other BPS tools is essential for NZEB design. Despite the difficulties mentioned in Sections 4.2.1 and 4.2.2 the use of BPS simulation was considered as essential step for NZEB design.
Fig. 9 Participants’ responses to a question related to the importance of using BPS for NZEB design
More than half participants agreed that the use of ZEBO produced reliable and robust NZEB design while one third of the respondents were undecided (see Fig. 10). To avoid any ambiguity of the terminology the term reliable and robust was explained before the questionnaire. For most participants having to use ZEBO or DesignBuilder which are graphical user interfaces for EnergyPlus was sufficient to produce reliable and robust NZEB design.
We analysed this qualitative data looking for high- frequency patterns of attitude that might suggest inherent problems with the use of BPS tools. Once this analysis was completed, we prioritized the problems based on frequency and our subjective ratings of severity to help prioritize the order of presentation in our study. While the results indicate the ability of sensitivity analysis to inform and strongly guide the decision and the desire to use BPS tools, the most frequently demonstrated problems involved lack of confidence and difficulty achieving the NZEB design target of this approach. These were all considered to be rather serious problems. In order to analyse the reasons for these problems, participants were asked to provide explanation during the group discussion, which is presented in Section 4.5. 4.3 Verifying the effect of BPS
This section presents the combined effect of BPS on design, knowledge and energy performance improvements of the design projects. The impact of BPS is compared and summarized in Table 2. As shown in Table 2 and described in Section 4.1.1, a significant increase in knowledge uptake was recorded for the three groups. Also the new design
Fig. 10 Participants’ responses to a question related to BPS tools and the reliability and robustness of NZEB design
incorporated optimised changes which were compatible, acceptable to the designers. Their introduction was a result of sensitivity analysis and parametric variation of the different design parameters listed below:
The geometry was redesigned to reset the mass correctly with orientation close together.
The solar protection was redesigned so that it maximizes the shading of openings and envelope.
The openings ratio and glazing type were significantly improved in the third design round.
Extra envelope insulation was added so that all envelopes thermal performance improved by at least 50%.
The PV & ST sizing and architectural integration was optimised in all designs.
Moreover, the simulated energy performance of the 11 NZEBs is reported in terms of kWh per square meter, as shown in Table 2. Similar to the work by Charles and Thomas (2009), Hamza and Horne (2007), Mahdavi and El-Bellahy (2005) we compared the simulated energy performance of the original with the improved versions of the three design case studies. As mentioned earlier, the participant groups were required to use simulation to predict the performance of thermally improved version of the initial design (via the use of ZEBO and other simulation tools).
4.3.1 Case study 1 (Group 1)
Figure 11 illustrates the final design of the improved version of the EECA design case study. As shown in Table 2 and Fig. 12 the energy performance is 40.5% better/more efficient than the energy consumption of the original design. This difference indicates a strong influence of the use of BPS tools in reducing the total energy consumption.
Fig. 11 The final simulation model of EECA in its urban context (Workshop 1)
Fig. 12 Simulated energy performance of the original and improved version EECA (Workshop 1)
4.3.2 Case study 2 (Group 2)
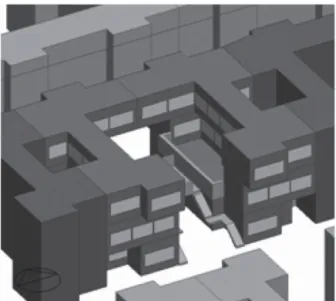
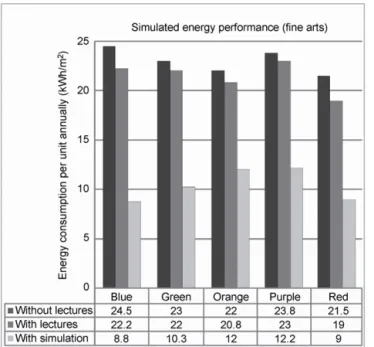
Figure 13 illustrates the five final improved designs created by the five student groups of Workshop 2. Table 2 and Fig. 14 compare the energy performance of the three proposed designs of each group (design without any lectures or simulation, design with lectures only, and design with lectures and simulation). The knowledge and skills that the participants obtained from the lectures on NZEB design improved the design of the five groups by only 3.7% to 11.7%. Surprisingly, the energy performance of the third design proposal of each group was improved by 48.8% to 64.1% when simulation was used during the design compared to the original design. This difference indicates a strong influence of the use of BPS tools in reducing the total energy consumption and informing decision-making for better performance results.
4.3.3 Case study 3 (Group 3)
Figure 15 illustrates the four final improved designs of the four professional groups. Table 2 and Fig. 16 compare the energy performance of the three proposed designs of each group (design without any lectures or simulation, design with lectures only, and design with lectures and simulation). The lectures on NZEB design improved the designs created by the four groups by only 7.9% to 17.2%. Surprisingly, the energy performance of the third design proposal of each group was improved by 48% to 59.3% when simulation was used during the design compared to the original design. This difference indicates a strong influence of the use of BPS tools in reducing the total energy consumption and informing the decision-making for better performance results.
Fig. 14 Simulated energy performance of the 5 design groups (without lectures—with lectures—with simulation)
Fig. 15 Final designs of the 4 groups of Workshop 3
The energy analysis of the three design case studies is a strong indicator of the influence of sensitivity analysis and BPS tools in informing the decision-making and achieving NZEB design.
Fig. 16 Simulated energy performance of the 4 design groups
(without lectures—with lectures—with simulation) 4.4 Open-ended question
An open question followed the workshop in order to allow respondents to share their thoughts and comments. The question concerned what should be done to bridge the barrier between using BPS tools and achieving informed decision-making. A selection of the suggestions for future improvements and their frequencies are classified as follows: Combining design tools with simulation tools (20). Flexible modelling through flexible 3D modellers or other
media (18).
Providing further interpretation of results and buildings; physical behaviour (16).
Provide a local database for materials, occupancy, appliances, and so on (15).
Providing a pre-educational process (11).
Integration in the design process in a systematic way, for example, using checklists (10).
More automated quality control (e.g., error-checking, default settings, and templates) (7).
Allow code compliance and rating system compliance (7).
Allowing cost calculation and life cycle assessment (5). Provide instantaneous feedback while changing values (4).
According to the results, the freedom of geometrical modelling and the coupling of simulation tools with design tools were the most frequently named topics. One of the participants mentioned that he would like to be able to model projects like Frank Gehry’s. This was repeated again in the group discussion.
4.5 Group discussion
At the end of the three case studies, design group discussions were organized to discuss the participants’ reflections on the workshops’ findings and questionnaire results. Overall, participants perceived BPS as useful and informative for achieving the NZEB design. Most participants considered that BPS tools gave added value in informing and validating the design decision to achieve the design objective. Many respondents highlighted the importance of parametric design and sensitivity analysis features to guide the design. They stated their endorsement of BPS tools for the design of similar performance-based design projects or assignments aiming to address issues like natural ventilation and lighting.
The group discussion also revealed important contextual factors influencing the participants’ integration of BPS during the three workshops, for example:
“ZEBO helped me to design a NZEB with a target to achieve an energy balance considering electricity, heating and DHW demand. I wish the tool could integrate the embodied energy and mobility in the NZEB design.” (Workshop 2)
“BPS is so far away from our architectural daily practice and work. For example, the input and output process and the required expertise to represent the building into physical performance values are so different from the visual architectural practice.” (Workshop 3)
“The decision-making is a hard topic and buildings are not built for the reason to be energy efficient they should look nice and have the right materials and colours and suitable for tenants. There are other issues as well.” (Workshop 1)
“I think very few professionals will rely on BPS without knowing how they work. So, in order to integrate simulation into decision-making, the key barrier is informing the users of what is going on and why the optimised solution is better than what I can achieve by other means. The simulation tools have to deliver the right information to the users.”
(Workshop 3)
“The biggest obstacle, I think in practice, is understanding the simulation process. So there is a big educational need before this takes off routinely in architectural practice. You need to be very savvy and careful about the modelling details
and your assumptions when you are stepping into simulation problems.” (Workshop 1)
Thus, at the other end of the spectrum, not all participants found the simulation experience positive. Some participants described the use of BPS as complicated, tedious, and restrictive of creativity, particularly in relation to 3D modelling. During the discussion, participants were asked to explain why they lacked confidence and had difficulty achieving the NZEB design target of this approach using BPS. They acknowledge the added value of BPS in improving the building performance but considered its influence to be small compared to other design aspects that need to be balanced including cost, aesthetics, time, budget, and so on. In order to address the challenge of effectively integrating BPS in design practice, participants were asked to rank the most important roles of BPS tools in their future works. Participants from the three workshops agreed that the most important roles are “to enrich creativity through flexible 3D modelling using more design mediums or tools” and “to interpret the results to understand the building performances” followed by “informative support for decision-making” and finally the use of BPS for its “ability to compare the performances of design alternatives”.
5 Discussion and conclusions
Ten new NZEBs were designed, simulated and formally verified, based on the modifications outlined in the previous section. Our aim was to demonstrate that the use of BPS tools and the sensitivity analysis technique would improve the building energy performance of NZEBs for different designers with different levels of knowledge. The new design incorporated several parametric changes, which were com- patible, acceptable to the designer and improved significantly the design performance for different designers with different levels of knowledge. The use of sensitivity analysis technique for design improvement yielded a performance improvement, increase in designers’ knowledge uptake and speed up of the decision time. Furthermore, we integrated the verification steps listed in Table 2 with the design process for the improved designs. As the verification of the improved designs does not require significant amounts of new proof effort over the corresponding original modules, the improvement has been vindicated.
5.1 Summary of findings
The use of BPS tools and the sensitivity analysis technique in the design of NZEBs demonstrated a strong correlation between increased usage and achieving informed decision- making. The main purpose of using BPS tools was to assess their ability on informing the decision-making by using a
simple parametric tool (ZEBO) and a detailed comprehensive tool (DesignBuilder). The aim of the study was not to compare those tools or expose participants to a broader composition of tools; rather it was to assess the mechanics and process of using BPS tools to inform the decision-making. In order to evaluate BPS and sensitivity analysis as a tool for informing decision-making, participants completed several questionnaires assessing their informative effectiveness. The questionnaires reveal participants’ perceptions of the simulation’s informative importance in their design decision-making. Specifically, the open-ended questions and group discussion addressed the value of and barriers to the use of simulation as a decision support method. To validate the study findings a formal energy analysis measure was employed in this respect. A group discussion was also used as an informal triangulation to facilitate the validation of the survey results reported below:
(1) There is a relationship between BPS usage and better energy performance outcomes.
(2) Parametric analysis features were found to promote informed decision-making.
(3) The case studies revealed a significant difference in knowledge levels before & after.
(4) NZEB design ambitions should be tempered by the complexity of design and design process.
(5) A more pre-decision approach is required to meet the uncertainty of decision-making of designers.
(6) Value of usability testing and other user experience measurements (self-reported metrics) is high as a research methodology.
(7) Four factors that promote or inhibit the uptake of BPS as decision support in architectural practice:
a) Interactional usability,
b) Decision support (informative), c) Users’ skills,
d) Contextual integration. 5.2 Limitations of the study
The validity of the study’s findings is potentially open to criticism as only three design groups were used for this study. It would have been desirable to recruit architects from a greater number of design practices to ensure a broader socioeconomic and geographic population distribution. Also the limitations of ZEBO, including its limited library, abstraction of underlying model, ability to handle only energy issues and the shoebox approach that blocks free 3D geometrical representation, forced the participants to use DesignBuilder. Respondents reported that this step hindered the decision support process.
Another limitation was the fact that participants in Workshops 2 and 3 participated in a randomized controlled
trial of an NZEB design after which they all completed a written questionnaire. However, we would argue that this study differed significantly in that it focused on the informative aspects of BPS tools, which were not featured in the trial. A quantitative methodology (survey and performance analysis) and a qualitative methodology (discussion) were employed in this study.
5.3 Implications for design practice and future research Our proposed method of using BPS tools and, in particular, the use of sensitivity analysis for achieving informed decision- making raise a number of challenges for developers of BPS tools, not least of which is the difficulty of accommodating them within the pressures of deadlines and budgets. There is also the challenge of balancing the decision-making of architects as BPS users with those of experts/scientific reference groups, particularly in situations of performance uncertainty/equipoise.
Regarding geometry, the use of BPS tools and sensitivity analysis cannot be achieved if existing tools do not provide seamless model exchange and full geometrical representation. Coupling simulation and decision support techniques to architectural geometrical drawing tools is crucial.
Arguably, the use of BPS tools and sensitivity analysis is too simplistic in that it presupposes a linear progression from intuitive and uncertain decision-making to informed decision-making. In reality, the decision-making for NZEBs design is more complex and might follow a different developmental path wherein the factual design content, for instance, would require both intuitive and informed decision-making in order to develop other design features of the NZEBs. Moreover, the proposed case studies do not take into account other factors, such as the influence of aesthetics and economy, which could have an impact on decision- making about NZEBs in a real/natural design setting.
Nevertheless, the principle of informing the decision- making for NZEB design, whether applied in parts or as a whole, still holds true in our opinion; we suggest further research to test it and other future methods and techniques of BPS. In doing so, it is hoped that designers of NZEBs and international research groups such as IEA: Task 40 will have at their disposal a clearer vision of the use of BPS tools for achieving informed design decisions.
Acknowledgements
This paper is part of a PhD research funded by the Université catholique de Louvain.The author would like to acknowledge all workshops participants. The workshop website including a list of participants and all questionnaires can be found under: http://www.shadyattia.net/academic/WorkshopZED/index.html.
References
Achten K, De Coninck R, Verbeeck G, Van der Veken J (2009). Analyzing the economic feasibility of permutations of energy-saving measures with batch simulations and Pareto optimization. In: Proceedings of the 11th International IBPSA Conference (BS2009), Glasgow, Scotland, pp. 660 667.
ANSI (2001). ANSI/INCITS 354-2001: Common Industry Format (CIF) for Usability Test Reports. Washington, DC: American National Standards Institute.
ASHRAE (2008). ASHRAE Vision 2020 Ad Hoc Committee. Available at http://www.ashrae.org/doclib/20080226_ashraevision2020.pdf. Accessed Oct. 1, 2011.
Athienitis A, Attia S, et al. (2010). Strategic design, optimization, and modelling issues of net-zero energy solar buildings. Paper presented at the International Conference on Solar Heating, Cooling and Buildings (EuroSun 2010), Graz, Austria.
Attia S (2011). ZEBO Tutorial Video 1. Available at http://www.youtube.com/watch?v=zJLYzuL7yjg. Accessed Sept. 2011.
Attia S (2012a). Optimisation for zero energy building design: Interviews with twenty eight international experts. Available at http://www-climat.arch.ucl.ac.be/s_attia/Attia_Optimisation%20 Interviews_2012.pdf. Accessed Jun. 1, 2012.
Attia S (2012b). A tool for design decision making—Zero energy residential buildings in hot humid climates. PhD Thesis, Department of Architecture, Universite Catholique de Louvain, Belgium. Attia S, De Herde A (2010). Sizing photovoltaic systems during early
design: A decision tool for architects. In: Proceedings of SOLAR 2010, Phoenix, USA.
Attia S, De Herde A (2011a). Early design simulation tools for net zero energy buildings: A comparison of ten tools. In: Proceedings of the 12th International IBPSA Conference (BS2011), Sydney, Australia, pp. 94 101.
Attia S, De Herde A (2011b). Design decision tool for zero energy buildings. In: Proceedings of 27th Conference on Passive and Low Energy Architecture (PLEA 2011), Louvain-la-Neuve, Belgium, pp. 77 82.
Attia S, Hamdy M, Samaan M, De Herde A, Hensen JLM (2011). Towards strategic use of BPS tools in Egypt. In: Proceedings of the 12th International IBPSA Conference (BS2011), Sydney, Australia, pp. 40 47.
Attia S, Evrard A, Gratia E (2012a). Development of benchmark models for the Egyptian residential buildings sector. Applied
Energy, 94: 270 284.
Attia S, Gratia E, De Herde A, Hensen JLM (2012b). Simulation-based decision support tool for early stages of zero-energy building design. Energy and Building, 49: 2 15.
Attia S, Hensen JLM, Beltrán L, De Herde A (2012c). Selection criteria for building performance simulation tools: Contrasting architects’ and engineers’ needs. Journal of Building Performance
Simulation, 5: 155 169.
Attia S, Wanas O (2012). The Database of Egyptian Building Envelopes (DEBE): A database for building energy simulations. Paper presented in SimBuild 2012, Madison, USA.
Bambardekar S, Poerschke U (2009). The architect as performer of energy simulation in the early design stage. In: Proceedings of the 11th International IBPSA Conference (BS2009), Glasgow, Scotland, pp. 1306 1313.
Bogenstätter U (2000). Prediction and optimization of life-cycle costs in early design. Building Research & Information, 28: 376 386. Charron R, Athienitis A, Beausoleil-Morrison I (2006). Tools for the
design of zero energy solar homes. ASHRAE Transactions, 112(2): 285 295.
Charles PP, Thomas CR (2009). Four approaches to teaching with building performance simulation tools in undergraduate architecture and engineering education. Journal of Building
Performance Simulation, 2: 95 114.
DesignBuilder (2011a). DesignBuilder v.2.3.5.036.
DesignBuilder (2011b). DesignBuilder. Available at http://www.designbuilder.co.uk. Accessed Jan. 1, 2011.
DOE (2011a). EnergyPlus. Available at http://apps1.eere.energy.gov/ buildings/energyplus. Accessed Jan. 1, 2011.
DOE (2011b). Building energy software tools directory. Available at http://apps1.eere.energy.gov/buildings/tools_directory. Accessed Jan. 1 2011.
Donn MR (2004). Simulation of imagined realities: Environmental design decision support tools in architecture. PhD Thesis, Victoria University of Wellington, New Zealand.
EU (2009). Report on the proposal for a directive of the European Parliament and of the Council on the energy performance of buildings (recast), European Parliament. (COM(2008)0780-C6- 0413/2008-2008/0223(COD))
Georges L, Massart C, Van Moeseke G, De Herde A (2012). Environmental and economic performance of heating systems for energy-efficient dwellings: Case of passive and low-energy single-family houses. Energy Policy, 40: 452 464.
Givoni B (1992). Comfort, climate analysis and building design guidelines. Energy and Buildings, 18: 11 23.
Hamza N, Horne M (2007). Educating the designer: An operational model for visualizing low-energy architecture. Building and
Environment, 42: 3841 3847.
Hansen H (2007). Sensitivity analysis as a methodical approach to the development of design strategies for environmentally sustainable buildings. PhD Dissertation, Department of Architecture and Design, Aalborg University, Denmark.
Hayter SJ, Torcellini PA, Hayter RB, Judkoff R (2001). The energy design process for designing and constructing high-performance buildings. In: Proceedings of the 7th REHVA World Congress and Clima 2000/Naples 2001 Conference, Naples, Italy. Hopfe C (2009). Uncertainty and sensitivity analysis in building per-
formance simulation for decision support and design optimization. PhD Dissertation, Technical University of Eindhoven, The Netherlands.
IEA (2008). IEA SHC Task 40/ECBCSAnnex 52, Towards net zero energy solar buildings. Available at http://www.iea-shc.org/ task40/index.html. Accessed Oct. 10, 2009.
ISO (1998). ISO 9241-11:1998, Ergonomic requirements for office work with visual display terminals (VDTs)—Part II: Guidance on usability. Geneva: International Organization for Standardization.