HAL Id: tel-01827253
https://tel.archives-ouvertes.fr/tel-01827253
Submitted on 2 Jul 2018
HAL is a multi-disciplinary open access
archive for the deposit and dissemination of sci-entific research documents, whether they are pub-lished or not. The documents may come from teaching and research institutions in France or abroad, or from public or private research centers.
L’archive ouverte pluridisciplinaire HAL, est destinée au dépôt et à la diffusion de documents scientifiques de niveau recherche, publiés ou non, émanant des établissements d’enseignement et de recherche français ou étrangers, des laboratoires publics ou privés.
at the near detector of the T2K experiment
Ciro Riccio
To cite this version:
Ciro Riccio. Measurement of the antineutrino flux and cross section at the near detector of the T2K experiment. High Energy Physics - Experiment [hep-ex]. Université Paris Saclay (COmUE); Università degli studi di Napoli Federico II, 2018. English. �NNT : 2018SACLS013�. �tel-01827253�
efficace des antineutrinos dans le
détecteur proche de l'expérience T2K
Thèse de doctorat de l'Université de Naples et de
l'Université Paris-Saclay,
préparée à l'Université Paris-Sud
au sein du Commissariat à l’énergie atomique et aux énergies alternatives
Ecole doctorale n°576
Particules, Hadrons, Energie, Noyau,
Instrumentation, Imagerie, Cosmos et Simulation
(PHENIICS)
Specialite de doctorat : Physique des particules
Thèse présentée et soutenue à Naples, le 15 Janvier 2018, par
Ciro Riccio
Composition du Jury :
Gianluca Imbriani, Professeur, Université de Naples Federico II Président
Vincenzo Berardi, Professeur, Politecnique de Bari Rapporteur
Francesco Cappuzzello, Professeur, Université de Catania Rapporteur
David Verney, Chercheur, Institut de Physique Nucléaire d’Orsay Examinateur
Gianfranca de Rosa, Chercheuse, Université de Naples Federico II Directrice de thèse
Marco Zito, CEAE06, IRFU, CEA Saclay Directeur de thèse
Vittorio Palladino, Professeur, Université de Naples Federico II Directeur de thèse (absent lors de la soutenance)
NNT : 20 18 SAC LS0 13
T2K (Tokai to Kamioka) is a long-baseline neutrino oscillation experiment installed in Japan and designed to measure neutrino flavor oscillations using an off-axis neutrino beam produced at the J-PARC accelerator facility in Tokai, on the east cost of Japan. The neu-trino beam travels toward the far detector Super-Kamiokande, located in the Mozumi mine, 295 km far from the neutrino production point. A near detector complex is located 280 m far from the beam target and it is used to measure the unoscillated flux and the neutrino cross-sections. The near detector complex consist of two detectors: one on the same axis of the beam, called INGRID and the other off-axis, called ND280. Since its
discovery of electron neutrino appearance in 2013 excluding θ13 = 0 with a significance of
7.3σ, T2K has switched its beam magnet polarities to run in antineutrino beam mode in order to enhance its sensitivity to the charge-parity violation in the leptonic sector. The beam is dominated by muon antineutrinos, but it also contains a sizeable contamination of muon neutrinos. The analysis of both neutrino and antineutrino charged-current in-teractions in the off-axis near detector ND280, provides a significant reduction of the flux prediction and cross-section modelling systematic uncertainties in the oscillation analysis. ND280 data also gives us the opportunity to measure antineutrino cross-sections at the energy around 600 MeV.
Information on (anti)neutrino scattering is vital for the interpretation of neutrino os-cillation. Many theoretical models have been developed to describe the nuclear effects in (anti)neutrino scattering, but a consistent picture has yet to emerge. In particular, various measurements of charged-current cross-section without production of pions in the final state have suggested the presence of another channel where neutrinos interact with pairs of correlated nucleons and more than one nucleon is knocked-out from the nucleus (multinucleon knock out). Various models have proposed different estimations of such process and a precise and unambiguous measurement is not yet available.
This thesis work is focused on three different arguments. First the selections of CC in-teractions of muon neutrinos in antineutrino beam in the off-axis near detector. In a first iteration this sample has been divided into two sub-sample based on the track multiplicity, then with more statistic a separation into three sub-samples based on the pion content in
pions in the final state using the off-axis near detector. The neutrino and antineutrino cross-sections will be simultaneously extracted as a function of muon momentum and angle with a likelihood fit, including proper estimation of the correlations, allowing the evaluation of the sum, difference and asymmetry between the two cross-sections. In the sum the axial vector interference term of the cross section is eliminated, while difference contains only this term and they could be used to test the presence of the multinucleon excitations, while the asymmetry between the two cross sections give a direct estimation on any possible bias due to mismodelling of neutrino interactions on the measurement of the CP violation phase in neutrino oscillation. The last topic concerns the proposal of the multi-PMT technology as detector for Hyper-Kamiokande, the upgrade of
Super-Kamiokande, and the intermediate water ˇCerenkov proposed to study the neutrino flux
at ∼1–2 km from the beam production point. A multi-PMT is a plastic sphere filled
with 26 photomultiplier tube that could improve the efficiency of the ˇCerenkov detectors
foreseen in the future.
This dissertation is organized in the following way: in Chapter 1 and Chapter 2 an introduction to neutrino oscillation physics and interaction is given to put in context the work, then in Chapter 3 the T2K experimental set-up is presented, Chapter 4 show the measurement of the intrinsic muon neutrino component in the antineutrino beam, in Chapter 5 the results of the measurement of muon neutrino and antineutrino cross sections without pions in the final state are discussed and in conclusion Chapter 6 is dedicated to the discussion of the future experiments, T2K phase two and Hyper-Kamiokande, and the multi-PMT proposal.
Summary XXVIII
R´esum´e XXXIII
Presentazione XXXVIII
1 Neutrino physics and oscillation 2
1.1 Neutrino in the Standard Model . . . 2
1.1.1 The neutrino mass problem . . . 5
1.1.2 The weak interaction . . . 6
1.2 Neutrino oscillations . . . 7
1.2.1 Neutrino oscillations in vacuum . . . 8
1.2.2 Oscillation in matter . . . 11
1.3 Neutrino oscillation experiments . . . 13
1.3.1 Solar neutrinos experiments . . . 14
1.3.2 Atmospheric neutrino experiments . . . 19
1.3.3 Reactor neutrino experiments . . . 22
1.3.4 Accelerator neutrino experiments . . . 23
1.4 Current knowledge of neutrino oscillation parameters . . . 27
2 Neutrino scattering 30 2.1 Neutrino-nucleons scattering . . . 30
2.1.1 Charged-Current Quasi-Elastic scattering . . . 32
2.1.2 Resonant pion production . . . 34
2.1.3 Deep Inelastic scattering . . . 35
2.2 Neutrino-nucleus scattering . . . 36
2.2.1 Nuclear models . . . 37
2.2.2 Final State Interactions . . . 39
2.2.3 Neutrino-nucleus exclusive channels . . . 40
2.3 Neutrino event generators . . . 42
2.4 Experimental status of neutrino scattering . . . 46 III
3.2 The neutrino beam . . . 52
3.2.1 The J-PARC complex . . . 52
3.3 The neutrino beamline . . . 53
3.3.1 The Muon Monitor . . . 56
3.3.2 The off-axis straregy . . . 56
3.3.3 Neutrino flux prediction . . . 58
3.4 The near detector complex . . . 60
3.4.1 The on-axis detector . . . 60
3.4.2 The off-axis detector . . . 61
3.4.3 The magnet . . . 62
3.4.4 The Side Muon Range Detector . . . 63
3.4.5 The π0 Detector . . . 64
3.4.6 The Time Projection Chambers . . . 65
3.4.7 The Fine-Grained Detector . . . 67
3.4.8 The Electromagnetic Calorimeter . . . 69
3.5 The far detector: Super-Kamiokande . . . 70
4 Measurement of the intrinsic muon neutrino component in the antineu-trino beam 73 4.1 The data sets . . . 74
4.2 νµ CC event selection in ¯ν-mode . . . 75
4.3 νµ CC Multiple track selection in ¯ν-mode . . . 81
4.4 νµ CC Multiple pion selection in ¯ν-mode . . . 84
4.5 Detector systematics . . . 91
4.6 Latest T2K oscillation results . . . 93
4.7 Conclusions and future outlook . . . 100
5 Measurement of muon neutrino and antineutrino cross sections without pions in the final state 101 5.1 Introduction . . . 101
5.2 Analysis Strategy . . . 103
5.2.1 Cross-section and signal definition . . . 103
5.2.2 Cross-section extraction method: binned likelihood fit . . . 104
5.3 Input for the cross sections extraction . . . 106
5.3.1 The data sets . . . 106
5.3.2 Event Selections . . . 107 5.3.3 Sidebands . . . 113 5.3.4 Analysis binning . . . 115 5.3.5 Efficiency . . . 121 5.3.6 Integrated flux . . . 122 5.3.7 Number of Targets . . . 123 5.4 Uncertainties evaluation . . . 126
5.4.1 Data statistical uncertainty . . . 127
5.4.2 Flux systematic uncertainty . . . 128 IV
5.4.5 Signal and background modelling systematic uncertainty . . . 136
5.4.6 Pion final state interaction systematic uncertainty . . . 140
5.4.7 Summary of all the uncertainties . . . 141
5.5 Fit results . . . 143
5.5.1 Fit results as function of reconstructed muon kinematics . . . 143
5.5.2 Cross section measurements . . . 143
5.6 Conclusions and future outlook . . . 165
6 Future perspectives: T2K-II and Hyper-Kamiokande 166 6.1 T2K phase II . . . 167
6.1.1 Beamline Upgrade . . . 167
6.1.2 Near Detector plan . . . 167
6.1.3 T2K-II expected physics outcomes . . . 170
6.2 Hyper-Kamiokande . . . 175
6.3 Physics capabilities . . . 176
6.4 Multi-PMT optical module . . . 179
6.4.1 The Multi-PMT Reference Design . . . 180
6.4.2 The mPMT Prototype . . . 181
6.5 Conclusions and future outlook . . . 184
Conclusions 186 Acknowledgments 188 Appendices 189 A Two neutrino mixing 190 B Oscillation in matter 192 C Fit validation 195 C.0.1 Pull studies . . . 195
C.0.2 Bias study . . . 198
C.0.3 Fake data studies . . . 198
1.1 A graphical representation of the Standard Model particles and interac-tion mediators along with their properties. The numbers in the green, red and orange boxes beside the particle symbols indicate the corre-sponding charges under the gauge group: electric charge, colour and
isospin respectively. . . 3
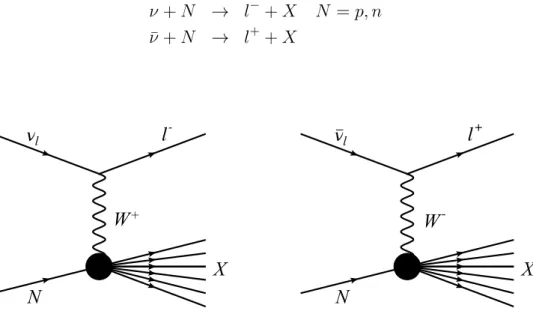
1.2 Feynman diagram of (anti)neutrino interaction vertex in the case of CC
(left) and NC (right) interactions. In the first case the outgoing lepton is positive if the interaction involve antineutrino and it is negative in the other case. The exchanged W boson is negative in antineutrino
interaction. . . 7
1.3 The two possible neutrino mass hierarchies. The colours represent the
approximate flavour admixtures present in each mass eigenstate. In the normal case, the masses exhibit a hierarchical pattern, and the lightest neutrino has the largest admixture of electron flavour. Figure taken from [35]. . . 11
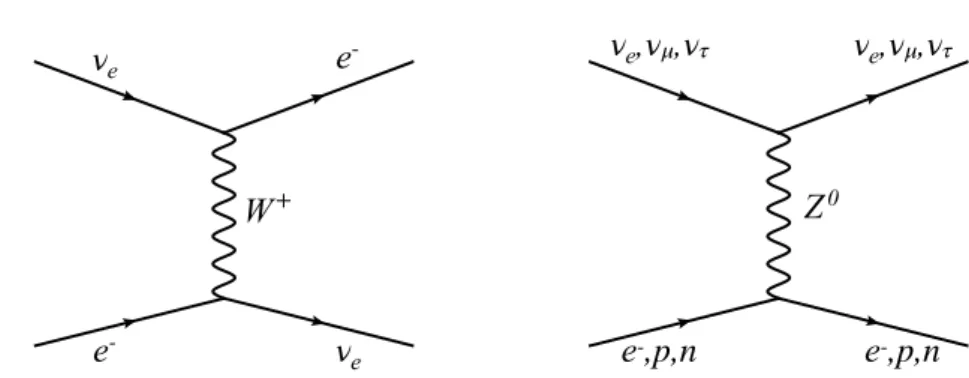
1.4 Feynman diagrams of the CC (left) and NC (right) elastic scattering
processes in matter. . . 11
1.5 The left figure shows the three principal cycles comprising the pp-chain
(ppI, ppII, and ppIII), the associated neutrinos that tag each of the three branches, and the theoretical branching percentages. The right figure shows the CNO cycle. Figure taken from [43]. . . 15
1.6 Solar neutrino spectrum along with the SSM uncertainties. Units for
continuous spectra are cm−2s−1M eV−1. Figure taken from [44]. . . 16
1.7 Schematic overview of the SNO experiment. Figure taken from [29]. . . 19
1.8 Schematic overview of the SK experiment. Figure taken from [29]. . . . 20
going particles have cos Θ > 0. The hatched region shows the Monte Carlo expectation for no oscillations. The bold line is the best-fit
expec-tation for νµ ↔ ντ oscillations with the overall flux normalization fitted
as a free parameter. Figure taken from [26]. . . 21
1.10 Ratio of measured neutrinos over expected ¯νe versus the distance of
different reactor antineutrino experiments. The solid dot is the Kam-LAND point plotted at a flux-weighted average distance (the dot size is indicative of the spread in reactor distances). The shaded region indi-cates the range of flux predictions corresponding to the 95% C.L. LMA region found in a global analysis of the solar neutrino data. The dotted
curve corresponds to sin22θ = 0.883 and ∆m2 = 5.5× 10⁻⁵eV2 and is
representative of recent best-fit LMA predictions while the dashed curve shows the case of small mixing angles (or no oscillation). Figure taken from [82]. . . 24
1.11 Regions of δCP versus sin2θ23 parameter space consistent with the
ob-served spectrum of νe candidates and the νµ disappearance data. The
top panel corresponds to normal mass hierarchy and the bottom panel to inverted hierarchy. The color intensity indicates the confidence level at which particular parameter combinations are allowed. Figure taken from [98]. . . 27
1.12 Feldman-Cousins significance at which each value of δCP is disfavoured
for each of the four possible combinations of mass hierarchy: normal
(blue) or inverted (red), and θ23octant: lower (solid) or upper (dashed),
by the combination of νe appearance and νµ disappearance
measure-ment. Figure taken from [98]. . . 27
1.13 Global 3ν oscillation analysis. Projections of the χ2 function onto the
parameters δm2, |∆m2|, sin2θij, and δ, for NO (blue) and IO (red). In
each panel, all the undisplayed parameters are marginalized, and the
offset ∆χ2IO−NO= 3.6 is included. Figure taken from [101]. . . 29
2.1 Feynman diagram of CC neutrino (left) and antineutrino (right)
inter-action. . . 31
2.2 Feynman diagram of CCQE neutrino (left) and antineutrino (right)
in-teraction. . . 33
2.3 Feynman diagram of one of the possible CC RES neutrino (left) and
antineutrino (right) interaction. . . 34
2.4 Feynman diagram of CC DIS neutrino (left) and antineutrino (right)
interaction. . . 35
2.5 Sketch of the proton and neutron potentials and states in the Fermi gas
model (B0 stands for the binding energy). Figure taken from [118]. . . . 37
2.6 Probability distribution for initial state nucleon as a function of the
mag-nitude of the nucleon momentum in SF model. Figure taken from [121]. 38
off individual nucleons, with the recoiling (A-1)–nucleon system acting as a spectator. Figure taken from [122]. . . 39
2.8 Schematic representation of the possible pion FSI interaction in the
nuclear matter. . . 39
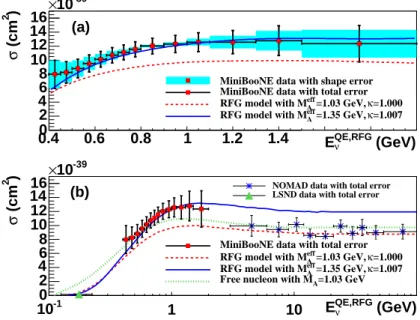
2.9 Flux-unfolded MiniBooNE νµCCQE cross section per neutron as a
func-tion of neutrino energy. In (a), shape errors are shown as shaded boxes along with the total errors as bars. In (b), a larger energy range is shown along with results from the LSND [132] and NOMAD [131] ex-periments. The prediction has been obtained using the RFG model with
two different value for the axial mass MA. Figure taken from [130]. . . . 41
2.10 Pictorial representation of a genuine CCQE (left) and 2p2h (right) process. 41
2.11 Inclusive cross section for scattering of electrons on carbon at 560 M eV
and 60 Deg (Q2 = 0.24 GeV2 at the QE peak), obtained with a free
∆ spectral function. The left dashed curve gives the contribution from true QE scattering, the dash-dotted curve that from 2p-2h processes, the dashed-dotted-dotted curve that from ∆ excitation and the dotted curve that from pion background terms. Figure taken from from [135]. . 42
2.12 MiniBooNE flux-integrated CCQE-like νµ-12C double differential cross
section per neutron for several values of muon kinetic energy as a func-tion of the scattering angle. Dashed curve: pure CCQE cross secfunc-tion calculated using RPA correction; solid curve: with the inclusion of np-nh component. The figure is taken from [136]. . . 42
2.13 Double-differential cross section as function of the available energy and
the 3-momentum transfer compared to the GENIE model with reduced pion production (small dot line), the same with RPA suppression (long-dashed), and then combined with a QE-like 2p2h component (solid). The 2p2h component is shown separately as a shaded region. Figure taken from [154]. . . 47
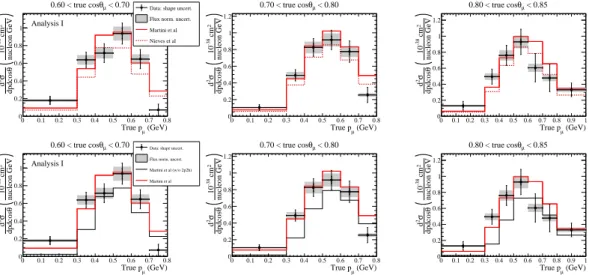
2.14 Results of CC-0π measurement from T2K compared with the Martini
and Nieves models (top raw) and with the model from Martini with and without 2p2h contribution (bottom raw). Figures taken from [155] . . . 48
2.15 T2K measurement of CC1π+ cross section as a function of pion
momen-tum (left) and angle (right), compared to NEUT and GENIE simulation. Figure taken from [158]. . . 48
3.1 A schematic of a neutrino journey from the neutrino beamline at
J-PARC, through the near detectors which are used to determine the prop-erties of the neutrino beam before the oscillation, to Super-Kamiokande located 295 km west of the beam source, 1000 m deep underground. . . 49
Data are from different experiment and are represented by different colours and marker symbols. The dominant contributing process at the T2K peak energy is CCQE (dashed) scattering, with contributions from RES (dot-dashed) and DIS (dotted) in the high-energy tail of the neutrino spectrum. Figure taken from [102]. . . 50
3.3 Oscillation probabilities as a function of the neutrino energy for νµ → νe
(left) and ¯νµ → ¯νe(right) transitions with L=295 km and sin22θ13= 0.1.
Black, red, green, and blue lines correspond to δCP = 0,12π, π, and
−1
2π, respectively. Solid (dashed) line represents the case for a normal
(inverted) mass hierarchy. Figure taken from [160]. . . 51
3.4 The difference between the energy reconstructed at T2K assuming CCQE
kinematics and the true energy for events with no pions in the final state. Black are the NEUT simulation of CCQE events and red are the NEUT simulation of resonant production where the ∆ is absorbed. The blue is the from the two-body current calculation of Nieves model. Figure taken from [160]. . . 52
3.5 Overview of the J-PARC accelerators. . . 53
3.6 Overview of the T2K beamlines. Figure taken from [159]. . . 54
3.7 Side view of the secondary beamline. The length of the decay volume
is ∼96 m. Figure taken from [159]. . . 54
3.8 The T2K target station. . . 55
3.9 Schematic representation of the off-axis configuration. . . 56
3.10 Muon neutrino disappearance (top figure) and electron neutrino
appear-ance (middle figure) probability at 295 km compared to the neutrino fluxes for different off-axis angles. The neutrino beam at SK has a peak energy at about 0.6 GeV maximizing the effect of the neutrino oscilla-tions at 295 km. . . 57
3.11 Expected neutrino energy as a function of the parent pion energy for
different values of the off-axis angle. . . 58
3.12 INGRID on-axis detector. Figure taken from [159]. . . 61
3.13 The left image shows the tracking planes (blue) and iron plates of an
INGRID module. The image in the middle shows veto planes in black of an INGRID module. The image on the right shows the proton module which is similar to the INGRID modules, but with finer grain scintillator
and without the iron plates. Figure taken from [159]. . . 61
3.14 A schematic view of the ND280 off-axis detector. . . 62
3.15 Event display of a muon track entering via the front face of the PØD
detector, continuing to the TPCs and FGDs and producing secondary particles on the way. The secondary particles are then stopped in the
ECal detectors. . . 62
3.16 View of SMRD scintillator counter components prior to assembly.
Fig-ure taken from [159]. . . 64
PØDule layers and Central ECal layers. Figure taken from [159]. . . 65
3.18 Simplified cut-away drawing showing the main aspects of the TPC
de-sign. The outer dimensions of the TPC are approximately 2.3×2.4×1.0
m3. Figure taken from [171]. . . 66
3.19 Distribution of the energy loss as a function of the momentum for
nega-tively (left) and posinega-tively (right) charged particles produced in neutrino interactions, compared to the expected curves for muons, electrons, pro-tons, and pions. Figure taken from [171]. . . 67
3.20 View of an FGD with the front cover removed. XY scintillator modules
(green) hang perpendicular to the direction of the neutrino beam. Along the top, six mini-crates with electronics can be seen without their cooling lines, while on the right side the cooling lids covering the mini-crates are shown. Figure taken from [159]. . . 68
3.21 Reconstructed energy depositions as a function of the track lenght for
muons, pions and protons in FGD1 (left) and FGD2 (right). . . 69
3.22 External view of one ECal module. The scintillator bars run horizontally
inside the module as shown. The readout electronics, signal and power cables, and cooling pipes can be seen mounted on the aluminium plates on the sides of the module. The gray surface at the top is the carbon fiber sandwich front plate, which in the final module position is facing towards the inner subdetectors (PØD, FGDs and TPCs). Figure taken from [159]. . . 70
3.23 Diagram of the Super-Kamiokande Detector. It is mainly comprised of
two segments, the inner and outer detectors. The boundary between the two segments is defined by a cylindrical scaffold used to mount photomultiplier tubes and optically separate the segments. Figure taken from [159]. . . 71
3.24 Example of reconstructed T2K events in Super-Kamiokande for (a) a
muon-like ring and (b) an electron-like ring. Each colored point repre-sents a PMT, with the color corresponding to the amount of charge, and the reconstructed cone is shown as a white line. The second figure in the upper right corner shows the same hit map for the OD. The white crosses indicate the location of the reconstructed vertex. . . 72
4.1 The T2K unoscillated flux prediction at ND280 (top) and SK (bottom)
for neutrino (left) and antineutrino (right) modes. . . 74
4.2 Schematic view of the FGD1 (left) and FGD2 (right) FV. . . 76
4.3 MIP likelihood on the left and muon likelihood on the right. The arrows
indicate the cut used. Different colours indicate different final state particles. . . 78
4.4 Muon likelihood versus the reconstructed muon momentum. Different
colours indicate different final state particles following the same legend of Fig. 4.3. . . 78
the CC-Inclusive sample. Different colours indicate different particle.
MC is scaled to POT in data. . . 80
4.6 Distribution of events with vertex in FGD2 FV as function of the
reconstructed muon momentum (left) and scattering angle (right) for the CC-Inclusive sample. Different colours indicate different particle.
MC is scaled to POT in data. . . 80
4.7 Distribution of events with vertex in FGD1 FV as function of the
reconstructed muon momentum (left) and scattering angle (right) for the CC-1-Track sample. Different colours indicate different topologies.
MC is scaled to POT in data. . . 82
4.8 Distribution of events with vertex in FGD1 FV as function of the
reconstructed muon momentum (left) and scattering angle (right) for the CC-N-Tracks sample. Different colours indicate different topologies.
MC is scaled to POT in data. . . 82
4.9 Distribution of events with vertex in FGD2 FV as function of the
reconstructed muon momentum (left) and scattering angle (right) for the CC-1-Track sample. Different colours indicate different topologies.
MC is scaled to POT in data. . . 83
4.10 Distribution of events with vertex in FGD2 FV as function of the
reconstructed muon momentum (left) and scattering angle (right) for the CC-N-Tracks sample. Different colours indicate different topologies.
MC is scaled to POT in data. . . 83
4.11 Number of Michel electron in CC-Inclusive sample for events with
reconstructed vertex in FGD1 FV (top left) and FGD2 FV (top right). On the bottom the same figures zoomed to better display events with more than one Michel electron. Colors indicate different topologies. The MC is normalized to the POT in data. . . 85
4.12 Distribution of events with vertex in FGD1 FV as function of the
reconstructed muon momentum (left) and scattering angle (right) for the CC-0π-like sample. Different colours indicate different topologies.
MC is scaled to POT in data. . . 86
4.13 Distribution of events with vertex in FGD1 FV as function of the
reconstructed muon momentum (left) and scattering angle (right) for the
CC-1π+-like sample. Different colours indicate different topologies.
MC is scaled to POT in data. . . 87
4.14 Distribution of events with vertex in FGD1 FV as function of the
reconstructed muon momentum (left) and scattering angle (right) for the CC-Other-like sample. Different colours indicate different topologies.
MC is scaled to POT in data. . . 87
4.15 Distribution of events with vertex in FGD2 FV as function of the
reconstructed muon momentum (left) and scattering angle (right) for the CC-0π-like sample. Different colours indicate different topologies.
MC is scaled to POT in data. . . 87
CC-1π+-like sample. Different colours indicate different topologies.
MC is scaled to POT in data. . . 88
4.17 Distribution of events with vertex in FGD2 FV as function of the
reconstructed muon momentum (left) and scattering angle (right) for the CC-Other-like sample. Different colours indicate different topologies.
MC is scaled to POT in data. . . 88
4.18 The SK flux parameters for the νµ (top left) in ν-mode, ¯νµ (top right)
and νµ (bottom) in ¯ν-mode, shown as a fraction of the nominal value.
The bands indicate the 1σ uncertainty on the parameters before (solid, red) and after (hatched, blue) the near detector fit. Figure taken from [176]. 95
4.19 Cross-section parameters before (solid, red) and after (hatched, blue)
the near detector fit, shown as a fraction of the nominal value. The colored band shows the 1σ uncertainty. Figure taken from [176]. . . 95
4.20 Total error envelopes for the reconstructed energy distributions of νµ
CC (left) and νe CC (right) candidate events, using typical oscillation
parameter values, with and without the ND280 constraint applied. . . . 97
4.21 Contours in the sin2θ13–δCP plane using T2K-only data, obtained by
analysing either the ν- or ¯ν-mode appearance datasets which are
com-pared for both orderings. The yellow band corresponds to the reactor
value on sin2θ13 from the PDG 2015 [182]. Figure taken from [176]. . . 98
4.22 Comparison of two-dimensional constant ∆χ2contours in the δCP–sin2θ13
plane using T2K data with the reactor constraint, for both four-sample (red) and five-sample (black) analyses with normal (left) and inverted (right) mass ordering hypotheses. The contours are produced by marginal-izing the likelihood with respect to all parameters other than the pa-rameters of interest. Figure taken from [176]. . . 99
4.23 One dimensional ∆χ2 surfaces for δCP using T2K data with the reactor
constraint. The critical ∆χ2 values obtained with the Feldman-Cousins
method are used to evaluate the 90% confidence level. Figure taken from [176]. . . 99
5.1 On the left: νµ (upper panel) and ¯νµ (lower panel) - 12C CCQE per
neutron and per proton with and without the multinucleon component as a function of neutrino energy. The experimental points are taken from [184]. On the right: ratio of multinucleon component of CCQE
cross section on12C to the single nucleon one for νµand ¯νµas a function
of neutrino energy. Both figures are taken from [188]. . . 102
5.2 Distribution of νµ events in the different signal regions as function of
the reconstructed muon momentum (left column) and scattering angle (right column). Different colors indicate different topologies. The legend show also the purity for each true topology. . . 109
(right column). Different colors indicate different topologies. The MC is normalized for POT in data. The legend show also the purity for each true topology. . . 112
5.4 Distribution of νµ events in the different sideband regions as function of
the reconstructed muon momentum (left column) and scattering angle
(right column) for the CC-1π+-like (top row) and CC-Other-like
(bot-tom row) samples. Different colors indicate different topologies. The MC is normalized for POT in data. The legend show also the purity for
each true topology. . . 113
5.5 Distribution of ¯νµ events in the different sideband regions as function of
the reconstructed muon momentum (left column) and scattering angle
(right column) for the CC-1π−-like (top row) and CC-Other-like
(bot-tom row) samples. Different colors indicate different topologies. The MC is normalized for POT in data. The legend show also the purity for
each true topology. . . 114
5.6 Cosine theta resolution for each bin for νµ (left) ¯νµ (right) CC-0π events.116
5.7 Transfer matrix (left) and normalized transfer matrix (right) for
angu-lar bins obtained from nominal MC summing the contribution from all
the samples for νµ CC-0π events. Each row/column corresponds to an
angular bin going from 0 = [−1, 0.2] to 7 = [0.98, 1]. . . 116
5.8 Transfer matrix (left) and normalized transfer matrix (right) for
angu-lar bins obtained from nominal MC summing the contribution from all
the samples for ¯νµ CC-0π events. Each row/column corresponds to an
angular bin going from 0 = [−1, 0.2] to 7 = [0.98, 1]. . . 117
5.9 Momentum resolution for each true angular and momentum bin for νµ
CC-0π events. . . 118
5.10 Momentum resolution for each true angular and momentum bin for ¯νµ
CC-0π events. . . 118
5.11 Transfer matrix (left) and normalized transfer matrix (right) for
an-gular bins obtained from nominal MC summing the contribution from
all the samples for νµ CC-0π events. Dashed lines indicate the
an-gular boundaries. Each row/column corresponds to a bin going from
0 = [−1 6 cos θtrueµ 6 0.2, 0 GeV /c 6 ptrueµ 6 30 GeV /c] to 57 = [0.98 6
cos θtrueµ 6 1, 0 GeV /c 6 ptrueµ 6 30 GeV /c]. . . 119
5.12 Transfer matrix (left) and normalized transfer matrix (right) for
an-gular bins obtained from nominal MC summing the contribution from
all the samples for ¯νµ CC-0π events. Dashed lines indicate the
an-gular boundaries. Each row/column corresponds to a bin going from
0 = [−1 6 cos θtrueµ 6 0.2, 0 GeV /c 6 ptrueµ 6 30 GeV /c] to 57 = [0.98 6
cos θtrueµ 6 1, 0 GeV /c 6 ptrueµ 6 30 GeV /c]. . . 119
5.13 True (solid line) and reconstructed (dots) signal and background of the
νµ sample as function of the muon kinematics using the optimized
bin-ning. The bin entries are not divided by the bin width. . . 120
ning. The bin entries are not divided by the bin width. . . 120
5.15 Efficiency versus the true muon momentum (left) and true muon
co-sine theta (right) for νµ CC-0π events. The different colours show the
efficiency for each signal region. . . 121
5.16 Efficiency versus the true muon momentum (left) and true muon
co-sine theta (right) for ¯νµ CC-0π events. The different colours show the
efficiency for each signal region. . . 122
5.17 Efficiency as function of the double differential binning reported in
Tab. XXIII. . . 122
5.18 FGD1 fiducial volume definition in orange used for this analysis on the
top, and scintillator layers scheme on the bottom. Picture taken from [192].125
5.19 Relative uncertainty due to data statistics for νµ (red) and ¯νµ (dark
cyan) CC-0π cross section in bins of true muon kinematics. . . 127
5.20 Flux covariance (left) and correlation (right) matrices. The bin number
correspond to the parameter number in Tab. XXVI. . . 128
5.21 Relative uncertainty due to flux systematic for νµ (red) and ¯νµ (dark
cyan) CC-0π cross section in bins of true muon kinematics. Solid line show the fractional uncertainty when the detector parameter are fitted, while the dashed line when they are not fitted. . . 130
5.22 Relative uncertainty due to flux systematic for νµ (red) and ¯νµ (dark
cyan) CC-0π cross section in bins of true muon kinematics. . . 130
5.23 Normalized detector covariance (left) and correlation (right) matrix
ac-cording to the binning used for the cross section extraction reported in Tab. XXIII. Each bin represents the relative uncertainty in the number of selected events in bins of reconstructed muon kinematics. The dotted lines divided the contribution from each samples, which is, going from
left to the right: νµ signal region, the first and second νµ sideband, the
¯
νµ signal region and the two ¯νµ sideband. The bins within each sample
are ordered in increasing momentum intervals, each containing all
an-gular bins from 0 = [−1 6 cos θµtrue6 0.2, 0 GeV /c 6 ptrueµ 6 30 GeV /c]
to 57 = [0.98 6 cos θtrueµ 6 1, 0 GeV /c 6 ptrueµ 6 30 GeV /c]. . . 131
5.24 Normalized detector covariance (left) and correlation (right) matrix
ac-cording to the averaged binning reported in Tab. XXVII. Each bin rep-resents the relative uncertainty in the number of selected events in bins of reconstructed muon kinematics. The dotted lines divided the con-tribution from each samples, which is, going from left to the right:
νµ signal region, the first and second νµ sideband, the ¯νµ signal
re-gion and the two ¯νµ sidebands. The bins within each sample are
or-dered in increasing momentum intervals, each containing all angular
bins from 0 = [−1 6 cos θµtrue 6 0.2, 0 GeV /c 6 ptrueµ 6 30 GeV /c] to
57 = [0.98 6 cos θtrueµ 6 1, 0 GeV /c 6 ptrueµ 6 30 GeV /c]. . . 132
show the fractional uncertainty when the detector parameter are fitted, while the dashed line when they are not fitted. . . 133
5.26 Relative uncertainty due to detector systematic for νµ(red) and ¯νµ(dark
cyan) CC-0π cross section in bins of true muon kinematics. . . 134
5.27 Covariance matrix of the elements composing FGD1. . . 135
5.28 Number of targets for 104 toys. The distribution is produced varying
the areal density of the elements composing the FGD1 fiducial volume following the covariance matrix from Fig. 5.27. . . 136
5.29 Covariance matrix of the signal and background modelling. The bin
number correspond to the order in Tab. XXVIII. The displayed values are the uncertainties divided by the means. . . 137
5.30 Relative uncertainty due to signal modelling systematic for νµ(red) and
¯
νµ (dark cyan) CC-0π cross section in bins of true muon kinematics. . . 139
5.31 Relative uncertainty due to background modelling systematic for νµ
(red) and ¯νµ (dark cyan) CC-0π cross section in bins of true muon
kinematics. . . 139
5.32 Pion FSI covariance matrix.The bin number correspond to the order in
Tab. XXIX. The displayed values are the uncertainties divided by the means and the off-diagonal terms reflect the correlations between the different parameters. . . 140
5.33 Relative uncertainty due to pion FSI modelling systematic for νµ (red)
and ¯νµ (dark cyan) CC-0π cross section in bins of true muon kinematics. 141
5.34 Summary of all the uncertainties on the νµ CC-0π cross section in bins
of true muon kinematics. . . 142
5.35 Summary of all the uncertainties on the ¯νµ CC-0π cross section in bins
of true muon kinematics. . . 142
5.36 ν¯µ CC-0π number of events as a function of reconstructed muon
kine-matics. The red solid lines shown the fit results with systematics uncer-tainties, the dots shows the data with statistical unceruncer-tainties, finally the blue dotted line show the nominal NEUT MC used as prior in the fit.144
5.37 νµ CC-0π number of events as a function of reconstructed muon
kine-matics. The red solid lines shown the fit results with systematics uncer-tainties, the dots shows the data with statistical unceruncer-tainties, finally the blue dotted line show the nominal NEUT MC used as prior in the fit.145
5.38 Distribution of νµ events in the different sideband regions as function of
the reconstructed muon momentum (left column) and scattering angle
(right column) for the CC-1π+-like (top row) and CC-Other-like
(bot-tom row) samples. The legend is the same as in Fig. 5.36: the red solid lines shown the fit results with systematics uncertainties, the dots shows the data with statistical uncertainties, finally the blue dotted line show the nominal NEUT MC used as prior in the fit. . . 146
(right column) for the CC-1π−-like (top row) and CC-Other-like (bot-tom row) samples. The legend is the same as in Fig. 5.36: the red solid lines shown the fit results with systematics uncertainties, the dots shows the data with statistical uncertainties, finally the blue dotted line show the nominal NEUT MC used as prior in the fit. . . 147
5.40 Measured ¯νµ CC-0π cross section in bins of true muon kinematics with
shape uncertainty (error band) and fully correlated normalization un-certainty (red band). The result is compared with the NEUT prediction for CC-0π (blue line), CC-0π without 2p2h (orange line), CCQE (pink line) and 2p2h (green line). The last bin, up to 30 GeV /c is not displayed.150
5.41 Measured νµ CC-0π cross section in bins of true muon kinematics with
shape uncertainty (error band) and fully correlated normalization un-certainty (red band).The result is compared with the NEUT prediction for CC-0π (blue line), CC-0π without 2p2h (orange line), CCQE (pink line) and 2p2h (green line). The last bin, up to 30 GeV /c is not displayed.151
5.42 Measured cross sections sum in bins of true muon kinematics with shape
uncertainty (error band) and fully correlated normalization uncertainty (red band). The result is compared with the NEUT prediction for CC-0π (blue line), CC-0π without 2p2h (orange line), CCQE (pink line) and 2p2h (green line). The last bin, up to 30 GeV /c is not displayed. . . 152
5.43 Measured cross sections difference in bins of true muon kinematics with
shape uncertainty (error band) and fully correlated normalization un-certainty (red band). The result is compared with the NEUT prediction for CC-0π (blue line), CC-0π without 2p2h (orange line), CCQE (pink line) and 2p2h (green line). The last bin, up to 30 GeV /c is not displayed.153
5.44 Measured cross sections asymmetry in bins of true muon kinematics
with shape uncertainty (error band) and fully correlated normalization uncertainty (red band). The result is compared with the NEUT predic-tion for CC-0π (blue line), CC-0π without 2p2h (orange line), CCQE (pink line) and 2p2h (green line). The last bin, up to 30 GeV /c is not displayed. . . 154
5.45 Measured ¯νµ CC-0π cross section in bins of true muon kinematics with
shape uncertainty (error band) and fully correlated normalization un-certainty (red band). The result is compared with the CC-0π NEUT (blue line) and GENIE (dotted green line) prediction. The last bin, up to 30 GeV /c is not displayed. . . 155
5.46 Measured νµ CC-0π cross section in bins of true muon kinematics with
shape uncertainty (error band) and fully correlated normalization un-certainty (red band). The result is compared with the CC-0π NEUT (blue line) and GENIE (dotted green line) prediction. The last bin, up to 30 GeV /c is not displayed. . . 156
(red band). The result is compared with the CC-0π NEUT (blue line) and GENIE (dotted green line) prediction. The last bin, up to 30 GeV /c is not displayed. . . 157
5.48 Measured cross sections difference in bins of true muon kinematics with
shape uncertainty (error band) and fully correlated normalization un-certainty (red band). The result is compared with the CC-0π NEUT (blue line) and GENIE (dotted green line) prediction. The last bin, up to 30 GeV /c is not displayed. . . 158
5.49 Measured cross sections asymmetry in bins of true muon kinematics
with shape uncertainty (error band) and fully correlated normalization uncertainty (red band). The result is compared with the CC-0π NEUT (blue line) and GENIE (dotted green line) prediction. The last bin, up to 30 GeV /c is not displayed. . . 159
5.50 Measured ¯νµ CC-0π cross section in bins of true muon kinematics with
shape uncertainty (error band) and fully correlated normalization un-certainty (red band). The result is compared with the model by Martini et al. without (blue dotted line) and with 2p2h (solid line) prediction.
The first angle bin (−1 < cos θ < 0.2) and the last bin, up to 30 GeV/c,
are not displayed. In the last angle bin the momentum bin between 3.0 and 5.0 GeV /c is not displayed, since the Martini model predicts the cross section up to 3 GeV /c. . . 160
5.51 Measured νµ CC-0π cross section in bins of true muon kinematics with
shape uncertainty (error band) and fully correlated normalization un-certainty (red band). The result is compared with the Martini model without (blue dotted line) and with 2p2h (solid line) prediction. The
first angle bin (−1 < cos θ < 0.2) and the last bin, up to 30 GeV/c, are
not displayed. In the last angle bin the momentum bin between 3.0 and 5.0 GeV /c is not displayed, since the Martini model predicts the cross
section up to 3 GeV /c. . . 161
5.52 Measured cross sections sum in bins of true muon kinematics with shape
uncertainty (error band) and fully correlated normalization uncertainty (red band). The result is compared with the Martini model without (blue dotted line) and with 2p2h (solid line) prediction. The first angle
bin (−1 < cos θ < 0.2) and the last bin, up to 30 GeV/c, are not
displayed. In the last angle bin the momentum bin between 3.0 and 5.0 GeV /c is not displayed, since the Martini model predicts the cross section momentum up to 3 GeV /c. . . 162
certainty (red band). The result is compared with the Martini model without (blue dotted line) and with 2p2h (solid line) prediction. The
first angle bin (−1 < cos θ < 0.2) and the last bin, up to 30 GeV/c, are
not displayed. In the last angle bin the momentum bin between 3.0 and 5.0 GeV /c is not displayed, since the Martini model predicts the cross
section up to 3 GeV /c. . . 163
5.54 Measured cross sections asymmetry in bins of true muon kinematics
with shape uncertainty (error band) and fully correlated normalization uncertainty (red band). The result is compared with the Martini model without (blue dotted line) and with 2p2h (solid line) prediction. The
first angle bin (−1 < cos θ < 0.2) and the last bin, up to 30 GeV/c, are
not displayed. In the last angle bin the momentum bin between 3.0 and 5.0 GeV /c is not displayed, since the Martini model predicts the cross
section up to 3 GeV /c. . . 164
6.1 Beam power and POT accumulation plan as function of calendar year. . 167
6.2 A schematic view of the upgraded ND280 detector. In place of the PØD
there is a target sandwiched between two horizontal TPCs. . . 168
6.3 A schematic view of the SuperFGD. . . 168
6.4 Schematic view of 3D grid-like structure of plastic scintillator bars inside
the WAGASCI detector. Figure taken from [100]. . . 169
6.5 νe CC inclusive differential cross-sections as a function of pe(left), cos θe
(right). The inner (outer) error bars show the statistical (total) uncer-tainty on the data. The dashed (solid) line shows the NEUT (GENIE) prediction. Overflow (underflow) bins are indicated by > (<) labels, and are normalized to the width shown. . . 171
6.6 Distribution of CCQE and 2p2h contributions as a function of muon
momentum in the angular range cos θ = [0.7, 0.8] at ND280 (left) and Super-K (right) as predicted in the Martini (continuous line) and Nieves (histogram) models. . . 172
6.7 Sensitivity as a function of true δCP (left) and accumulated POT (right)
with three values of sin2θ23(0.43, 0.50, 0.60) and normal hierarchy. For
the full T2K-II exposure of 20 × 1021 POT with a reduction of the
systematic error to 2/3 of the present T2K uncertainties compared with the present sensitivity. Figure taken from [183]. . . 173
6.8 Expected 90% C.L. sensitivity to ∆m232 and sin2θ23 with the current
T2K systematic error. For the T2K-II exposure of 20× 1021 POT, a
50% increase in effective statistics is assumed. Top left plot has been
obtained with true sin2θ23 = 0.43, top right with true sin2θ23= 0.6 and
the plot on the bottom with true sin2θ23= 0.5. Figure taken from [183]. 174
6.9 Schematic view of one HK detector. Figure take from [100]. . . 175
6.10 Sensitivity to exclude sin δCP = 0 for normal mass hierarchy (left) and
expected 68% C.L. uncertainty of δCP as a function of running time. . . 177
the expected hierarchy (octant) sensitivity as a function of true value
of sin2θ23 for three exposures: 1 year (grey), 5 years (blue), 10 years
(orange). Figure taken from [100]. . . 178
6.12 Multi-PMT conceptual drawing for IWCD with 7.7 cm PMTs as ID
detectors and the OD detectors on the other half. Each small PMT has a reflector cone. An 50 cm acrylic covers on an aluminium cylinder is used as pressure vessel. Readout electronics and calibration sources are placed inside the vessel. . . 181
6.13 Transmittance (left) and reflectance (right) as function of the
wave-length for different acrylics. . . 182
6.14 Preliminary design of the mPMT vessel with its cooling system in the
equator of the sphere. . . 183
6.15 ADC output of one channel of CITIROC. Input signal of 1 Hz and
voltage 5 mV . . . 184
6.16 A schematic view of the Multi-PMT design. . . 185
C.1 Mean and width of the pulls distributions defined in Eq. C.3 for the
parameters of interest for neutrino on the left and antineutrino on the right. . . 196
C.2 Mean and width of the pulls distributions defined in Eq. C.4 for the flux
(top left), background cross section modelling (top right) and pion FSI (bottom) parameters. . . 197
C.3 Mean of the bias (pF it − pT hrown) for the flux (left), background cross
section modelling (center) and pion FSI (right) parameters. . . 197
C.4 Mean of the bias distribution defined in Eq. C.5 generated by applying
fluctuation due to either systematic and statistical uncertainties (left) or only systematics uncertainties (right). The legend indicates if the bias is computed for the neutrino or antineutrino sample. . . 198
C.5 Fractional bias in case of asimov fit for the νµ (left) and ¯νµ CC-0π cross
section (right) in bins of true muon kinematics. . . 199
C.6 νµ CC-0π cross section in bins of true muon kinematics obtained with
an asimov fit with shape uncertainty (error band) and fully correlated normalization uncertainty (red band). The result is compared with the NEUT prediction for CC-0π (blue line), CCQE (pink line) and CCQE plus pion absorption(cyan line). The NEUT prediction for 2p2h is
dis-played as well. The last bin, up to 30 GeV /c, is not disdis-played. . . 200
C.7 ν¯µ CC-0π cross section in bins of true muon kinematics obtained with
an asimov fit with shape uncertainty (error band) and fully correlated normalization uncertainty (red band). The result is compared with the NEUT prediction for CC-0π (blue line), CCQE (pink line) and CCQE plus pion absorption(cyan line). The NEUT prediction for 2p2h is
dis-played as well. The last bin, up to 30 GeV /c, is not disdis-played. . . 201
malization uncertainty (red band). The result is compared with the NEUT prediction for CC-0π (blue line), CCQE (pink line) and CCQE plus pion absorption(cyan line). The NEUT prediction for 2p2h is
dis-played as well. The last bin, up to 30 GeV /c, is not disdis-played. . . 202
C.9 Cross sections difference in bins of true muon kinematics obtained with
an asimov fit with shape uncertainty (error band) and fully correlated normalization uncertainty (red band). The result is compared with the NEUT prediction for CC-0π (blue line), CCQE (pink line) and CCQE plus pion absorption(cyan line). The NEUT prediction for 2p2h is
dis-played as well. The last bin, up to 30 GeV /c, is not disdis-played. . . 203
C.10 Cross sections asymmetry in bins of true muon kinematics obtained
with an asimov fit with shape uncertainty (error band) and fully cor-related normalization uncertainty (red band). The result is compared with the NEUT prediction for CC-0π (blue line), CCQE (pink line) and CCQE plus pion absorption(cyan line). The NEUT prediction for 2p2h is displayed as well. The last bin, up to 30 GeV /c, is not displayed. . . . 204
C.11 Fractional bias between the result of the fit and the fake data for the νµ
(left) and ¯νµCC-0π cross section (right) in bins of true muon kinematics.
The fake data used is NUET with RFG+RPA as nuclear model and 2p2h increased by a factor of two. . . 205
C.12 ν¯µ CC-0π cross section in bins of true muon kinematics obtained using
NEUT prediction with RFG+RPA as nuclear model and 2p2h increased by a factor of two as fake data and NEUT as nominal. The result is compared with the nominal and fake data prediction. The error bars stand for the shape uncertainty while the red band are the fully corre-lated normalization uncertainty. The last bin, up to 30 GeV /c, is not displayed. . . 206
C.13 ν¯µ CC-0π cross section in bins of true muon kinematics obtained using
NEUT prediction with RFG+RPA as nuclear model and 2p2h increased by a factor of two as fake data and NEUT as nominal. The result is compared with the nominal and fake data prediction. The error bars stand for the shape uncertainty while the red band are the fully corre-lated normalization uncertainty. The last bin, up to 30 GeV /c, is not displayed. . . 207
C.14 Sum of the cross sections in bins of true muon kinematics obtained
us-ing NEUT prediction with RFG+RPA as nuclear model and the 2p2h component increased by a factor of two as fake data and NEUT as nom-inal. The result is compared with the nominal and fake data prediction. The error bars stand for the shape uncertainty while the red band are the fully correlated normalization uncertainty. The last bin, up to 30 GeV /c, is not displayed. . . 208
component increased by a factor of two as fake data and NEUT as nom-inal. The result is compared with the nominal and fake data prediction. The error bars stand for the shape uncertainty while the red band are the fully correlated normalization uncertainty. The last bin, up to 30 GeV /c, is not displayed. . . 209
C.16 Asymmetry of the cross sections in bins of true muon kinematics
ob-tained using NEUT prediction with RFG+RPA as nuclear model and the 2p2h component increased by a factor of two as fake data and NEUT as nominal. The result is compared with the nominal and fake data pre-diction. The error bars stand for the shape uncertainty while the red band are the fully correlated normalization uncertainty. The last bin, up to 30 GeV /c, is not displayed. . . 210
C.17 Fractional bias between the result of the fit and the fake data for the νµ
(left) and ¯νµCC-0π cross section (right) in bins of true muon kinematics.
The fake data used is NEUT with 2p2h increased by a factor of two. . . 212
C.18 Fractional bias between the result of the fit and the fake data for the νµ
(left) and ¯νµCC-0π cross section (right) in bins of true muon kinematics.
The fake data used is NEUT prediction without 2p2h. . . 212
C.19 νµ CC-0π cross section in bins of true muon kinematics obtained using
NEUT prediction with 2p2h increased by a factor of two as fake data and NEUT as nominal. The result is compared with the nominal and fake data prediction. The error bars stand for the shape uncertainty while the red band are the fully correlated normalization uncertainty. The last bin, up to 30 GeV /c, is not displayed. . . 213
C.20 ν¯µ CC-0π cross section in bins of true muon kinematics obtained using
NEUT prediction with 2p2h increased by a factor of two as fake data and NEUT as nominal. The result is compared with the nominal and fake data prediction. The error bars stand for the shape uncertainty while the red band are the fully correlated normalization uncertainty. The last bin, up to 30 GeV /c, is not displayed. . . 214
C.21 Sum of the cross sections in bins of true muon kinematics obtained using
NEUT prediction with 2p2h increased by a factor of two as fake data and NEUT as nominal. The result is compared with the nominal and fake data prediction. The error bars stand for the shape uncertainty while the red band are the fully correlated normalization uncertainty. The last bin, up to 30 GeV /c, is not displayed. . . 215
C.22 Difference of the cross sections in bins of true muon kinematics obtained
using NEUT prediction with 2p2h increased by a factor of two as fake data and NEUT as nominal. The result is compared with the nominal and fake data prediction. The error bars stand for the shape uncertainty while the red band are the fully correlated normalization uncertainty. The last bin, up to 30 GeV /c, is not displayed. . . 216
as fake data and NEUT as nominal. The result is compared with the nominal and fake data prediction. The error bars stand for the shape uncertainty while the red band are the fully correlated normalization uncertainty. The last bin, up to 30 GeV /c, is not displayed. . . 217
C.24 νµ CC-0π cross section in bins of true muon kinematics obtained using
NEUT prediction without 2p2h as fake data and NEUT as nominal. The result is compared with the nominal and fake data prediction. The error bars stand for the shape uncertainty while the red band are the fully correlated normalization uncertainty. The last bin, up to 30 GeV /c, is not displayed. . . 218
C.25 ν¯µ CC-0π cross section in bins of true muon kinematics obtained using
NEUT prediction without 2p2h as fake data and NEUT as nominal. The result is compared with the nominal and fake data prediction. The error bars stand for the shape uncertainty while the red band are the fully correlated normalization uncertainty. The last bin, up to 30 GeV /c, is not displayed. . . 219
C.26 Sum of the cross sections in bins of true muon kinematics obtained using
NEUT prediction without 2p2h as fake data and NEUT as nominal. The result is compared with the nominal and fake data prediction. The error bars stand for the shape uncertainty while the red band are the fully correlated normalization uncertainty. The last bin, up to 30 GeV /c, is not displayed. . . 220
C.27 Difference of the cross sections in bins of true muon kinematics obtained
using NEUT prediction without 2p2h as fake data and NEUT as nomi-nal. The result is compared with the nominal and fake data prediction. The error bars stand for the shape uncertainty while the red band are the fully correlated normalization uncertainty. The last bin, up to 30 GeV /c, is not displayed. . . 221
C.28 Asymmetry of the cross sections in bins of true muon kinematics
ob-tained using NEUT prediction without 2p2h as fake data and NEUT as nominal. The result is compared with the nominal and fake data prediction. The error bars stand for the shape uncertainty while the red band are the fully correlated normalization uncertainty. The last bin, up to 30 GeV /c, is not displayed. . . 222
C.29 Fractional bias between the result of the fit and the fake data for the νµ
(left) and ¯νµ CC-0π cross section (right) in bins of true muon
kinemat-ics. The fake data used is NEUT prediction with a lower ”wrong sign” component in the different beams. . . 223
C.30 νµ CC-0π cross section in bins of true muon kinematics obtained using
NEUT prediction with a lower ”wrong sign” component in the different beams as fake data and NEUT as nominal. The result is compared with the nominal and fake data prediction. The error bars stand for the shape uncertainty while the red band are the fully correlated normalization uncertainty. The last bin, up to 30 GeV /c, is not displayed. . . 224
beams as fake data and NEUT as nominal. The result is compared with the nominal and fake data prediction. The error bars stand for the shape uncertainty while the red band are the fully correlated normalization uncertainty. The last bin, up to 30 GeV /c, is not displayed. . . 225
C.32 Sum of the cross sections in bins of true muon kinematics obtained using
NEUT prediction with a lower ”wrong sign” component in the different beams as fake data and NEUT as nominal. The result is compared with the nominal and fake data prediction. The error bars stand for the shape uncertainty while the red band are the fully correlated normalization uncertainty. The last bin, up to 30 GeV /c, is not displayed. . . 226
C.33 Difference of the cross sections in bins of true muon kinematics
ob-tained using NEUT prediction with a lower ”wrong sign” component in the different beams as fake data and NEUT as nominal. The result is compared with the nominal and fake data prediction. The error bars stand for the shape uncertainty while the red band are the fully corre-lated normalization uncertainty. The last bin, up to 30 GeV /c, is not displayed. . . 227
C.34 Asymmetry of the cross sections in bins of true muon kinematics
ob-tained using NEUT prediction with a lower ”wrong sign” component in the different beams as fake data and NEUT as nominal. The result is compared with the nominal and fake data prediction. The error bars stand for the shape uncertainty while the red band are the fully corre-lated normalization uncertainty. The last bin, up to 30 GeV /c, is not displayed. . . 228
C.35 Fractional bias between the result of the fit and the fake data for the νµ
(left) and ¯νµCC-0π cross section (right) in bins of true muon kinematics.
The fake data used is NEUT prediction with biased background. . . 229
C.36 νµ CC-0π cross section in bins of true muon kinematics obtained using
NEUT prediction with biased background as fake data and NEUT as nominal. The result is compared with the nominal and fake data pre-diction. The error bars stand for the shape uncertainty while the red band are the fully correlated normalization uncertainty. The last bin, up to 30 GeV /c, is not displayed. . . 230
C.37 ν¯µ CC-0π cross section in bins of true muon kinematics obtained using
NEUT prediction with biased background as fake data and NEUT as nominal. The result is compared with the nominal and fake data pre-diction. The error bars stand for the shape uncertainty while the red band are the fully correlated normalization uncertainty. The last bin, up to 30 GeV /c, is not displayed. . . 231
as nominal. The result is compared with the nominal and fake data prediction. The error bars stand for the shape uncertainty while the red band are the fully correlated normalization uncertainty. The last bin, up to 30 GeV /c, is not displayed. . . 232
C.39 Difference of the cross sections in bins of true muon kinematics obtained
using NEUT prediction with biased background as fake data and NEUT as nominal. The result is compared with the nominal and fake data prediction. The error bars stand for the shape uncertainty while the red band are the fully correlated normalization uncertainty. The last bin, up to 30 GeV /c, is not displayed. . . 233
C.40 Asymmetry of the cross sections in bins of true muon kinematics
ob-tained using NEUT prediction with biased background as fake data and NEUT as nominal. The result is compared with the nominal and fake data prediction. The error bars stand for the shape uncertainty while the red band are the fully correlated normalization uncertainty. The last bin, up to 30 GeV /c, is not displayed. . . 234
I Summary table of the types of neutrino oscillation experiments with
their typical source-detector distance, energy and sensitivity to ∆m2. . . 15
II Results of the global 3ν oscillation analysis, in terms of best-fit values
for the mass-mixing parameters and associated nσ ranges (n = 1, 2, 3),
defined by χ2− χ2min = n
2
with respect to the separate minima in each mass ordering (NO, IO) and to the absolute minimum in any ordering.
Remind that ∆m2 is defined herein as m23− (m21+ m22)/2, and that δ is
taken in the (cyclic) interval δ/π ∈ [0, 2]. Table taken from [101]. . . 28
III Summary table of the models used in NEUT v5.3.2 and GENIE v2.8.0
to simulate the CC interactions. . . 45
IV List of the main design parameters of the MR accelerator for the proton
fast extraction at J-PARC. . . 53
V Neutrino-producing decay modes considered in T2K neutrino flux
pre-diction and their branching ratio in percentage. The same branching
ratios are obtained for antineutrino by conjugating the charge. The π−,
K− and µ− modes are charge conjugates of the π+, K+ and µ+ modes,
respectively. . . 59
VI Fraction (in %) of neutrino mode flux for each final hadron in the
inter-action chain. . . 59
VII Fraction (in %) of antineutrino mode flux for each final hadron in the
interaction chain. . . 60
VIII Flavour composition (in %) of ν and ¯ν beam. . . 60
IX T2K data-taking periods in antineutrino mode and the proton on target
used in this analysis for data and MC. . . 75
X Summary table of the selection criteria applied in the νµ analysis. . . 79
XI MC composition (in %) in term of particles type which contribute to
the selected νµ CC events with reconstructed vertex in FGD1 FV and
FGD2 FV. . . 80 XXV
FGD1 FV and FGD2 FV. . . 83
XIII MC composition (in %) in term of topologies for the νµ
CC-0π-like, CC-1π+-like and CC-Other-like samples obtained selecting CC
events with vertex in FGD1 FV and FGD2 FV. . . 89
XIV MC composition (in %) in term of reactions for the νµ CC-0π-like,
CC-1π+-like and CC-Other-like samples obtained selecting CC events
with vertex in FGD1 FV and FGD2 FV. . . 90
XV Summary of the systematic error source and the way they are propagated. 94
XVI Effect of 1σ variation of the systematic uncertainties on the predicted
event rates of the ν-mode samples. . . 96
XVII Effect of 1σ variation of the systematic uncertainties on the predicted
event rates of the ¯ν- mode samples. . . 97
XVIII T2K data-taking periods and collected POT used in the last published
oscillation analysis. . . 98
XIX Best-fit results and the 68% confidence interval of the T2K data fit
with the reactor constraint with normal and inverted hypotheses. Value taken from [176] . . . 98
XX T2K data-taking periods in ν-mode and the POT used in this analysis
for data and MC. . . 106
XXI T2K data-taking periods in ¯ν-mode and the POT used in this analysis
for data and MC. . . 107
XXII Summary of the selection criteria. . . 110
XXIII Binning used for the fit to the pµ, cos θµ distribution and for the
defini-tion of the data/MC correcdefini-tions ci. . . 117
XXIV Thickness and density of each component in each layer of the FGD1. . . 123
XXV Information used to compute the total number of nucleons for each
element of the FGD1 FV. . . 124
XXVI Binning used for the flux. . . 129
XXVII Binning used for the fit of the nuisance parameters correcting for the
detector systematics. . . 132
XXVIII Cross-section modelling parameters used in this analysis along with their type, prior, uncertainty and validity range. . . 137
XXIX Pion FSI parameters used in this analysis along with their type, prior,
uncertainty and validity range. . . 140
XXX Parameters of past (KamiokaNDE), running (SK), and future (HK)
wa-ter ˇCerenkov detectors. Table taken form [100]. . . 176
XXXI Summary table of the χ2 GOF computed using the total covariance
matrix (statistical and systematic uncertainties). . . 199
XXXII Summary table of the χ2 GOF computed using the total covariance
matrix (statistical plus systematic uncertainties). The fake data tested is NEUT with RFG+RPA as nuclear model and 2p2h increased by a factor of two. . . 205
is NEUT with the double of 2p2h events. . . 211
XXXIV Summary table of the χ2 GOF computed using the total covariance
matrix (statistical plus systematic uncertainties). The fake data tested is NEUT without 2p2h events. . . 211
XXXV Summary table of the χ2 GOF computed using the total covariance
matrix (statistical plus systematic uncertainties). . . 223
XXXVI Summary table of the χ2 GOF computed using the total covariance
matrix (statistical plus systematic uncertainties). . . 229
Neutrinos are one of the most abundant and elusive particles in the Universe. Ther ex-istence was postulated in 1930 by the physicist Wolfgang Pauli, that hypothesized the existence of a neutral and massless particle to explain the problem of energy going miss-ing in the beta decay. Their existence was definitely proved only in 1956, by C. Cowan and F. Reines with an experiment that used the beta decays produced by the Savannah River nuclear reactor in South Carolina. For this discovery Reines won the Nobel Prize in Physics in 1995. In 1959, the Italian physicist Bruno Pontecorvo suggested to investigate if the neutrino emitted together with a muon in pion decay is the same emitted with the electron in β-decay. In 1962 an experiment at the Alternating Gradient Synchrotron (AGS) at Brookhaven National Laboratory (BNL), led by L. M. Lederman, M. Schwartz and J. Steinberger, identified another distinct type: the muon neutrino. The last piece of the puzzle, the tau neutrino, was observed only in 2000 by the DONuT experiment at Fermilab. Before the discovery of the second neutrino family, Pontecorvo suggested the
possibility of having neutrino/antineutrino oscillations of the type ν ↔ ¯ν in analogy with
K0 − ¯K0 oscillations. After the discovery of the muon neutrino, Z. Maki, M. Nagakawa
and S. Sakata considered the possibility of having oscillations of neutrinos among the different types. Then, in 1967 Pontecorvo predicted the transition of electron neutrinos emitted by the Sun in muon neutrinos, before the first measurement of the deficit in solar electron neutrino flux by the Homestake experiment in 1968 headed by R. Davis, known as solar neutrino problem. In the second half of the 1980s measurements of atmospheric neutrinos flux showed a deficit, called the atmospheric neutrino anomaly. These contro-versial measurements have been commonly accepted only when Super-Kamiokande and SNO confirmed the oscillation hypothesis for atmospheric and solar neutrinos respectively. T. Kajita (Super-Kamiokande Collaboration) and A. B. McDonald (SNO Collaboration) have been awarded of the Nobel prize in Physics 2015 “for the discovery of neutrino os-cillations, which shows that neutrinos have mass”.
The neutrino oscillation physics is the background of this dissertation, which is di-vided in six chapters. The first three are essential to put in contest the work presented. In Chap. 1 are discussed the neutrino oscillation phenomenology and the experimental results, in Chap. 2 the neutrino scattering and in Chap. 3 the T2K experimental set-up.

![Figure 1.7. Schematic overview of the SNO experiment. Figure taken from [29].](https://thumb-eu.123doks.com/thumbv2/123doknet/12716125.356460/63.892.233.647.129.434/figure-schematic-overview-sno-experiment-figure-taken.webp)
![Figure 1.8. Schematic overview of the SK experiment. Figure taken from [29].](https://thumb-eu.123doks.com/thumbv2/123doknet/12716125.356460/64.892.225.671.141.445/figure-schematic-overview-sk-experiment-figure-taken.webp)