Voltage Stability Monitoring, Instability Detection and Control
Mevludin Glavic, Damir Novosel
Quanta Technology, Raleigh, North Carolina, USA May, 2011
Contents: 1. Introduction
1.1 Wide Area Voltage Stability Monitoring and Control: benefits and prospects 2. Description of Voltage Stability
2.1 Voltage stability basics 2.2 Voltage instability examples
3. Voltage Stability Monitoring and Instability Detection 3.1. Measurement data collection
3.2. Measurement data pre-processing and system modeling 3.3. Stability degree computation and instability detection 3.4. Control center implementation
4. Voltage Stability Control
4.1. Measures to prevent voltage instability 4.2. Preventive voltage instability control 4.3. Corrective voltage instability control 5. Future directions
1. Introduction
Voltage stability refers to the ability of a power system to maintain steady voltages at all buses in the system after being subjected to a disturbance from a given initial operating condition [1].
Principal causes of voltage instability are [1-5]: heavy load system operation conditions, long distances between generation and load, low source voltages, and insufficient reactive power compensation. The degree of a system voltage stability (the proximity to voltage instability) is strongly influenced by system conditions and its characteristics such as: generation system characteristics (in particular excitation systems), load characteristics, reactive power compensation devices characteristics, voltage control devices, presence of under load tap changing (ULTC) transformers , etc.[4].
Usually, in a voltage unstable situation, the voltage magnitudes in some system buses undergo, generally monotonic, decrease in the seconds or minutes following a disturbance. When pronounced, this decrease might endanger the system integrity mainly due to protecting devices that trip generation, transmission, or load equipment leading eventually to a blackout in the form of a voltage collapse [2], [3]. Voltage collapse is defined as the process by which the sequence of events accompanying voltage instability leads to a blackout or abnormally low voltages in a significant part of the power system [1].
Voltage instability is considered as a mayor treat for secure power system operation in many power systems throughout the world. Taking advantages of existing technological solutions, such as synchronized phasor measurements, powerful computational facilities, networking infrastructure and communications, in order to monitor stability conditions and control detected instability are of paramount importance. Wide area monitoring, protection, and control systems open perspectives for effective solution of this problem [6].
1.1 Wide Area Voltage Stability Monitoring and Control: benefits and prospects
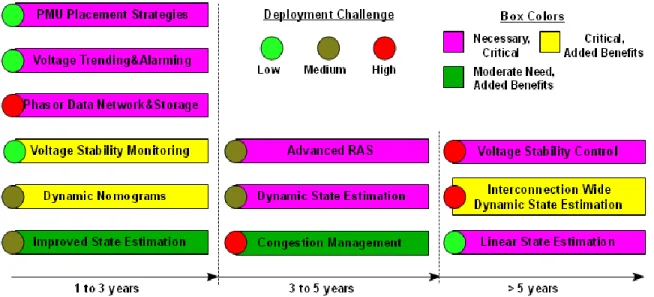
Figure 1. shows the roadmap for wide area voltage stability and control as well as related
synchrophasor applications according to the NASPI (North American SynchroPhasor Initiative) [7]. Figure 1. Roadmap for voltage stability and related synchrophasor applications [7]
terms of industry needs with added benefits application, and with deployment time frame of 1 to 3 years.
On the other hand, wide area voltage stability control is considered as high deployment challenge, necessary and critical application with deployment time frame bigger than 5 years.
Some other applications are directly related to wide area voltage stability monitoring and control and together with these applications would complete a comprehensive solution (phasro measurement units (PMU) placement, improved state estimation, linear state estimation, phasor data network and storage). Voltage trending and alarming and advanced RAS (Remedial Action Schemes) will complement, while dynamic nomograms and dynamic state estimations will further improve voltage stability and monitoring applications.
The main benefits of wide area voltage stability monitoring and control deployment are financial benefits connected to congestion management (more accurate computations of available margins for voltage stability limited corridors) and/or reducing the risk of catastrophic blackouts (thus reducing all societal and economic costs associated with system blackouts).
2. Description of Voltage Stability
Voltage instability essentially results from the inability of the combined transmission and generation system to deliver the power requested by loads [2] and is related to the maximum power that can be delivered by the transmission and generation system to the system loads.
2.1 Voltage stability basics
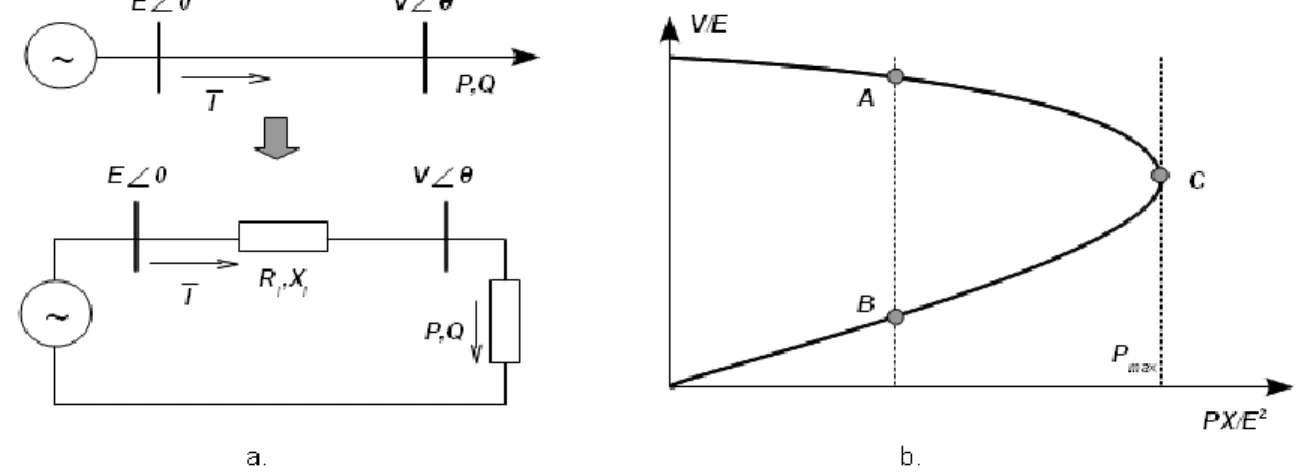
In order to establish power-voltage relationships and introduce the notion of maximum deliverable power, a simple two bus (generator-transmission line-load) system is considered (shown in Figure 2.a)
Figure 2. Simple two bus system (a) and power-voltage characteristics (b)
Assuming that the load behaves as an impedance with constant power factor ( ) and using basic circuit theory equations for this system, active power consumed by the load can be expressed as,
(1)
extremal conditions (maximum deliverable power) holds,
(2) or, maximum power that can be delivered to load is achieved when the load impedance is equal in magnitude to the transmission impedance [2,3,4].
If no assumption is made about the load (impedance behavior) the maximum deliverable power can be derived from power flow equations for simple two bus system. Active and reactive powers consumed by the load can be expressed as,
(3)
(4)
Based on these two equations, the following power-voltage relationships can be established,
(5)
Assuming again constant load power factor, increase in active load power, and expressing load voltage magnitude as a function of this power results in well-known PV curve illustrated in Figure 2.b. PV curve gives relationship between voltage magnitude and active power of combined generation and transmission system.
The system equilibrium is at the intersection of the PV curve and load characteristic. As illustrated in Figure 2.b for each load active power there are two operating points (A and B in Figure 2.b). Point A, characterized by high voltage magnitude and low current is normal operating point while point B, characterized by low voltage magnitude and high current for the same load power is generally not acceptable. Point C corresponds to the maximum deliverable power where two operating points coalesce. An attempt to operate the system beyond maximum deliverable power will generally result in voltage instability. This happens for two reasons:
due to smooth parameter (system load) changes, and
due to disturbances which decrease the maximum deliverable power.
This is illustrated in Figure 3. If the load is of constant power type, with the increase in load active power the system reaches maximum deliverable power (point C in Figure 3.a) and this point corresponds to the voltage instability point (often referred as critical point) [2,3,5]. Beyond the critical point the system equilibrium does not exist. In the same figure dashed PV curve corresponds to post-disturbance system conditions (without a generator overexctitation limit (OEL)) depicting a decrease in maximum deliverable power. Further decrease in the maximum deliverable power (at higher voltage magnitude) is experienced if a generator OEL is activated (dash-dotted line in Figure 3.a)
If the load is not of constant power type (Figure 3.b) the critical point does not coincide with the maximum deliverable power and the system can operate at a part of lower portion of PV curve. However, the system operation at the lower portion of PV curve is generally not acceptable since the
load would draw much higher current for the same power and for practical purposes voltage stability is associated with the maximum deliverable power.
Figure 3. Voltage instability mechanisms
2.1 Voltage instability examples
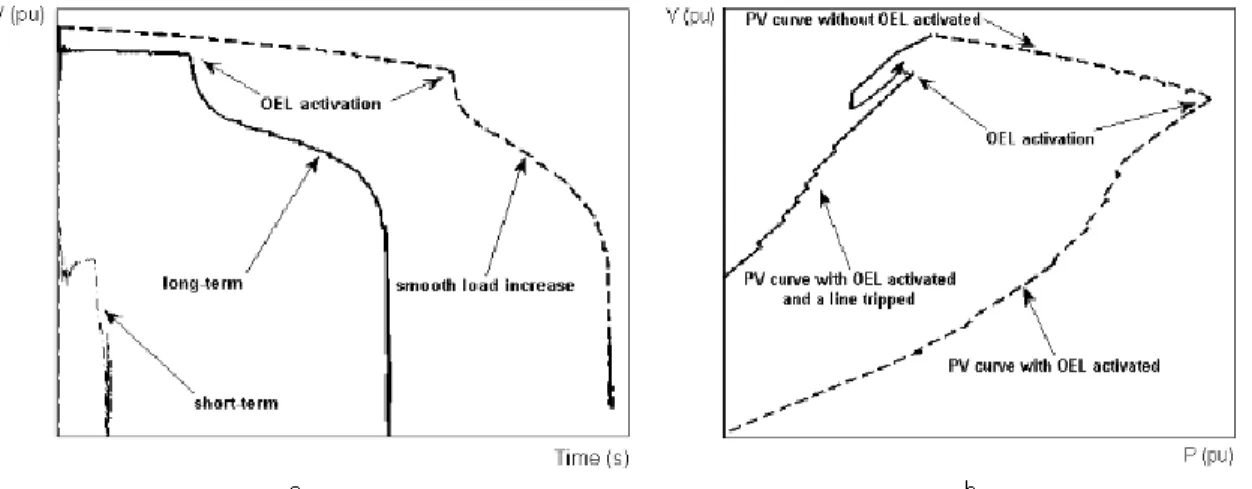
Depending on prevailing system conditions and its characteristics, voltage instability can manifest itself in different ways. While the voltage instability caused by a smooth load increase is intuitively clear and explained by PV curves, the instability caused by system disturbances can manifest itself in short-time or ling-time frame after disturbance. In short-term voltage instability, a voltage decrease caused by a disturbance initially decreases induction motors torque and the motors try to recover their torque in a time frame of typically one second time after the disturbance. On the other hand, the long-term voltage instability is associated with load recovery mechanisms and inability of local generators to produce sufficient reactive power. In long-term voltage instability, within a few minutes, ULTC transformers try to restore their secondary voltages after some intentional time delay (restore corresponding voltage-dependent load powers), while overexcitation limiters (OEL) restrict reactive power production from generators [2].
Figure 4. Typical voltage evolutions in voltage instability scenarios (a), corresponding PV curves (b) Typical voltage magnitude evolutions at a load bus when voltage instability and collapse take
place due to smooth load increase and line outage (both long-term instability examples) and a heavy fault (3-phase long duration short circuit causing short-term voltage instability) are give in Figure 4.a. PV curves that correspond to to two long-term instability cases are shown in Figure 4.b.
In two presented cases (smooth load increase and long-term instabilities) the final outcome of voltage collapse is loss of a local generator synchronism, while in case of short-term instability both motor stalling and loss of local generator synchronism taking place.
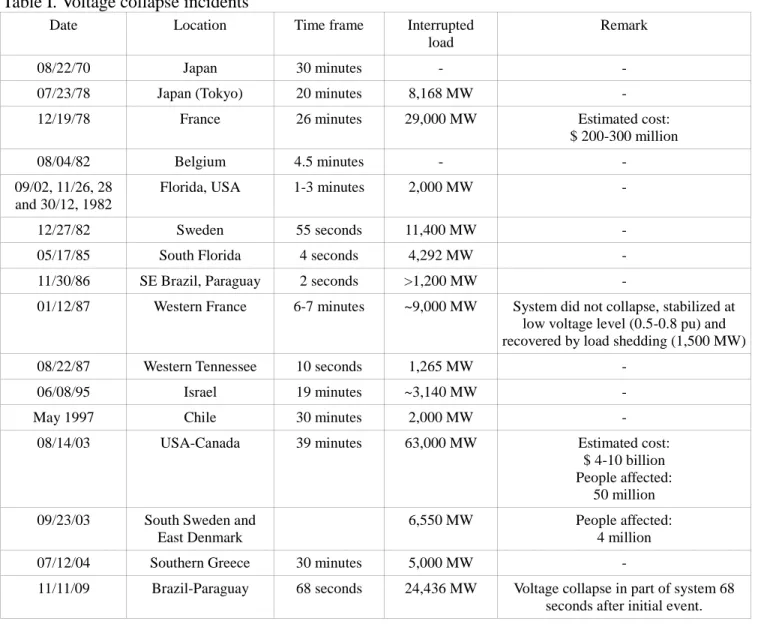
Voltage instability, resulting in voltage collapse, was reported as either main cause or being an important part of the problem in many partial or complete system disruptions. Some reported incidents are listed in Table I (together with time frames and total load interruption) [3,8-11].
Table I. Voltage collapse incidents
Date Location Time frame Interrupted load
Remark
08/22/70 Japan 30 minutes - -
07/23/78 Japan (Tokyo) 20 minutes 8,168 MW - 12/19/78 France 26 minutes 29,000 MW Estimated cost:
$ 200-300 million
08/04/82 Belgium 4.5 minutes - -
09/02, 11/26, 28 and 30/12, 1982
Florida, USA 1-3 minutes 2,000 MW -
12/27/82 Sweden 55 seconds 11,400 MW -
05/17/85 South Florida 4 seconds 4,292 MW -
11/30/86 SE Brazil, Paraguay 2 seconds >1,200 MW -
01/12/87 Western France 6-7 minutes ~9,000 MW System did not collapse, stabilized at low voltage level (0.5-0.8 pu) and recovered by load shedding (1,500 MW) 08/22/87 Western Tennessee 10 seconds 1,265 MW -
06/08/95 Israel 19 minutes ~3,140 MW -
May 1997 Chile 30 minutes 2,000 MW -
08/14/03 USA-Canada 39 minutes 63,000 MW Estimated cost: $ 4-10 billion People affected:
50 million 09/23/03 South Sweden and
East Denmark
6,550 MW People affected: 4 million 07/12/04 Southern Greece 30 minutes 5,000 MW -
11/11/09 Brazil-Paraguay 68 seconds 24,436 MW Voltage collapse in part of system 68 seconds after initial event.
3. Voltage Stability Monitoring and Instability Detection
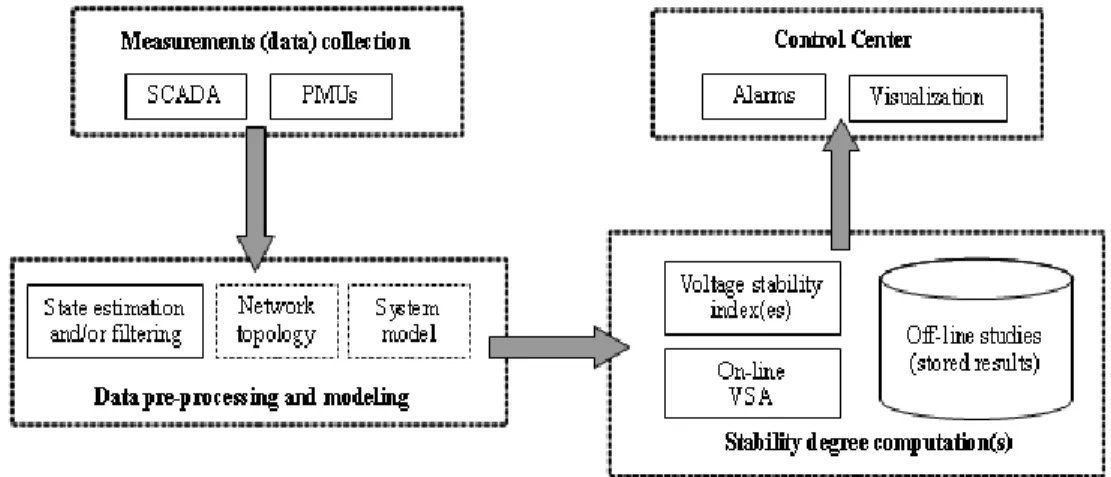
Voltage stability monitoring is a process of continuous computation of the system stability degree (the proximity to the voltage instability). Basic elements of a voltage stability monitoring system are illustrated in Figure 5.
Figure 5. Basic elements of voltage stability monitoring In principle, this process includes four elements:
Measurements (data) collection, Measurements (data) pre-processing, System stability degree computation, and
Results presentation to the system operator in control center.
3.1 Measurement (data) collection
The information on current system operation conditions is obtained through the measurements spread over the system. Supervisory Control And Data Acquisition (SCADA) system, advanced Phasor Measurement Unit (PMU) based, or a mix of the two measurements can be used to this purpose. Traditional SCADA systems gather system-wide data at a rate of 2-10 seconds and usually provide measurements such as voltage and current magnitudes, active and reactive injections and flows requiring further processing to obtain the system state information.
On the other hand, PMU is GPS time-synchronized instrument [6,12] that measures voltage and current phasors. When supported by a fast communication infrastructure, these devices gather system-wide data at much higher rate (30-60 samples/second) than traditional SCADA. PMUs are high-precision instruments, time-synchronized with the high-precision of less than 1μs and magnitude accuracy better than 0.1% (although the overall accuracy of the PMU data is limited by that of the current and potential transformers, transducers, etc.) ableto provide successive system state “snapshots” at a higher rate (generally, 5-10 samples/second are considered satisfactory for voltage stability monitoring) [6,12].
3.2 Measurement (data) pre-processing and system modeling
Measurements pre-processing is needed in order to account for inevitable errors in measurements as well as “noise” introduced in measurements by the system dynamics not directly linked to voltage instability (short-term dynamics, low frequency electromechanical oscillations, etc.) [12,14]. This processing consists essentially of measurements filtering although other pre-processings are possible such as: derivation of not directly measured quantities, transformation into the network reference frame if needed, etc. Moreover, in order to prevent possible false alarms data pre-processing should be able to recognize data drop-outs and false zero-voltages.
traditional SCADA, linear if PMUs are used only, or hybrid [12]). Although modern power systems are being more and more populated with PMUs they are still far from having such a rich PMU measurements configuration to permit full observability of the system. In these cases digital filtering of gathered measurements can be deployed. In this respect a simple moving average filtering shows practical potentials to be used due to its ability to filter out high-frequency components in input signal and at the same time preserve sharp changes some of which could indicate a sharp changes in the system stress [13].
Should the system modeling and network topology be included in the monitoring scheme depends on the way chosen to measure degree of voltage stability. If computation of chosen voltage stability index requires system model and network topology then they are to be included in the scheme and updated at adequate rate using gathered measurements. Static system models are considered satisfactory for voltage stability monitoring [3,4] while their details also depends on chosen voltage stability index as well as prevailing system conditions and characteristics.
3.3 Stability degree computation and instability detection
Voltage stability monitoring can be seen as monitoring of a properly chosen stability index. The voltage stability index has to be chosen so it reflects dominant phenomena linked to voltage instability in particular power system and at the same time to be simple and practical (based on physical quantities if possible). A wide variety of voltage stability indices have been proposed so far [2,3,13-23]. These indices serve as a measure of the proximity to the voltage instability (degree of system stability) by mapping current system state into a single (scalar) value. They are defined as a smooth, computationally inexpensive scalar with predictable shape that can be monitored as system operating conditions and parameters change [17].
In principle, any stability index could be used within voltage stability monitoring scheme but the following show the best promises to be used to this purpose:
Voltage magnitudes at critical locations (key load center and bulk transmission buses). This is the simplest approach and consists of monitoring voltage magnitudes at critical locations and their comparison with pre-determined thresholds. Voltage magnitude is not a good indicator of the security margin available at an operating point. On the other hand, when the system enters an emergency situation low voltage of the affected buses is the first indication of an approaching collapse [2,3]. Short-term (about one minute using PMUs) and long-term voltage trending plots [24] are low deployment challenge near-term applications of synchrophasor technology for voltage stability monitoring and detection.
Voltage stability indices derived from Thevenin impedance matching condition [14-20]. Essentially, these indices measure stability degree of individual load buses (or a transmission corridor) by monitoring, through local measurements, the equivalent Thevenin impedance of the system and equivalent impedance of local load (magnitude of these values are equal at the voltage instability point). Furthermore, stability degree can be expressed in terms of local voltage magnitude and voltage drop across the transmission path as well as in terms of power margin (MW or MVA). Computation of these indices does not require system model.
Loading margin of a operating point computed as the amount of load increase in a specific pattern that would cause voltage instability. This index is based on physical quantities (usually MW) and as such easy to interpret and practical. Load margin computation requires stem model (power flow model) and very computation is performed using: repetitive power flows, continuation power flows [25] specifying the load (at one load bus, region, or the system) as continuation parameter, or direct method [26] that solves equations describing the system model
at the critical point. Sensitivity of computed margin with respect to any system parameter and control is easy to compute [27]. However, the computational costs are considered as the main disadvantage of this index [20].
Singular values and Eigenvalues. The focus is on monitoring the smallest singular value or eigenvalue of the system Jacobian matrices (usually power flow Jacobian is satisfactory for this purpose). These values become zero at the voltage instability point. Computation of singular values and eigenvalues requires system model and is often associated with higher computational costs [2,4,19].
Sensitivity based voltage stability indices. These indices relate changes in some system quantities to the changes in others. Different sensitivity factors can be used to this purpose [2,5,13]. However, some studies suggest the sensitivities of the total reactive power generation to individual load reactive powers as the best choice since these sensitivities are directly related to the smallest eigenvalue of Jacobian matrix and are computationally inexpensive. Computation of these indices requires system model [2,19].
Reactive power reserves. Considerable decrease in reactive power reserves of system's key generators is a good indicator of system stress. Computation of reactive power reserves requires placement of measurement devices at several locations, does not require system model, and in principle cane make use of both SCADA and PMU-based measurements [21,22].
Singular Value Decomposition (SVD) applied to a measurement matrix. The focus is on computing and tracking the largest singular value of the matrix. Measurement matrix is constructed from PMU measurements such that each column is a stacked vector of the available PMU measurements over a time window (2 to 3 times the number of available PMUs) [23]. This matrix is updated as soon as new vector of measurements is acquired. Involved computations do not require system model [23].
Computation of chosen voltage stability index can be complemented with the stored results of off-line studies and observations. These results provide thresholds for chosen index. Another way to monitor voltage stability would be to use off-line observations (without computation of a voltage stability index) in order to build, periodically updated to account for changing system conditions, statistical model of the system and use it together with machine learning techniques such as decision trees, neural networks, and expert systems. The simplicity of decision trees (DTs) and easy interpretation of the decisions made, offer it as an attractive alternative for voltage stability monitoring [28]. DTs are automatically built off-line on the basis of learning set and a list of candidate attributes are further used in real-time to assess quickly any new operating state, in terms of the values of its test attributes. In principle, DTs do not require synchronized measurement. SCADA measurements are enough since time skew should not be critical. However, they certainly can take advantage of these advanced measurements [28].
Finally, an on-line voltage security assessment (VSA) tool can be used at the control center to measure the distance to voltage instability at any specific point in time. In this case, real-time measurements provide the base case and permit computation of the stability degree for base case and any postulated scenario. Commercially available VSA tools are still to be adapted in order to take advantages offered by PMUs [2,5,29,30].
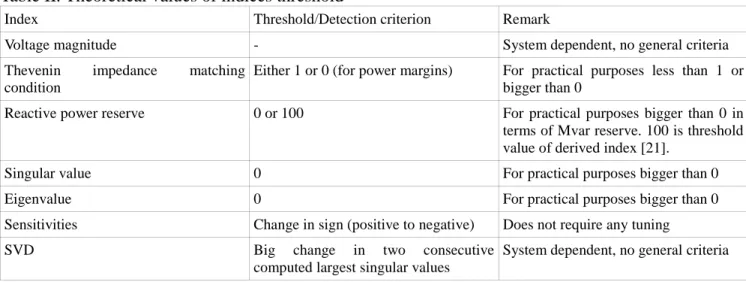
Voltage instability detection is usually based on simple comparison of computed values of chosen index with its pre-defined thresholds. These thresholds are usually set pessimistic with respect to the theoretical values in order to allow timely detection of developing instability. On the other hand, some indices do not require any threshold but rely on the change in sign (most of sensitivity based indices). Theoretical criteria for instability detection of above mentioned indices are listed in Table II.
Table II. Theoretical values of indices threshold
Index Threshold/Detection criterion Remark
Voltage magnitude - System dependent, no general criteria Thevenin impedance matching
condition
Either 1 or 0 (for power margins) For practical purposes less than 1 or bigger than 0
Reactive power reserve 0 or 100 For practical purposes bigger than 0 in terms of Mvar reserve. 100 is threshold value of derived index [21].
Singular value 0 For practical purposes bigger than 0
Eigenvalue 0 For practical purposes bigger than 0
Sensitivities Change in sign (positive to negative) Does not require any tuning
SVD Big change in two consecutive
computed largest singular values
System dependent, no general criteria
Voltage trending application is strongly related to the use of voltage magnitudes as voltage stability index and when properly tuned this application could provide an early detection of developing instability. In addition, this application could be complemented by the computation of the sensitivities of voltage to active and reactive load powers (model-free sensitivities) that could be also used to measure the system stress and detect approaching instability [24].
3.4 Control Center Implementation
The results of the system stability degree computation have to be presented to the system operators in control center. This presentation should be performed so the results are easy to interpret and intuitive. There are several options that could effectively serve this purpose :
off-line computation of nomograms and tracking current operating state within the nomograms, off-line computation, and possible periodic update, of voltage stability region and tracking the
system state within the boundaries of the region, PV or VQ curves,
visualization using geographical information systems (GIS) and/or one-line diagrams, etc.
Figure 6. shows two control center implementations of voltage stability monitoring displays: implemented within Real-Time Dynamic Monitoring System (RTDMS [31]) and ABB PSGuard wide monitoring systems [32].
Figure 6. Control center voltage stability conditions monitoring displays: RTDMS [31] (a) and ABB [32] (b)
4. Voltage Stability Control
Voltage stability control consists of designing and selecting measures in order to avoid voltage collapse and enhance system stability [2,3,33].
4.1 Measures to prevent voltage instability
Selection of measures is based on a proper choice of power system devices to be used. These devices are those having strong impact on a power system voltage stability conditions and include [2-5,33]:
series and shunt reactive power compensation devices (mechanically switched capacitors, static var compensators, shunt capacitor banks and reactors, series capacitors, synchronous condensers
generating units (excitation system control),
loads (shedding and reactive compensation of loads), ULTC transformers (load tap changer control), HVDC modulation.
Other measures can be taken in power system planning stage (well planned system experiences voltage collapse only after extreme disturbances) such as transmission system reinforcement and construction of generating stations near load centers, or system operational planning (commitment of out-of-merit units) and starting-up of gas turbines in real-time. In system planning stage or in system upgrade considerations a viable possibility is to determine the optimal mix and locations of static and dynamic reactive power resources by formulation of appropriate optimization problem [34,35] (e.g. mixed integer nonlinear programming [34]).
Design of measures specifies the way how they will be used in maintaining or enhancing voltage stability or system stabilization in case of developing instability (i.e. specifies the control scheme).
4.2 Preventive voltage instability control
This control consists in adjusting the operating point (normal operation) in order to prepare system to be able to face a predefined list of credible contingencies. Control actions are taken in predisturbance state (normal operating state), i.e. before the occurrence of any disturbance.
Traditionally, many power utilities relied or still rely on this controls. However, this type of controls are costly since applied in normal system state and impact economic operation of the system while postulated disturbances could never occur.
Design of these controls is based on the use of voltage security assessment (VSA) tools. These tools use different power system models and algorithmic solutions: repetitive power flows, continuation power flows [5,25], security-constrained optimal power flows [35], quasi static simulation [2,36], and full time domain simulations. The results of VSA are preventive controls such as generation rescheduling, keeping some generation units in operation for voltage support, setting of ULTC transformers tap positions, reactive power compensation devices switching, network switching (topology changes) and as a last resort load shedding.
This type of control is generally of open loop feed-forward type (no adjustments of the controls) and might offer a high complexity of possible control operations. On the other hand, advantages offered by preventive controls are possibility to coordinate among different control objectives and low cost of individual control actions (usually optimized).
However, it is not possible to protect a power system from any disturbance or it would be extremely expensive. It is expected that preventive controls are used only to protect the system against the most credible, or even most likely, contingencies (N-1 disturbances) while dependable and secure corrective controls are used to deal with more severe disturbances.
4.3 Corrective voltage instability control
This control aims at saving the system after an unexpected disturbance actually occurs and voltage instability is detected. In principle, corrective voltage stability controls are used to:
stop the load restoration mechanism. This is usually achieved by load tap changer control of ULTC transformers. The controls include: tap blocking, reversing, and setpoint reduction [33,37].
push the system to a new equilibrium. This is usually achieved by increasing the maximum deliverable power (shunt compensation switching, fast increase of generator voltages) or reducing the load consumption (decrease of tap changer setpoint or load shedding) [2,36,37,39,40].
Figure 7. illustrates the impact of shunt capacitor switching and load shedding. Solid PV curve, in Figure 7.a, corresponds to the post-disturbance unstable situation (no intersection between predisturbance load P0 and PV curve) while dashed represents post-disturbance PV curve with switched
shunt capacitor. Shunt capacitor switching increases maximum deliverable power and new equilibrium is achieved (point A).
Figure 7. Impact of different controls and delays in load shedding
On the other hand, by shedding load ΔP a new equilibrium is achieved on post-disturbance PV curve (without switched shunt capacitor) at point B. The minimum amount of load shedding is defined as
ΔPmin=P0-PC where PC is maximum deliverable power with respect to solid line PV curve.
In general, taking timely control actions can save the system with less control efforts. This is illustrated in Figure 7.b for the minimum load shedding. If the shedding is delayed after some critical value of delay the minimum amount of load shedding increases considerably. The value of critical delay is not easy to determine (depends on the severity of the situation) but for practical purposes the load shedding should be applied soon after the critical point is detected. In case of short-term instability (a severe disturbance considerably decreases maximum deliverable power) the system is already on the lower portion of a PV curve and the minimum load shedding amount rapidly increases with delay.
Corrective controls can be broadly classified into:
open loop control. This control uses actions assessed off-line based on simulations of postulated scenarios and does not re-adjust its actions to follow up the system evolution [33,36],
closed-loop control. This control assesses the disturbance severity through measurements and adjusts its actions correspondingly, follows the system evolution and repeats some actions if the previously taken ones are not enough. This allows compensating modeling inaccuracies and makes the control scheme more robust [33,41].
Emergency voltage stability control is a special type of corrective control designed to deal with extreme system conditions. This control can be of both nature, i.e. open loop and closed-loop. It usually includes, but is not limited to, undervoltage load shedding [33,36,38-41], emergency control of load tap changers (LTC), and controlled system separation in order to protect a strategic portion of the system. The dominant trend is to integrate emergency control in a System Integrity Protection Scheme (SIPS) [38].
LTC emergency controls include: blocking, reversing, and moving to a predefined position [33,37]. Usually, any of these LTC controls is not able to save the system but postpone system collapse thus giving some more time for other controls to stabilize the system. An advantage of LTC controls is when combined with other control types such as load shedding usually help decrease the amount of these controls.
detected [2,33,38-41]. Load shedding schemes can be implemented to rely on local data only, typically one or several bus voltages, possibly complemented by other signals [13] or on wide-area measurements. The latter load shedding schemes offer possibilities for adaptive control since based on the overall system stress measured by properly chosen index. This adaptiveness is based on the information extracted from detected critical point (for example sensitivities computed at the critical point for ranking buses participating in load shedding, voltage thresholds computed at the same point or participation factors determining participation of each system element in developing instability, etc.).
5. Future directions
New technological solutions such as synchronized measurements, fast communications, and powerful computational facilities, are available today but only gradually penetrate into real power systems. Deployment of these solutions in real power systems, likely in incremental fashion, is of paramount importance in order to achieve a comprehensive solution for wide-area voltage stability monitoring, detection, and control. New technological solutions will give real advantages only together with algorithmic developments working effectively in information rich environments. The expected increase in wind, solar, and other renewable generation will impact power system characteristics and the voltage stability monitoring and control algorithms have to properly tackle this issue.
Many existing voltage stability assessment techniques were not developed to take advantage of the new technological solutions an future investigations are needed for their adaptation to these new conditions [40,41]. Moreover, development of new algorithmic solutions is needed with the aim to effectively process available information and produce a synthetic indicator of a system voltage stability conditions. These new or upgraded existing algorithmic solutions should scale up well to the amount of information available (from limited to rich information environment) and being adaptive with respect to changing system conditions.
One promising direction is to use scientific computation techniques (parallel computing, distributed computing,etc.) in order to improve performances of existing VSA tools.
Another future direction efforts should be focus on the integration of emergency voltage stability controls in a SIPS. The concept of SIPS is to use local as well as selected remote sites and sending appropriate system information to a processing location to counteract propagation of the major disturbances in the power system [38]. A distinguishing feature of SIPS is it serves the overall power system or a strategic part of it in order to preserve system stability, maintain overall system connectivity, and/or to avoid serious equipment damage during major events [38]. Future efforts on voltage stability corrective controls as a part of SIPS should be focused on the design of response-based controls, acting in closed-loop and based on algorithmic decisions. These controls should also compromise between control actions taken locally and those taken centrally.
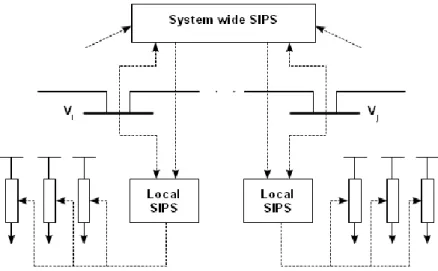
Figure 8. illustrates a hierarchical wide-area protection architecture for emergency voltage instability control based on load shedding integrated in the SIPS. Local SIPS collects measurements of the voltage of a key bus and acts on several loads based on the predefined voltage threshold (preferably amounts of load shedding should vary in magnitude and time [36,40,43]). System wide SIPS collects the measurements from all measured buses in the system and detects approaching instability based on wide system view. Once developing instability is detected system wide SIPS extracts all the information at the critical point and sends new thresholds to the local SIPS making overall protection adaptive with respect to the system state and disturbance. Local SIPS keeps predetermined thresholds as backup in case of communication failure from system wide SIPS.
A viable new development is the concept of multidimensional nomograms. The concept is based on hyperplane approximation of a power system security treats (including voltage stability). The main hypothesis of the concept is that nodal voltages expressed in rectangular components provide a more convenient coordinate system to measure system stability margin [44] (stability margin is
expressed as distance computed in the nodal voltages space).
Figure 8. A hierarchical wide-area protection architecture (load shedding)
References:
1. Kundur, P., Paserba, J., Ajjarapu, V., Andersson, G., Bose, A. Canizares, C., Hatziargyriou, N., Hill, D., Stankovic, A., Taylor, C., Van Cutsem, T. and Vittal, V. 2004. Definition and
Classification of Power System Stability. IEEE Transactions on Power Systems, 19(2): 1387-1401.
2. Van Cutsem, T. and Vournas,C. 1998. Voltage Stability of Electric Power Systems, Boston: Kluwer Academic Publisher.
3. Taylor, C. W. 1993. Power System Voltage Stability, EPRI Power System Engineering Series: McGraw-Hill.
4. Kundur, P. 1994. Power System Stability and Control, EPRI Power System Engineering Series: McGraw-Hill.
5. Ajjarapu, V. 2006. Computational Techniques for Voltage Stability Assessment and Control. New York: Springer.
6. Novosel, D., Madani, V., Bhargava, B., Vu, K. and Cole, J. 2008. Dawn of Grid
Synchronization: Benefits, Practical Applications, and Deployment Strategies for Wide Area Monitoring, Protection, and Control. IEEE Power and Energy Magazine 6(1), pp. 49-60, 2008. 7. Beard, L. and Chow, J. 2010. NASPI RITT Report Out. NASPI, available online:
http://www.naspi.org/meetings/workgroup/2010_october/presentations/taskteams/taskteam_rep ort_ritt_beard_20101006.pdf, Oct. 2010.
8. Hain, Y. and Schweitzer, I. 1997. Analysis of the Power Blackout on June 8, 1995, in the Israel Electric Corporation. IEEE Transactions on Power Systems, 12(4): 1752-1758.
9. Vournas, C. D., Nikolaidis, V. C. and Tassoulis, A. A. 2006. Postmortem Analysis and Data Validation in the Wake of the 2004 Athens Blackout. IEEE Transactions on Power Systems 21(3): 1331-1339.
10. Vargas, L. D., Quintana, V. H. and Miranda, R. D. 1999. Voltage Collapse Scenario in the Chilean Interconnected System. IEEE Trans. Power Syst., 14(4): 1415-1421.
11. Filho, J. M. O. 2010. Brazilian Blacakout 2009: Blackout Watch. avalibale oline:
http://www.pacw.org/fileadmin/doc/MarchIssue2010/Brazilian_Blackout_march_2010.pdf 12. Phadke, A. G. and Thorp, J. S. 2008. Synchronized Phasor Measurements and Their
13. Glavic, M. and Van Cutsem, T. 2009. Wide-Area Detection of Voltage Instability From
Synchronized Phasor Measurements. Part I: Principle IEEE Transactions on Power Systems 24( 3): 1408-1416.
14. Vu, K., Begovic, M. M., Novosel, D. and Saha, M. M. 1999. Use of local measurements to estimate voltage stability margin. IEEE Transactions on Power Systems 14(3): 1029–1035. 15. Corsi, S. and Taranto, G. N. 2008. A real-time voltage instability identification algorithm based
on local phasor measurements. IEEE Transactions on Power Systems 23(3):1271–1279. 16. Larsson, M., Rehtanz, C. and Bertsch, J. 2003. Real-Time Voltage Stability Assessment of
Transmission Corridors. Proc. IFAC Symposium on Power Plants and Power Systems, Seoul, S. Korea.
17. Parniani, M., Chow, J. H., Vanfretti, L., Bhargava, B. and Salazar, A. 2006. Voltage Stability Analysis of a Multiple-Infeed Load Center Using Phasor Measurement Data. Proc. 2006 IEEE
Power System Conference and Exposition, Atlanta, GA.
18. Milosevic, B. and Begovic, M. 2003. Voltage Stability Protection and Control using a Wide-Area Network of Phasor Measurements. IEEE Transactions Power Systems 18(1): 121-127. 19. Gao, B. , Morison, G. K. and Kundur, P. 1993. Voltage stability evaluation using modal analysis.
IEEE Transactions on Power Systems 8(3): 1159–1171.
20. Canizares, C. (Editor/Coordinator). 2002. Voltage Stability Assessment: Concepts, Practices
and Tools, IEEE PES Publication, Power System Stability Subcommittee, ISBN 0780379695.
21. Taylor, C. W. and Ramanathan, R. 1998. BPA Reactive Power Monitoring and Control Following the August 10, 1996 Power Failure. Proc. VI SEPOPE, Salvador, Brazil.
22. Bao, L., Huang, Z. and Xu, W. 2003. Online Voltage Stability Monitoring Using Var Reserves.
IEEE Transactions on Power Systems 18(4): 1461-1469.
23. Overbye, T., Sauer, P., DeMarco, C., Lesieutre, B. and Venkatasubramanian,M. 2010. Using
PMU Data to Increase Situational Awareness, PSERC Report 10-16.
24. NASPI Report. 2010. Real-Time Application of Synchrophasors for Improving Reliability. Available online: www.naspi.org/rapir_final_draft_20101017.pdf
25. Ajjarapu V., and Christy,C. 1992. The continuation power ow: A tool for steady state voltage stability analysis. IEEE Transasctions on Power Systems 7(1): pp. 416-423.
26. Canizares, C. A., Alvarado, F. L., DeMarco, C. L., Dobson, I. And Long, W. F. 1992. Point of collapse methods applied to ac/dc power systems. IEEE Transactions on Power Systems 7(2): 673-683.
27. Greene, S. Dobson, I., and Alvarado, F. L. 1997. Sensitivity of the loading margin to voltage collapse with respect to arbitrary parameters. IEEE Transactions on Power Systems 12(1): 262-272.
28. Diao, R., Sun, K., Vittal, V., O'Keefe, R. J., Richardson, M. R., Bhatt, N., Stradford, D., Sarawgi, S. K. 2009. Decision Tree-Based Online Voltage Security Assessment Using PMU Measurements. IEEE Transactions on Power Systems 24( 2): 832-839.
29. Van Cutsem, T. 1993. An approach to corrective control of voltage instability using simulation and sensitivity. IEEE Transactions on Power Systems 7(4): 1529–1542.
30. Ajjarapu, V. and Sakis Meliopoulos, A. P. 2008. Preventing Voltage Collapse with Protection
Systems that Incorporate Optimal Reactive Power Control. PSERC Report 08-20.
31. CERTS. 2006. Nomogram Validation Application for CAISO Utilizing Phasor Technology – Functional Specification. CERTS publication prepared for California Energy Commission. 32. ABB Ltd. 2003. Voltage Stability Monitoring: A PSGuard Wide Area Monitoring System
Application. ABB Switzerland Ltd., available online: http://www.abb.com/poweroutage. 33. Van Cutsem, T. and Vournas, C. D. 2007. Emergency Voltage Stability Controls: An Overview.
Proc. IEEE PES General Meeting, Tampa, FL.
Static and Dynamic VAR Resources, PSERC Report 08-06.
35. Song, H., Lee, B., Kwon, S-H., and Ajjarapu, V. 2003. Reactive Reserve-Based Contingency Constrained Optimal Power Flow (RCCOPF) for Enhancement of Voltage Stability Margins.
IEEE Transactions on Power Systems 18(4): 1538-1546.
36. Moors, C. 2003. On the Design of Load Shedding Schemes Against Voltage Instability in Electric Power System. PhD Thesis, University of Liege, Belgium.
37. Vournas, C., and Karystianos, M. 2004. Load Tap Changers in Emergency and Preventive Voltage Stability Control. IEEE Transactions on Power Systems 19(1): 492-498.
38. Begovic, M., Madani, V. and Novosel, D. 2007. System Integrity Protection Schemes (SIPS).
Proc. Bulk Power System Dynamics and Control-VII, Paper 089, Charleston, SC.
39. Taylor, C. W. 1992. Concepts of Undervoltage Load Shedding for Voltage Stability. IEEE
Transactions on Power Delivery 7(2): 480-488.
40. Otomega, B., Glavic, M. and Van Cutsem, T. 2007. Distributed Undervoltage Load Shedding.
IEEE Transactions on Power Systems 22(4): 2283-2284.
41. Glavic, M. and Van Cutsem, T. 2010. Adaptive Wide-Area Closed-Loop Undervoltage Load Shedding Using Synchronized Measurements. Proc. 2010 IEEE PES General Meeting,
Minneapolis, MN.
42. Novosel, D., Begovic, M. and Madani, V. 2004. Shedding Light on Blackouts. IEEE Power and
Energy Magazine 2(1): 32-43.
43. Otomega, B., Glavic, M. and Van Cutsem, T. 2007. A Purely Distributed Implementation of Undervoltage Load Shedding. Proc. IEEE PES General Meeting, Tampa, FL.
44. Parashar, M., Zhou, W., Trudnowski, D., Makarov, Y., Dobson, I.2008. Phasor Technology Applications: Feasibility Assessment and Research Results Report. Available online: certs.lbl.gov/pdf/phasor-feasibility-2008.pdf.
![Figure 6. Control center voltage stability conditions monitoring displays: RTDMS [31] (a) and ABB [32] (b)](https://thumb-eu.123doks.com/thumbv2/123doknet/5489323.130604/11.918.115.810.104.363/figure-control-center-voltage-stability-conditions-monitoring-displays.webp)