CLINICAL AND FUNCTIONAL CHARACTERISTICS
OF NONAGENARIANS HOSPITALIZED IN A GERIATRIC UNIT:
A DESCRIPTIVE STUDY
J. Petermans
1, S. Mathieu
1, S. Allepaerts
1, S. Gillain
1, J. Pincemail
2, A. Samalea Suarez
3, L. Seidel
4,
J.O. Defraigne
2, D. Gillain
5Introduction
The nonagenarian population will be the fastest growing amongst the older over the next 30 years. Intuitively, the geriatric clinician notes that it is, both physically and cognitively, a “stronger” population (1). Chronological age can certainly not be considered as a strong marker because the heterogeneity of the phenotypes in the old person must be noted.
Frailty is often linked to advanced age and is
1. Geriatrics department CHU Liège, Domaine universitaire du Sartilman 4020 Liège Belgium; 2. Experimental research center of the surgical department (CREDEC) CHU Liège, Domaine universitaire du Sartilman 4020 Liège Belgium; 3. Clinical pharmacy CHU Liège, Domaine universitaire du Sartilman 4020 Liège Belgique; 4. Biostatistics department Public Heath school, Domaine universitaire du Sartilman 4020 Liège Belgium; 5. Medical and economic informations department (SIME) CHU Liège, Domaine universitaire du Sartilman 4020 Liège Belgium
Corresponding Author: J. Petermans, Geriatrics department CHU Liège, Domaine
universitaire du Sartilman 4020 Liège Belgium
303
Abstract: Introduction: The nonagenarian population will increase in the next 30 years. Physically and cognitively, they look "more
robust". We purposed to look for characteristics which make them different from elderly of lower age when hospitalized in GU.
Material and methods: 61 nonagenarians (mean age: 92.4) and 60 old over 75 years (mean age: 81.9) hospitalized in GU were studied.
Each of the patients underwent, in addition to the medical history and the usual clinical examination a geriatric assessment. This evaluation included Katz's and Lawton's indices which were completed based on the functional state prior to hospitalization outside any acute phenomenon, a walking test and the hand-grip test. The Montreal Cognitive Assessment was used to assess the cognitive condition. These evaluations were all performed at the end of hospitalization. The nutritional condition was also verified with the short MNA test. The water swallow test according to Di Pipo was also performed to detect any risk of aspiration. Each group was followed by a telephone call, 3, 6 and 12 months after discharge. Death, condition of living, evolution of the illness, weight, falls and rate of hospitalization were performed. The two groups were compared by the Mann-Withney non-parametric tests, for continuous variables, and chi-square for categorical variables. Results were significant at p<0.05. Results: Nonagenarians had the same ADL scores as octogenarians but their IADL scores were higher (P=0.040). They had lower power at the handgrip test (P=0.035), tended to have worse walking test (P=0.10) and took fewer medications (P=0.0017).No significant differences are observed in the other assessment. The length of hospital stay does not differ. The median for the two groups is 15 days. The death rate at the hospital is also the same. (6 nonagenarians and 4 persons under 90 years). Concerning the number of persons contacted after the discharge, there is only a significant difference at 12 months between the 2 groups (p=0.035). After 3 months 10 nonagenarians are dead against 6 for the octogenarians (p=ns), 3 months after discharge, 40.0% of the octogenarians are living at home, with help for only 14.8% of the nonagenarians (p=0.013). After 6 and 12 months there are no statistical differences in the situation of living between the 2 groups. No difference is observed between the 2 groups according the evolution of the illness of the weight and of the incidence of falls but the rate of hospitalization is particularly low in the 2 populations; from 21.6% after 3 months to 19.2% after 6 months in the octogenarians and from 14% after 3 months to 0% after 12 months in the nonagenarians (p = 0,017). Conclusion: This study shows that nonagenarians admitted to GU have albeit the same functional pattern than octogenarians but take fewer medications. Despite the fact that their walking speed is lower (< than 0.6m/sec) is associated with a risk of greater functional and/or cognitive decline their outcomes don’t differs very significantly from the younger’s even if they are more in nursing home during the 6 months after discharge. No difference in this topic is observed after one year. With 10 years older their functional profile look as well efficient as octogenarians.
Key words: Nonagenarians, geriatric assessment, walking speed, functional profile, geriatric unit.
interpreted as a reduction in the homeostasis and resistance when confronted with stress that increases the vulnerability and the risk of adverse effects and the progression of a disease, It could well represent a complex interaction between various biological psychological, cognitive and social factors (2)
Winograd has also described seven criteria of frailty: presence of cognitive problems, poly-medication, falls, malnutrition, incontinence, deafness/blindness and socio-economic difficulties (3). The latter were used in the context of this work. They are more closely related to medical conditions and easier to detect in the clinical approach.
Frailty can be considered as a state into a dynamic process accompanying aging and diseases (4-6).
The standardized geriatric assessment (7) allowed for classifying the profile of these patients and has demonstrated its level of evidence (Ia) in the care and the future of these aging persons, even if there is no real agreement on the screening tools to prevent adverse outcomes (8)
The objective of this clinical study was to verify whether the population of nonagenarians hospitalized in geriatrics differs, clinically and in its functional profile, from the older population hospitalized in geriatric units.
Materials and Method
We recruited 121 patients, aged 75 years and older, hospitalized in the geriatrics unit at the CHU of Liège. (Belgium)
To be included in the study, the patients had to have been admitted into geriatrics through the emergency services. A total of 60 patients in the 75 to 90-year age group (group A or octogenarian group) were included in a random way and 61 patients in the 90 years or older age group (group B or nonagenarian group) were included consecutively between December 2010 and September 2011.The randomization was realized to avoid too much “hivernal pathologies and to try to have the same type of
disease in each population. Our study was approved by the ethics comity of the
university hospital-medical department in Liège. An informed consent form was signed by the patients or one of their legal representatives.
Each of the patients underwent a clinical evaluation that, in addition to the medical history and the usual clinical examination, was supplemented by observation of the functional condition using the standardized geriatric assessment. This evaluation included in particular Katz's and Lawton's indices (9, 10) the walk test (11) and the hand-grip test (12).
The Montreal Cognitive Assessment (MoCA©) test (13) was used to test the cognitive condition. These evaluations were all performed at the end of hospitalization to approach as closely as possible the
values of the functional status of the patient outside their time of stress. The Katz and the Lawton indices were completed based on the functional state prior to hospitalization outside any acute phenomenon.
The nutritional condition was also verified with the short MNA (Mini Nutritional Assessment) test (14) and biological measures. We also performed the water swallow test according to Di Pipo (15) to detect any risk of aspiration.
We used the “Cumulative Illness Rating Scale” (CIRS) for collecting and looking at the co-morbidities and antecedents adds (16)
We also performed a history of the patients' medications and looked for the number of inappropriate prescriptions using a list of medications created pursuant to the Beers and the Laroche criteria, adapted to the pharmacopoeia available in Belgium (17, 18).
In both group, a functional assessment was performed by telephone 3, 6 and 12 months after discharge from the hospital. The items checked were place of living, evolution of the disease, re admission in hospital, evolution of the weight, falls, delirium and change in the medications.
Statistical analyses
It was carried out by the department of biostatistics at the University of Liège.
We performed a separate sampling for recruiting our subjects.
The variables studied have been described using means and standard deviations for the continuous variables. Categorized variables are expressed as sample size and frequencies and continuous variables by means and standard deviation
The statistical tests used for continuous variables are Mann-Withney non-parametric tests. The chi-squared test was employed for categorized variables.
The results were tested with a degree of uncertainty of 5% (p<0.05). SAS® software (SAS Institute, Cary, NC, USA, version 9.2) was used statistical calculations.
Results
Our population is made up of mostly women (58.3% in the octogenarians group and 65.6%amongst the nonagenarians). The average age is 81.9 in group A and 92.4 in group B.
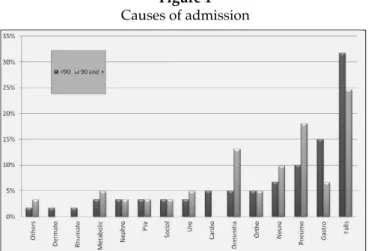
In 30% of the 121 hospital stays, the most common reason for admission into our two geriatrics units was a traumatic injury and the cause of injury was an unintentional fall (see figure 1). Amongst nonagenarians, dementia and confusion are more often listed as reasons for admission. However, these differences are not statistically significant (p=0.59).
Figure 1
Causes of admission
As regards the socio-economic data (see Table 1), the number of widowed individuals is higher amongst the nonagenarians (78.7%) by comparison of the octogenarians (55%). In group A, 33.3% are still living at home without help and 16.7% are in an institution (nursing home or long term care unit). In group B, by contrast, only 11.7% of them live at home without help and 24.6% live in institutions. In this group, 21.3% are living with a member of their family (compared to 8.3% for group A).
In terms of the frailty factors described by Winograd (3), group B of nonagenarians tends to have less frailty (3.7 for group B compared to 4.2 for group A). An analysis by criteria underlines the significant differences between the 2 groups (see Table 2).
Indeed, nonagenarians do not use as wide a variety of medications and are less often victims of socio-economic problems. However, in this same group, there are many more subjects who are deaf and/or blind.
The main results from the functional analysis performed during the study are taken up in table 3. In
terms of the ADL (Katz's index), the results in the two groups are comparable, with a mean of 13.2 in group A and 15.2 in group B. By contrast, according to the IADL (Lawton's index), the nonagenarians achieve higher scores with a mean of 26.1 compared with 22.8 amongst the younger individuals with a p=0.040.
Di Pipo's water swallow test demonstrates similar rates of aspiration in each of the groups.
In table 4, with respect to the biometrical data, patients over 90 are significantly smaller (a mean of 159 cm compared to 163 cm in group A). The mean weight in group A is 64.8 kg compared to 61.1 kg in group B. BMI is about 24 Kg/m² for the two groups (24.3 and 23.9 in groups A and B respectively).
The table 5 gives the results of frailty assessment. Nutritionally, in the two groups, the short-MNA falls around 9. As for daily consumption of fruit and vegetables, only 75 subjects responded but the responses given were often imprecise. On average, in the two groups, the subjects consumed between two and three portions of fruit and vegetables a day.
There was only one smoker amongst the 45 nonagenarians who responded, compared with six smokers amongst the 38 younger subjects who responded.
The nonagenarians had on average poorer outcomes during the performance of the MoCA Test (mean of 17.4 for group B, 20 for group A). But this trend is at the limit of statistical meaning (p=0.049).
In the walking assessment, nonagenarians in general scored lower with in particular a tendency to walk more slowly. During the Timed Get Up and Go (TUG)test, the nonagenarians were slightly less successful, but, for both groups, the results are widely above normal values which lie between 10 and 13 seconds in these slices of ages (19, 20). As regards muscle strength, measured by the hand-grip test, the results were poor for patients in group B.
Table 1
Socio-demographics conditions
<90 years old ≥90 years old
Variable Categories N Number (%) N Number (%) p-value
Sex 60 61 N.S.
Female 35 (58.3) 40 (65.6)
Male 25 (41.7) 21 (34.4)
Marital Status 60 61 0.008
Married or Living common law 20 (33.3) 7 (11.5) Widowed 33 (55.0) 48 (78.7) Divorced / Separated / Single 7 (11.7) 6 (9.8)
Type of labor 57 60 N.S.
Manual 43 (75.4) 46 (76.7) Intellectual 14 (24.6) 14 (23.3)
Living conditions 60 61 0.013
At home without help 20 (33.3) 7 (11,5) At home with help 25 (41.7) 26 (42,6) With family 5 (8.3) 13 (21.3) Nursing home 10 (16.7) 15 (24.6)
Table 3
Functional assessment
<90 years old ≥90 years old
Variable N Mean (SD) N Mean (SD) p-value
ADL (Katz index) 60 13.2 (5.8) 61 15.2 (7.1) N.S. IADL (Lawton index) 60 22.8 (8.6) 61 26.1 (8.1) 0.040
Table 4
Biometrical, physiological and nutritional parameters
<90 years old ≥90 years old
Variable N Mean (SD) N Mean (SD) p-value
Weight (Kg) 58 64.8 (14.3) 58 61.1 (15.2) N.S. Height (cm) 59 163 (9.5) 61 159 (8.0) 0.01 BMI (Kg/m²) 57 24.3 (4.8) 58 23.9 (5.4) NS Systolic blood pressure (mmHg) 59 133.9 (16.1) 59 132.3 (14.2) N.S. Diastolic blood 59 69.5 (9.5) 59 69.8 (11.7) N.S. pressure (mmHg)
By contrast, between the groups, there was no difference in the incidence of falls and their frequency during the year prior to hospitalization. Approximately 77% of the patients in group A fell at least once. In group B, 65% of the subjects fell. In the two groups, a little more than half of the patients who fall did so on several occasions.
Regarding the history of the patients' medications, there is a difference in favour of the nonagenarians who take significantly less medication than their younger
counterparts (p=0.0013). Indeed, a nonagenarian takes on average 6.5 kinds of medication, while the under-90s take on average 8.7 kinds of medication a day. Furthermore, subjects who are 90 years or older have far fewer inappropriate prescriptions (0.7 in group B versus 1.1 in group A with p=0.016).
As regards the assessment of co-morbidities, measured using the CIRS, we observe that the nonagenarians tend to have fewer medical antecedents and underlying medical conditions. Nonagenarians have less severe underlying pathology, 2.7 versus 3.6 (score 3 or 4 on the CIRS).
Only 6.7% of nonagenarians had already been hospitalized in the three months preceding their hospitalization, while this rate reached 33.3% amongst the patients younger than 90. This difference is highly significant (p=0.0003).
The length of hospital stay does not differ. The median for the two groups is 15 days. The death rate is also the same. Indeed, five nonagenarians and four people under 90 years died during their hospitalization.
During the hospitalization 6 patients of the group B are deceased for 4 in the octogenarians (p ns).
Concerning the situation after the discharge, the figure 2 shows the rate of follow up of all the patients at 3, 6 and 12 months. There is only a significant difference at 12 months between the two groups (p=0,035).
After 3 months 10 nonagenarians are dead against 6 for the octogenarians (p ns)
In the table 5, we can see that 3 months after discharge 40.0% of the octogenarians are living at home, with help
Table 2
Frailty according Winograd
<90 years old ≥90 years old
Variable Categories N Number (%) N Number (%) p-value
Winograd, Cognitive dysfunction 60 60 0.52 No 13 (21.7) 16 (26.7) Yes 47 (78.3) 44 (73.3)
Winograd, Falls 60 61 0.13
No 14 (23.3) 22 (36.1) Yes 46 (76.7) 39 (63.9) Winograd, Poly medication 60 61 0.026
No 15 (25.0) 27 (44.3) Yes 45 (75.0) 34 (55.7) Winograd, Malnutrition 60 61 0.38 No 40 (66.7) 36 (59.0) Yes 20 (33.3) 25 (41.0) Winograd, Incontinence 60 61 0.78 No 33 (55.0) 32 (52.5) Yes 27 (45.0) 29 (47.5)
Winograd, Deafness and blindness 59 61 0.045 No 30 (50.8) 20 (32.8)
Yes 29 (49.2) 41 (67.2) Winograd, Socio-economical problems 60 61 <.0001
No 22 (36.7) 47 (77.0) Yes 38 (63.3) 14 (23.0)
for only 14.8% of the nonagenarians (p=0,013). After 6 and 12 months there are no statistical differences in the situation of living between the 2 groups.
Figure 2
Rate of follow up of the patients at 3, 6 and 12 months
No difference is observed between the 2 groups according the evolution of illness, of the weight and of the incidence of falls but the rate of hospitalization is particularly low in the 2 populations; from 21.6% after 3 months to 19.2% after 12 months in the octogenarians and from 14% after 3 months to 0% after 12 months in the nonagenarians (p = 0,017).
Table 5
Frailty assessment
<90 years old ≥90 years old
Variable N Mean (SD) N Mean (SD) p-value
MNA 58 8.9 (3.0) 58 9.5 (3.3) N.S. MoCA 43 19.98 (5.0) 31 17.39 (5.3) 0.049 Timed Up & Go 37 28.0 (23.1) 28 35.0 (20.7) 0.033 (seconds) Hand grip 53 16.7 (7.6) 47 13.6 (7.2) 0.035 Medications 60 8.6 (3.5) 61 6.5 (3.7) 0.001 (number) Inappropriate 60 1.05 (0.98) 61 0.67 (0.70) 0.044 medications (number) CIRS 59 15.6 (5.4) 59 13.7 (4.7) 0.044 CIRS-3&4 59 3.56 (2.17) 59 2.69 (1.88) 0.020
Discussion
This study shows that nonagenarians hospitalized for an acute problem do have a clinical profile different from the group of younger subjects (octogenarians). We can consider that this population is representative of the patients admitted in the geriatric wards in Belgium. Indeed, the health program for geriatric patient applied in all the general hospital define the type of patients who have to be taking care in the geriatric department (21)
A Canadian study (22) demonstrated that every year old persons see their functional condition deteriorate by 12%. In our study, the two populations achieved similar scores on the Katz index at the level of the functional status. This means that, despite a decade more, nonagenarians maintain more or less the same degree of autonomy for their ADL. By contrast, with respect to instrumental activities, measured on the Lawton index, they do not perform as well. It would be interesting to make a longitudinal follow-up of the functional status of patients from the octogenarian group to see if the future nonagenarians have weaker ADL and IADL scores than at inclusion.
According to the Winograd frailty parameters, nonagenarians have a tendency to have fewer criteria than the younger subjects. This difference emerges essentially in poly-medication, nonagenarians are much less poly-medicated (6.5 compared to 8.6 medications per day) and take fewer medications that are considered inappropriate. Similarly, less than 10% of the nonagenarians were hospitalized in the months preceding their hospitalization.
By contrast, the constants of walking and muscular strength of the upper limbs, currently parameters known for being the clinical frailty markers (11, 12), the results for nonagenarians demonstrates increased frailty with a mean walking speed estimated at 0.4m/s (compared to 0.6 for the younger). Thus, it has been demonstrated that a walking speed of less than 0.6m/s is associated with a greater risk of functional and/or cognitive decline and with higher rates of institutionalization and of death (23, 24).
This difference in results between the two groups can be explained in many ways. We believe that Winograd's frailty criteria are anamnestic parameters and they are thus less influenced by an acute pathology. By contrast, the results obtained in the walking and hand-grip tests are influenced to a greater extent. Even if these measurements were taken at the end of hospitalization, it is possible that nonagenarians recover their strength and walking ability more slowly than younger subjects after an acute event.
Therefore, when performing the walking tests, account should be taken of the difficulty in realizing the test, the patient having to integrate different instructions. This is sometimes more complicated to perform for a geriatric
population, in particular in cases of deafness or loss of visual acuity, as well as executive changes (25) the question is therefore to discover whether the poorer performances of the nonagenarians studied are linked to a poorer understanding of the instructions. Moreover, the walking and the hand-grip tests could only be performed by half the patients studied, essentially because of orthopaedic problems or because of advanced dementia.
Finally, physiological ageing and inflamm-ageing could explain the reduction in the walking speed and the lack of grip, in particular because of the aggravation of the sarcopenia. Indeed, a Danish study (26) carried out in 1998 on over 2000 nonagenarians demonstrated results similar to ours with a speed of a weak walk (only 10% reached of nonagenarians have a walking speed of 1m/sec, with a mean speed of 0.65 amongst men and 0.52 meters amongst women). Similarly, when performing the hand-grip test, the values were lower than expected (27, 28). These results (walking speed and hand grip) correlated poorly with the results of the ADL, indicating perhaps that the grip strength and the walking speed measures functional capacities other than ADL values.
Concerning the follow up, despite the difficulty to contact the person and the relative value of a telephone enquiry (29), we check the fact that there is a difference in the place of living between the 2 groups after 3 months but not after one year. Even, if there is quite the same progression in the illness between the 2 groups, the rate of hospitalization is lower in the nonagenarians group. We have no explanation but perhaps it could be linked with the whish of very old persons to avoid hospitalization as much as possible.
We note the lack of literature according this problem. Hansen (30) shows that after discharge, the practitioners discovered newly developed problems in 49% of the visits while adjustment of medication proved necessary at 52% of the visits. The majority of problems were found among the oldest patients aged 85 years and over who had been hospitalized for more than seven days. This was not confirmed in our study.
In a paper published in 2004, Carol J (31) demonstrates that 65 and older represent more than 45% of the number of day of care, have a longer stay but the author don’t give information on the outcome after discharge and don’t have a look especially in the very old persons. So, the results of our study look original by the data obtained in this average of age.
.
Conclusion
Nonagenarians hospitalized in the geriatrics unit at the CHU in Liège are generally subjects moderately dependent and this despite an older age. They take far less medication than octogenarians and have a slow walking speed and a weaker grip strength than the younger subjects. Despite these facts their outcomes don’t differs very significantly from the younger’s even if they are more in nursing home during the 6 months after discharge. No difference in this topic is observed after one year.
With 10 years older their functional profile looks as well efficient as octogenarians.
Table 6
Follow up at 3, 6 and 12 months (%)
<90 years old ≥90 years old
Variable Categories N Number (%) N Number (%) p-value
3 months 6 months 12 months
Variable <90 years old ≥90 years old <90 years old ≥90 years old <90 years old ≥90 years old
Living conditions p-value = 0.013 p-value = N.S. p-value = N.S.
At home without help 10.0 11.5 6.7 9.8 6.7 6.6 At home with help 40.0 14.8 28.3 13.1 13.3 3.3 With family 5.0 4.9 1.7 1.6 0.0 0.0 Nursing home 33.3 39.3 25.0 32.8 23.3 19.7 Lost of follow-up 11.7 29.5 38.3 42.6 56.7 70.5
Weight change p-value = N.S. p-value = N.S. p-value = N.S.
Stable 54.2 55.8 48.6 57.1 50.0 72.2 Loss 33.3 38.5 27.0 28.6 26.9 16.7 Gain 12.5 4.7 24.3 14.3 23.1 11.1
Evolution of illness p-value = N.S. p-value = N.S. p-value = N.S.
Recovery 47.3 58.2 54.2 38.6 57.9 59.3 Stable 30.9 29.1 33.3 47.7 28.9 33.3 Worsening 21.8 12.7 12.5 13.6 13.2 7.4
Readmission p-value = N.S. p-value = N.S. p-value = 0.017
21.6 14.0 18.4 11.4 19.2 0.0
Falls p-value = N.S. p-value = N.S. p-value = N.S.
References
1. Campbell AJ, Borrie MJ, Spears GF et al. Circumstances and consequences of falls experienced by a community population 70 years and over during a prospective study. Age Ageing. 1990, 19(2), 136-41.
2. Bergman H, Hogan D, Karunananthan S. La fragilité in Arcand M – Hébert R, ed Précis pratique de gériatrie 3ème édition. Edisem inc, Québec, 2008, 83-91. 3. Winograd C, Gerety M, Chung M et al. Screening for frailty : criteria and
predictors of outcomes. JAGS, 1991, 39, 778-78.
4. Lang PO, Michel JP, Zekry D. Frailty syndrome: a transitional state in a dynamic process. Gerontology. 2009, 55, 539-49.
5. R. J. J. Gobbens, K. G. Luijkx, M. T. Wijnen-Sponselee, J. M. G. A. Schols Towards an integral conceptual model of frailty J Nutr Health Aging. 2010 Mar;14(3):175-81
6. Petermans J Pathological ageing: a myth or reality? Rev Med Liege. 2012 May-Jun;67(5-6):341-8
7. Graham E, Martin A, David R et al. Comprehensive geriatric assessment for older adults admitted to hospital: meta-analysis of randomised controlled trials. BMJ, 2011, 343:d6553.
8. M. De Saint-Hubert, D. Schoevaerdts, P. Cornette, W. D’Hoore, B. Boland, C. Swine Predicting functional adverse outcomes in hospitalized older patients: A systematic review of screening tools. J Nutr Health Aging. 2010 May;14(5):394-9.
9. Katz S, Ford AB, et al Studies illness in the aged. The index of the ADL: a standardized measure of biological and psychosocial function. JAMA1963;185:914-919
10. Lawton M., Brody E.M. Assessment of older people : self-maintaining and instrumental activities of daily living. Gerontologist 1969 ; 9 : 179-186. 11. Bohannon, R. W. (1997). "Comfortable and maximum walking speed of
adults aged 20-79 years: reference values and determinants." Age Ageing 26(1): 15-19.
12. Hamilton G F., McDonald C., Chenier T C , Measurement of Grip Strength: Validity and Reliability of the Sphygmomanometer and Jamar Grip Dynamometer JOSPT Volume 16 Number 5 November 1992.
13. S Hoops, BA, S Nazem, BA, A D. Siderowf, MD, J E. Duda, MD, S X. Xie, PhD, M B. Stern, MD, and D Weintraub, MD Validity of the MoCA and MMSE in the detection of MCI and dementia in Parkinson disease Neurology. 2009 November 24; 73(21): 1738–1745
14. Rubenstein LZ, Harker JO, Salva A, Guigoz Y, Vellas B. Screening for Undernutrition in Geriatric Practice: Developing the Short-Fom Mini Nutritional Assessment (MNA-SF). J. Geront 2001; 56A: M366-377
15. DePippo KL, Holas MA, Reding MJ Validation of the 3-oz water swallow test for aspiration following stroke. Arch Neurol. 1992 Dec; 49(12):1259-61. 16. Miller, M. Paradis, C. Houck, P., Mazumdar, S., Stack, J., Rifai, H., Mulsant,
B., & Reynolds, C Rating chronic medical illness burden in geropsychiatric practice and research: Application of the Cumulative Illness Rating Scale.
Psychiatry Research, 1992 41(3), 237-248.
17. Laroche ML, Bouthier F, Merle L et al. Médicaments potentiellement inappropriés aux personnes âgées : intérêt d’une liste adaptée à la pratique médicale française. La revue de Médecine interne, 2009, 30, 592-601. 18. Donna M. Fick, James W. Cooper, William E. Wade et al. - Updating the
Beers Criteria for Potentially Inappropriate Medication Use in Older Adults. Results of a US Consensus Panel of Experts. Arch Intern Med, 2003, 163, 2716-2724.
19. Podsiadlo, D., Richardson, S. The timed ‘Up and Go’ Test: a Test of Basic Functional Mobility for Frail Elderly Persons. Journal of American Geriatric Society. 1991; 39:142- §yèt8
20. Bohannon RW. Reference values for the Timed Up and Go Test: A Descriptive Meta-Analysis. Journal of Geriatric Physical Therapy, 2006;29(2):64-8.
21. Le programme de soins pour le patient gériatrique Arrêté royal paru au moniteur belge le 7 mars 2007
22. Hébert R, Brayne C, Spiegelhalter D. Incidence of functional decline and improvement in a community-dwelling, very elderly population. Am J Epidemiol. 1997,145(10),935-44.
23. Houles M , Abellan van Kan G, Rolland Y et al. La vitesse de marche comme critère de fragilité chez la personne âgée vivant au domicile. Un groupe de travail de l’International Academy on Nutrition and Aging (IANA). Les cahiers de l'année gérontologique, 2010, 2, 13-23.
24. Rothman MD, Leo-Summers L, Gill TM. Prognostic significance of potential frailty criteria. J Am Geriatr Soc 2008;56:2211-6.
25. Gillain S, Warzee E, Lekeu F, Wojtasik V, Maquet D, Croisier JL, Salmon E, Petermans J. The value of instrumental gait analysis in elderly healthy, MCI or Alzheimer's disease subjects and a comparison with other clinical tests used in single and dual-task conditions. Ann Phys Rehabil Med. 2009 Jul;52(6):453-74
26. Nybo H, Gaist D, Jeune B et al. Functional status and self-rated health in 2,262 nonagenarians: the Danish 1905 Cohort Survey. J Am Geriatr Soc., 2001, 49(5),601-9.
27. Desrosiers J, Bravo G, Hebert R, and Dutil E. Normative data for grip strength of elderly men and women. The American Journal of Occupational Therapy. 1995;49(7):637-44.
28. Ling CH, Taekema D, Craen AJ, Gussekloo J, Westendorp RG, Maier AB. Handgrip strength and mortality in the oldest old population: the Leiden 85-plus study. CMAJ. 2010;182:429–35.
29. Groves R. et Kahn R. (1979) Surveys by Telephone : a National Comparison with Personal Interviews, New York, Academic.
30. Hansen FR, Ziebell A, Spedtsberg K, Schroll M Follow-up of elderly patients in their homes by general practitioners after discharge from hospital] Ugeskr Laeger. 1991 Jul 22; 155 (30):2128-31.
31. DeFrances CJ, Hall MJ. 2002 National Hospital Discharge Survey. Adv Data. 2004;342:1–29.