HAL Id: hal-03138319
https://hal.archives-ouvertes.fr/hal-03138319
Submitted on 11 Feb 2021
HAL is a multi-disciplinary open access
archive for the deposit and dissemination of
sci-entific research documents, whether they are
pub-lished or not. The documents may come from
teaching and research institutions in France or
abroad, or from public or private research centers.
L’archive ouverte pluridisciplinaire HAL, est
destinée au dépôt et à la diffusion de documents
scientifiques de niveau recherche, publiés ou non,
émanant des établissements d’enseignement et de
recherche français ou étrangers, des laboratoires
publics ou privés.
Distributed under a Creative Commons Attribution - NonCommercial - NoDerivatives| 4.0
International License
A framework for user assistance on predictive models
Gabriel Ferrettini, Julien Aligon, Chantal Soulé-Dupuy, William Raynaut
To cite this version:
Gabriel Ferrettini, Julien Aligon, Chantal Soulé-Dupuy, William Raynaut. A framework for user
assistance on predictive models. Joint Conference of the Information Retrieval Communities in Europe
(CIRCLE 2020), Jul 2020, Samatan, Gers, France. pp.32. �hal-03138319�
A framework for user assistance on predictive models
Gabriel Ferrettini
Julien Aligon
Chantal Soulé-Dupuy
Université de Toulouse, UT1, IRIT, (CNRS/UMR 5505) Toulouse, France
William Raynaut
[email protected] Hubware Toulouse, FranceABSTRACT
Data analysis generally requires very specialized skills, especially when applying machine learning tasks. The ambition of the paper is to propose a framework assisting a domain expert user to analyse his data, in a context of predictive analysis. In particular, the frame-work includes a recommender system for the frame-workflow of analysis tasks. Because the lack of explanation in recommendations can lead to loss of confidence, a complementary system is proposed to better understand the predictive models recommended. This complemen-tary system aims to help the user to understand and exploit the results of the data analysis, by relying on his data expertise. The framework is validated through a pool of questions and a mock-up showing the interest of the approach.
KEYWORDS
Recommendation system, Machine Learning, Predictive model, Pre-diction explanation
1
INTRODUCTION
In many cases, data analysis requires very specialized skills in the implementation and use of models. For instance, designing something as common and popular as a predictive model requires expert knowledge in the machine learning field. Thus, these analysis tasks are especially difficult to perform for a domain expert user, i.e. having a deep knowledge of the data to analyze, but without any background in machine learning. Several past works have been proposed to help these types of users, notably thanks to workflow recommender systems and model building assistance (as proposed in [20]). In general, these recommender systems offer very accurate analysis workflows and predictive models (drawing strength from workflows performed by past users). But the interaction with these systems is often limited to execute the predictive model proposed, without an easy way to validate and personalize it. This is a major drawback by which a user can lose confidence, due to a lack of explanations in the recommender system results. Indeed, neophyte users tend to struggle giving credence to a system they do not understand and are not familiar with. Given the fact that important decisions can be made using such a system, giving the user an opportunity to have confidence in the system is important. For example, the importance of transparency has been recognized for a long time in expert systems, as in [4], and studied more widely in the recommendation context in [28].
"Copyright © 2020 for this paper by its authors. Use permitted under Creative Com-mons License Attribution 4.0 International (CC BY 4.0)."
In this direction, the ambition of this paper is to propose a frame-work assisting domain expert users in performing sensible data anal-ysis by himself (more precisely our work is focused on the task of multi-label classification). This framework includes a recommender system of workflows for predictive models and a complementary system explaining these results. The aim of this explanation sys-tem is to make the model transparent and effective, while giving confidence to the user. His involvement in all the stages of this framework should increase his confidence, while relying as little as possible on any other knowledge than his domain of expertise. Thus, the framework should allow a user to better select, personal-ize and understand the recommended predictive models. In order to achieve this, we explore novel ways of exploiting single predic-tion explanapredic-tion. These new uses aim to help a non expert user to appropriate complex data analysis processes.
The paper is organized as follows. Section 2 details the limits of the current systems helping a user to analyze and classify his data. A review of existing solutions to better explain predictive models is also presented. Section 3 proposes a recommender system to be part of our framework and taking into account the drawbacks identified in the literature. Section 4 describes the explanation sys-tem for predictive models. Based on these two syssys-tems, Section 5 presents the organisation of the framework and how a user can easily select and fit the desired predictive model through the use of the explanation system. The framework is validated in Section 6 thanks to a use case and illustrated by a mock-up. In particular, this validation shows the framework is able to answer the following three questions:
• How a non expert user can appropriate the results of the recommendation by himself?
• How users can be confident in the produced results? • How a model can be personalised without requiring machine
learning knowledge?
2
RELATED WORKS
2.1
From the need of model recommendation...
Recommender systems based on collaborative filtering are known to be effective in various applications. For example, [3] suggests queries based on previous issues queries, applied in the general context of databases, while [14] recommends items based on user data obtained from a social network, and [2] provides sequences of queries based on similarities between OLAP user sessions.
Traditional collaborative filtering approaches however base their recommendations on similarities between users, identifying intrin-sic traits they have in common. Such systems rarely consider the context in which the user evolves.
Context-aware recommender systems should then be preferred when the context of the user is complex and more prominent [1]. In this case, the information obtained from multiple contexts can be very useful to improve the relevance and effectiveness of the recommender systems. Such approaches have attracted a particular attention over the last few years. For example, [16] shows that detecting user emotion (context) and factoring it into a collabora-tive filtering approach increased user satisfaction. [31] proposes a system suggesting collaborations between universities and indus-tries based on the identification of similar contexts of researchers (defined on a multitude of aspects). [33] develops a similarity-based context-aware approach under the assumption that recommenda-tions should be similar if the contextual situarecommenda-tions of the users are similar. They demonstrated that integrating a similarity measure between multidimensional contexts could improve precision scores. The problem of data analysis workflow recommendation has re-cently received an increased interest, advertising several promising methods [19, 23, 27, 32]. Their purpose is to assist user in solving a range of different data analysis problems by the recommendation of adequate workflows (defined as sequences of operators producing knowledge from data). However, none of these works arise from a perspective of context-aware recommendation, taking into account the particular context in which a data-analyst evolves. They only take into consideration the information related to their purpose, such as the objective of the analysis for planification methods [19]. We plan to consider more of the relevant information constitut-ing the user’s context. Indeed, a dataset to analyse has multiple features and is defined by particular characteristics, while the ac-tual needs of a data-analyst can be complex and largely implicit. Experiments performed in the past can also be considered part of this context, as they carry information toward what was and can be done. Yet, even with a finer approach to the recommendation, the user is still not able to understand and use fully what is being recommended.
As discussed in the introduction, the need for better explana-tions and confidences in the recommendation results is essential for a user, furthermore for a domain expert. To overcome this black box problem in the recommendations, several solutions exist in the literature, whose a review can be found in [28]. In particular, a number of goals characterizing the different types of explanations in recommender systems is proposed, and how to evaluate them. In particular, the notions of Transparency (i.e. how the system works as in [9]), Trust (i.e. perceived confidence with the recommendations as in [7]), Persuasiveness (i.e. user acceptance with the recommen-dations as in [9]) and Effectiveness (i.e. make better decisions as in [24]) seem to fit at the best the objectives of recommendation explanations proposed in our framework.
2.2
...to the need of model explanation
The existing systems and toolkits for machine learning (ML) and data analysis in general mostly focus on providing and explaining the methods and algorithms. This approach has proven particularly helpful for expert users, but still requires advanced knowledge of data analysis. Indeed, some of the most well-known data analysis platforms such as Weka [13] or Knime [5] provide detailed descrip-tions of the methods and algorithms they include, often giving
usage examples. Unfortunately, detailed descriptions are a poor substitute to an actual training in data analysis.
Some data analysis platforms, such as RapidMiner [15], Orange [11], for instance, have dedicated a great attention to the problem of presenting and explaining the analysis results to the user. By providing well-designed visualization interfaces, these platforms assist the user in understanding the results produced, which is a first step toward actually using them and acting on them. however, they cannot explain how these specific results have been achieved, which remains a significant disincentive for users in areas where wrong decisions can have grave consequences. Helping those users to grasp why a particular prediction is being made (in a way that would allow them to check this reasoning against their own ex-pert knowledge) could greatly enhance their trust in a reasonable prediction, or on the contrary give them a meaningful reason to discard a biased one. This is the original intuition behind the need for prediction explanations.
More recently Google with its "what if" tool, mainly based on [30], proposes many exploratory machine learning tools. Those help a user to understand and exploit machine learning models in an intuitive way. This is mainly done by allowing the user to explore new data points with a trained model, and displaying different metrics in an easily interpretable way.
Our approach is to make machine learning more interpretable by relying on explanation of the predictions provided by predictive models. The possible applications of prediction explanations have been investigated by [22]. According to their paper, the interest for explaining a predictive model is threefold:
• First, it can be seen as a mean to understand how a model works in general, by peering at how it behaves in diverse points of the instance space.
• Second, it can help a non expert user to judge of the quality of a prediction and even pinpoint the cause of flaws in its classification. Correcting them would then lead the user to perform some intuitive feature engineering operations. • Third, it can allow the user to decide the type of model
preferable to another one, even if he has no knowledge of the principles underlying each of them.
A great number of works pertaining to prediction explanation led to [18], which theorized a category of explanation methods, named additive methods, and produced an interesting review of the differ-ent methods developed in this category. Some of these methods are described in detail in [10] and [26]. They are summarized in [18] as methods attributing for a given prediction, a weight to each at-tribute of the dataset. This creates a very simple "predictive model", mimicking the original model behavior locally. Thus, we have a simple interpretable linear model which gives information on the original model inner working in a small vicinity of the predicted instance. The methods from which these weights are attributed to each attribute varies between the different additive methods, but the end result is always this vector of weights.
Other lines of reasoning have been explored, such as in [6], which investigated prediction explanation from the point of view of model performance. Meaning that their metric shows which feature improves the performance of the model, rather than which
feature the model consider as important for its prediction. If this line of reasoning is really interesting for the model explanation field, it does not correspond to our scope as well as other methods, as we are aiming to help users understand how a model works, and not how to improve it. In this paper, we aim to facilitate the understanding of any machine learning model for users with no special knowledge of data analysis or machine learning. Thus, it is more relevant to focus on additive methods, as they generate a simple set of importance weights for each attribute. This set of weights is easy to interpret, even for someone without expertise on machine learning.
3
WORKFLOW RECOMMENDATION SYSTEM
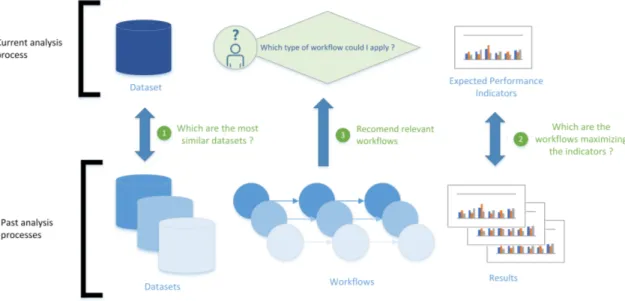
In this section is described the basic principles of our workflow recommender system, as depicted in Figure 1. This section takes part of a previous work, described in more details in [21] and [20]. This recommender system has been showed to be an effective assistant for relevant workflow selection, through the experiments in [20]. This system is the base of the framework presented in Section 5.
3.1
Process overview and definitions
3.1.1 Dataset. Datasets are defined as a collection of instances described along attributes. Given 𝐴 = 𝑎1, ..., 𝑎𝑛, the attributes of a dataset, an instance 𝑥 is a vector of 𝑛 attributes values: the descrip-tion of 𝑥 along the attribute set 𝐴.
3.1.2 Workflow. Workflows in their most general form usually consist in directed graphs of data analysis operators [23]. These can include the many possible steps of data analysis, such as various preprocessing (data cleaning, normalization, etc.), construction of models, search for patterns, or even parameter optimization for other operators. Note that, as explanation methods (see Section 4) are applied to supervised classification, for now we only consider workflows arising from such models.
3.1.3 System overview. The recommendation system is based on a meta-database of past machine-learning experiments. For each of them, one can access the base dataset of the experiment, the workflow used to create a machine learning model (from the dataset) and its performance.
In section 3.2 (step 1 of Figure 1), the method to determine how datasets are similar is presented. Then, in section 3.3 (step 2 of Figure 1), we present how the performance of a workflow is mod-eled according to the current user’s needs. These user preferences filter the set of recommendations to propose relevant workflows described in the last section 3.4 (step 3 of Figure 1).
3.2
Dissimilarity between datasets
The measure of dissimilarity is based on the characteristics of the datasets to be compared. This dissimilarity is computed through two levels of attributes: the difference between each dataset meta-attribute and the difference between each meta-attribute meta-meta-attribute. 3.2.1 Dataset meta-attributes. In order to dispose of a large selec-tion of meta-attributes from diverse categories, we use the OpenML
platform [29]. This platform contains more than a hundred meta-attributes, from different statistical, information-theoretic, and land-marking approaches (complete list available on http://www.openml. org/).
3.2.2 Attribute meta-attributes. Individual attributes of datasets can be characterized along a set of measures, mostly consisting in non-aggregated versions of the previously described Dataset meta-attributes. To build our set of attribute meta-attributes, we use the 72 measures proposed in [21], able to characterize individuals attributes. The key idea is to compare attributes of different datasets along their attributes meta-attributes. However, as the intuition is to make use of all available information, attributes are compared by most similar pairs: For two datasets 𝐴 and 𝐵, each attribute of 𝐴is paired with an attribute of 𝐵 such as the total dissimilarity of each pairs is as low as possible.
3.3
Workflow filtering by user preference
In order to make the recommendations more accurate, the perfor-mance of a workflow is filtered according to the current user’s needs. For instance, if a current user has a very high cost of false negatives (like the early diagnosis of a dangerous disease), then we should consider relevant workflows that exhibited good recall on similar datasets. Our approach is then to consider criteria able to characterize different aspects of workflow performance to model user preferences. Even considering only problems of supervised classification, many different criteria have been proposed to char-acterize different aspects of performance, like Cohen’s Kappa [8], measuring agreement while accounting for the chance of random good guesses, or the more complex Information Score from [17], measuring the amount of non-trivial information produced by the model.
Then, the preference model of a user is represented as a set of performance criteria he is interested in (each of them associated to a weight qualifying its relative importance). For instance, a user who wants to avoid false negatives has recall measure as its most important criterion. But it does not mean that precision has to be ignored. A higher weight associated to recall represents the user preference.
3.4
Workflow recommendation by pareto front
Considering a current user, analysing a dataset and having defined his preferences, the system recommends workflows from past analy-sis. This implies to access to a base of past data analysis experiments, where (hopefully expert) users upload the analysis they perform. One such past analysis then consists in a dataset, upon which was applied a workflow, yielding a result.
The suggested workflow for the current analysis should then be determined according to two criteria:
(1) The past analysis must have been produced on a dataset similar to the one of the current user.
(2) Its results, evaluated according to the preferences expressed by the current user, should be satisfactory.
We thus face a problem of multi-criteria optimisation, where both dataset similarity and past performance matter. To solve it, a pareto recommendation approach is proposed.
Figure 1: Global steps of the recommendation process
Figure 2: Pareto front of the best past analysis according to our two criteria
Consider the full Pareto front of past analysis as a set of rec-ommendations. We can then consider our best possible candidates according to our two criteria (as shown in Figure 2), which increases the chances of finding one that suits the user, but requires an addi-tional step to discriminate between candidates. Indeed, supplying the full set of recommendation would probably be useful to expert users, but is most likely to overwhelm a non-expert.
4
PREDICTIVE MODEL EXPLANATION
SYSTEM
As introduced in Section 1 and developed in Section 2, the lack of understanding of prediction recommendations is a real problem encountered by most domain experts users. It leads to a lack of trusts in the models, and impairs its use. Moreover, even through a guidance, a lack of experience can lead to mistakes when analysing a dataset and considering not so well adapted predictions. In or-der to address those pitfalls, we aim to help the user unor-derstand the recommendation results. For this, we propose an explanation system mainly based on the domain user knowledge.
4.1
Explaining prediction results
Most of the methods of the literature are mainly devoted to explain a predictive model in a global way. These methods are not relevant when domain expert user (for instance a biologist) has to study the behavior of particular dataset instances over a predictive model (for instance in the context of cohort study). This is our main motivation to propose an explanation system able to understand the behavior of individual predictions. In particular, this method is detailed in [12] and the main principles are described below.
Underlying principle. Our prediction explanation system relies on the principle of analysing the influence of each attribute on the model prediction. This way, we aim to emphasize the most important attributes according to the model. The explanation of the model is realized by comparing the impact of the absence and presence of the attributes to determine their influence. However, considering that each attribute is independent of the others presents a limit. Therefore, in order to take into account this dependency between attributes, it is necessary to consider the influence of attribute groups on prediction. These influences are then aggregated in a unique score by using Shapley’s individuals participation in group efforts, described in [25].
4.2
Explanation of a single attribut influence
Given a dataset of instances described along the attributes of 𝐴, the influence of the attribute 𝑎𝑖on the classification of an instance
𝑥 by the classifier confidence function 𝑓 on the class 𝐶 can be represented as:
𝑖𝑛 𝑓𝐶
𝑓 ,𝑎𝑖(𝑥 ) = 𝑓 (𝑥
𝑎𝑖) − 𝑓 (∅) (1)
Where 𝑓 (𝑥𝑎𝑖) represents the probability that the instance 𝑥 is
included in the class 𝐶 with only the knowledge of the attribute 𝑎𝑖 (according to the predictive model). This formula can be used
with groups of attributes, which leads us to an influence inspired by Shapley’s work: I𝐶 𝑎𝑖(𝑥 ) = ∑︁ 𝐴′⊆𝐴\𝑎𝑖 𝑝(𝐴′, 𝐴) ∗ (𝑖𝑛𝑓𝐶 𝑓 ,(𝐴′∪𝑎 𝑖) (𝑥 ) − 𝑖𝑛𝑓𝐶 𝑓 ,𝐴′(𝑥 )) (2)
With 𝑝 (𝐴′, 𝐴) the Shapley’s value, a penalty function accounting for the size of the subset 𝐴′.
𝑝(𝐴′, 𝐴) =
|𝐴′|! ∗ (|𝐴| − |𝐴′| − 1)!
|𝐴|! (3)
Due to the exponential complexity of the formula, an optimisa-tion of the calculaoptimisa-tion of the influence of an attribute is proposed in [12]. It produces with a satisfactory approximation with a relatively small loss in accuracy).
5
ORGANISATION OF THE FRAMEWORK
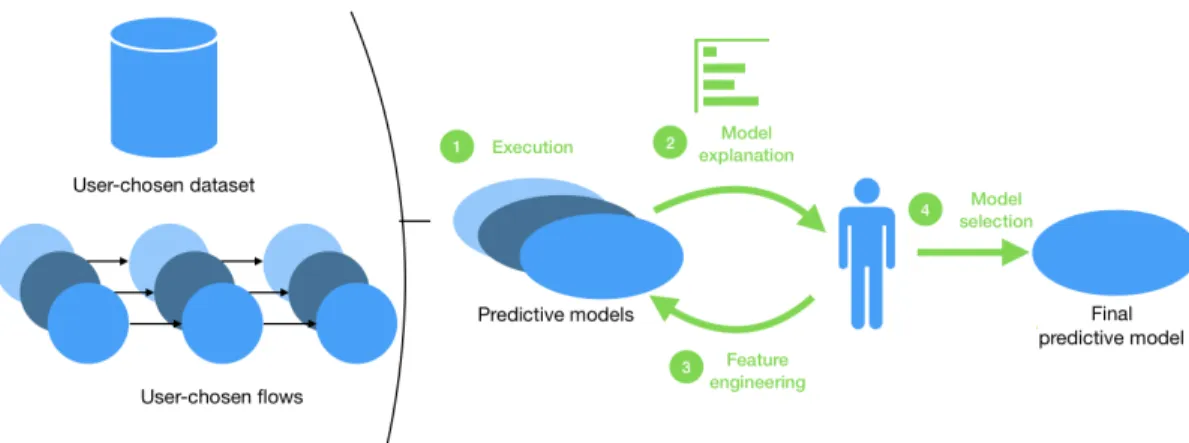
We now present the framework including the two systems described in the two previous sections. Our framework is separated into two use cases. In Section 5.1, we show how a domain expert user can be guided through the complex process of selecting a predictive model among a set of possible ones, while Section 5.2 illustrates how explanations bring new insights during the feature refinement of a predictive model. These two processes are illustrated in Figure 3 and are based on the most common functionalities of the literature described in Section 2.
Remember that this framework is intended for users who have no prior knowledge of machine learning, but who have expertise in their own field (e.g. biologists, doctors, engineers...). These users produce data that they are required to analyze. It is therefore as-sumed that they have a solid knowledge of this data, but not of machine learning methods.
5.1
Model selection via prediction explanation
Workflows recommendation - First, a user produces data he wants to analyse. The data is given as input of the recommender system, along with their specifications for the analysis: the target feature and their preferences in term of results. The system then suggests a set of possible workflows which are the most able to analyse the user’s data.
Execution - Among this selection of possible workflows, the user can select all or a set of them. He can access a description of each workflow and its inner working if desired, allowing him to perform a first selection of the possible workflows. The workflows selected are then executed and produce a set of predictive models.
Model explanation - Using these models, the system can generate the classification of a given instance of the dataset and provide its afferent explanation for each model. These explanations take the form of attribute influences. For instance, in Figure 4, a user is informed that a particular patient is predicted to have diabetes by both models 𝐴 and 𝐵, but that 𝐴 made this decision consider-ing mostly the patient’s diet, while 𝐵 also considers his weight as important. In order to allow the user to explore the models in an intuitive way, a set of 10 instances are recommended for his review. This selection of instances aims to provide the user with a set of pre-diction explanations as diverse as possible, without overwhelming him with a space too large to be explored efficiently by humans.
5.2
Feature selection via prediction
explanation
Feature engineering - Thanks to the prediction explanations, a user can access the reasoning behind each model, allowing him to detect possible flaws in the proposed models. As an example, prediction explanation allowed personnel of an hospital performing a medical study described in [22] to realise that some attributes should not have been included in their dataset. Moreover, based on his own domain of expertise, a user can assess the importance of each feature, comparatively to the importance given to them by the models. Thus, the user can select undesirable features and remove them from the dataset.
Model selection - Once the final desired features have been de-termined, the user exploits his domain knowledge to assess the reasoning behind each model. This assessment is based both on a global evaluation, such as Cohen kappa or the area under the ROC curve, and local information on the prediction. This allows the user to select the desired final model by choosing the best performing model, but also the one with the most relevant use of the dataset features.
6
VALIDATION OF THE FRAMEWORK
In order to validate the answers to our original questions indicated in Section 1, we propose a mock-up of our framework. This mock-up illustrates a use case, based on the well-known UCI pimas indians diabetes dataset (available on many platforms, as kaggle), since familiarity with the dataset is beneficial to the understanding of this validation.
In our use case, a biologist is aiming to study the dataset of pimas indians diabetes, and uses our recommendation system to provide possible analysis workflows. First, as described in 5, the user enters the diabetes dataset as input of the recommender system, and asks it to perform a recommendation.
6.1
Helping a non expert user appropriate the
results of the recommendation by himself
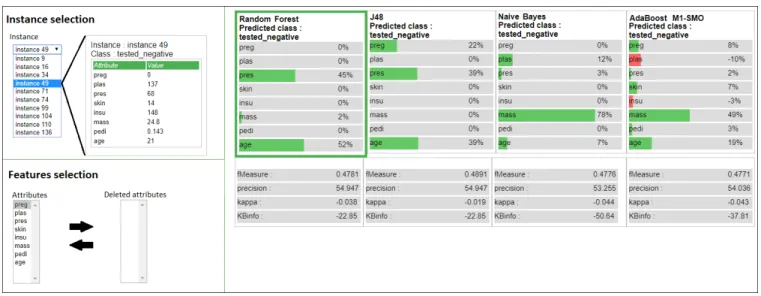
Instead of recommending one of the workflows of the pareto front (see Section 3.4), the user is presented the four best recommen-dations from the pareto front. A description of each workflow is made available to the user, allowing him to perform a first selec-tion among the different opselec-tions. Although these descripselec-tions are necessarily technical, they are essential for a user to understand what is happening when each workflow is executed. The workflows and their descriptions are depicted in Figure 5. As an example, we can see in the figure that a workflow is not only the production of a predictive model, but also successive operations of transfor-mation applied in the dataset. These workflows are then executed and presented to the user through a set of selected instances. These instances are selected in a way that favours a large diversity in predictions explanations. The exact algorithm used here is the one presented in [22]. The user can thus explore each predictive model through this set of instances, by viewing a diverse set of keypoints, illustrating the models. This allows him to infer how the whole model works, with minimal information. The instances and their attached prediction explanations are depicted as in Figure 6. On the left, the user can select the instance he wants to study, and decide
Figure 3: Building a predictive model
Figure 4: Explaining a prediction
to eventually remove attributes from the dataset. On the right is presented the prediction explanation of the selected instance for each of the models. In our use case, we can see the scientist selects the instance 49. Automatically, an explanation is proposed where random forest and bagging J48 (an optimized decision tree) mod-els mainly base their prediction on their blood pressure and age, whereas the naive bayes is mostly influenced by the mass of the instance. This allows an immediate access to the inner workings of each presented workflow, which is solely based on the domain knowledge of the user. Thus, by presenting the results and how they were obtained, the user is informed of the conclusion of the prediction, without having to rely blindly on the model.
Therefore, through prediction explanation, the user can access to a new type of information that does not rely on expertise in data analysis to be understood. He can understand and appropriate the results of the recommendation system thanks to his own domain-based knowledge: without understanding the inner workings of each model. He can visualize how each model uses the data to make predictions.
6.2
Giving a user confidence in the produced
results
Through this explanation method, the user can choose between models without having to rely solely on global measures of perfor-mance. He is able to use his own judgement rather than by the only proposal of a fully automated process. This also makes it possible to evaluate possible defects in the models, which is not always possible with only conventional metrics. As an example, the global
accuracy of a model or the kappa score does not warn a user of an inappropriate attribute which should be removed from the dataset. In our mock-up example, the user can decide that the age of a patient is not that important in determining if he is likely to have diabetes. At the same time, if our user considers a patient’s mass as a valid indicator, it indicates him that the naive bayes model is more interesting in his case (supposing the instances he reviewed are consistent with this explanation). This understanding of a model, its strengths, and its flaws gives the user a stronger confidence in what is being accomplished during the data analysis process. By pinpointing eventual problems in the predictive model, he also becomes able to know when the model is reliable.
6.3
Personalising a model without requiring
data analysis knowledge
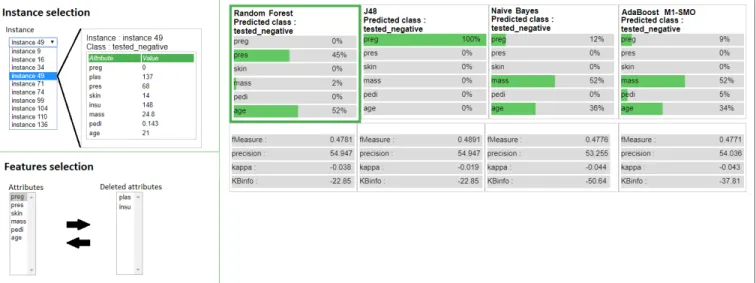
Once the user have studied his models, he can assess which work-flows fit best his requirements. In particular, the user can identify which features are mainly used by the workflows, and decide which are important for his study. In our mock-up example, the biologist might want to study the impact of less evident diabetes indicators, and decide to remove the insulin and plasma features from his dataset (like presented in Figure 7). This forces the workflows to use the other features, and maybe highlight new important indica-tors. We can see in Figure 7 that the J48 workflow has significantly changed its behavior, while Adaboost model has simply adjusted the importance of each attribute.
By this process, the user accomplishes feature selection without having data analysis knowledge or expertise. His domain knowl-edge allows him to assess the interest of a feature and decide if the workflows are using them well or not.
7
CONCLUSION AND PERSPECTIVES
We have presented a framework that proposes a new way to as-sist a user in analyzing their data in two steps. In the first step, a recommendation system provides possible analysis workflows and predictive models, similar to what other users would have done in the past for a similar dataset. In the second step, the proposal of a model explanation allows a domain expert user to study the predictive models by himself.
Figure 5: Workflow recommendation
Figure 6: Visualization of prediction results through prediction explanations
We have shown this framework brings an answer to possible unresolved data analysis pitfalls, by a better understanding of data analysis models and building the user’s confidence.
However, this method still has to be tested in real-world situ-ations. A prototype is then being developed, in interaction with biologists of the institute of Cardiovascular and Metabolic Diseases (INSERM institute). A medium-term perspective is to form a co-hort of actual domain expert users to assess the efficiency of our framework and its capacity to assist them with real-world problems.
REFERENCES
[1] Gediminas Adomavicius and Alexander Tuzhilin. 2008. Context-aware Recom-mender Systems. In Proceedings of the 2008 ACM Conference on RecomRecom-mender Systems (Lausanne, Switzerland) (RecSys ’08). ACM, New York, NY, USA, 335–336. [2] Julien Aligon, Enrico Gallinucci, Matteo Golfarelli, Patrick Marcel, and Stefano
Rizzi. 2015. A collaborative filtering approach for recommending {OLAP} sessions. Decision Support Systems 69 (2015), 20 – 30.
http://www.i2mc.inserm.fr/index.php/en/
[3] Ricardo Baeza-Yates, Carlos Hurtado, and Marcelo Mendoza. 2004. Query Rec-ommendation Using Query Logs in Search Engines. In Proceedings of the 2004 International Conference on Current Trends in Database Technology (Heraklion, Greece) (EDBT’04). Springer-Verlag, Berlin, Heidelberg, 588–596.
[4] S.W. Bennett and A.C. Scott. 1985. The Rule-Based Expert Systems: The MYCIN Experiments of the Stanford Heuristic Programming Project, chap. 19 - Specialized Explanations for Dosage Selection. Addison-Wesley Publishing Company (1985), 363 – 370.
[5] Michael R. Berthold, Nicolas Cebron, Fabian Dill, Thomas R. Gabriel, Tobias Köt-ter, Thorsten Meinl, Peter Ohl, Christoph Sieb, Kilian Thiel, and Bernd Wiswedel. 2007. KNIME: The Konstanz Information Miner. In Studies in Classification, Data Analysis, and Knowledge Organization (GfKL 2007). Springer.
[6] G. Casalicchio, C. Molnar, and B. Bischl. 2018. Visualizing the Feature Importance for Black Box Models. arXiv e-prints (April 2018). arXiv:stat.ML/1804.06620 [7] Li Chen and Pearl Pu. 2005. Trust Building in Recommender Agents. In in
1st International Workshop on Web Personalization, Recommender Systems and Intelligent User Interfaces (WPRSIUI05. 135–145.
[8] Jacob Cohen. 1968. Weighted kappa: Nominal scale agreement provision for scaled disagreement or partial credit. Psychological bulletin 70, 4 (1968), 213. [9] Henriette S. M. Cramer, Vanessa Evers, Satyan Ramlal, Maarten van Someren,
Lloyd Rutledge, Natalia Stash, Lora Aroyo, and Bob J. Wielinga. 2008. The effects of transparency on trust in and acceptance of a content-based art recommender. User Model. User-Adapt. Interact. 18, 5 (2008), 455–496.
Figure 7: New prediction explanations once the attributes plasma and insulin have been removed
[10] A. Datta, S. Sen, and Y. Zick. 2016. Algorithmic Transparency via Quantitative Input Influence: Theory and Experiments with Learning Systems. In 2016 IEEE Symposium on Security and Privacy (SP). 598–617.
[11] Janez Demšar, Tomaž Curk, Aleš Erjavec, Črt Gorup, Tomaž Hočevar, Mitar Milutinovič, Martin Možina, Matija Polajnar, Marko Toplak, Anže Starič, Miha Štajdohar, Lan Umek, Lan Žagar, Jure Žbontar, Marinka Žitnik, and Blaž Zupan. 2013. Orange: Data Mining Toolbox in Python. Journal of Machine Learning Research 14 (2013), 2349–2353. http://jmlr.org/papers/v14/demsar13a.html [12] Gabriel Ferrettini, Julien Aligon, and Chantal Soulé-Dupuy. 2020. Explaining
Single Predictions: A Faster Method. In SOFSEM 2020: Theory and Practice of Com-puter Science, Alexander Chatzigeorgiou, Riccardo Dondi, Herodotos Herodotou, Christos Kapoutsis, Yannis Manolopoulos, George A. Papadopoulos, and Florian Sikora (Eds.). Springer International Publishing, Cham, 313–324.
[13] Mark Hall, Eibe Frank, Geoffrey Holmes, Bernhard Pfahringer, Peter Reutemann, and Ian H Witten. 2009. The WEKA data mining software: an update. ACM SIGKDD explorations newsletter 11, 1 (2009), 10–18.
[14] Jianming He and Wesley W. Chu. 2010. A Social Network-Based Recommender System (SNRS). Springer US, Boston, MA, 47–74.
[15] Markus Hofmann and Ralf Klinkenberg. 2013. RapidMiner: Data Mining Use Cases and Business Analytics Applications. Chapman & Hall/CRC.
[16] U. A. Piumi Ishanka and Takashi Yukawa. 2017. The Prefiltering Techniques in Emotion Based Place Recommendation Derived by User Reviews. Applied Computational Intelligence and Soft Computing vol. 2017 (2017), 10 pages. [17] Igor Kononenko and Ivan Bratko. 1991. Information-Based Evaluation Criterion
for Classifier’s Performance. Machine Learning 6, 1 (Jan. 1991), 67–80. [18] Scott M Lundberg and Su-In Lee. 2017. A Unified Approach to Interpreting Model
Predictions. In Advances in Neural Information Processing Systems 30, I. Guyon, U. V. Luxburg, S. Bengio, H. Wallach, R. Fergus, S. Vishwanathan, and R. Garnett (Eds.). Curran Associates, Inc., 4765–4774. http://papers.nips.cc/paper/7062-a-unified-approach-to-interpreting-model-predictions.pdf
[19] Phong Nguyen, Melanie Hilario, and Alexandros Kalousis. 2014. Using meta-mining to support data meta-mining workflow planning and optimization. Journal of Artificial Intelligence Research (2014), 605–644.
[20] William Raynaut. 2018. Meta-analysis perspectives toward assistance in prediction and simulation. Theses. Université Paul Sabatier - Toulouse III. https://tel. archives-ouvertes.fr/tel-02023797
[21] William Raynaut, Chantal Soule-Dupuy, and Nathalie Valles-Parlangeau. 2016. Mining Evaluation Framework : A large scale proof of concept on Meta-Learning. In 29th Australasian Joint Conference on Artificial Intelligence (2016-12-05). Springer, 215–228.
[22] Marco Tulio Ribeiro, Sameer Singh, and Carlos Guestrin. 2016. "Why Should I Trust You?": Explaining the Predictions of Any Classifier. In Proceedings of the 22Nd ACM SIGKDD International Conference on Knowledge Discovery and Data Mining (San Francisco, California, USA) (KDD ’16). ACM, New York, NY, USA, 1135–1144.
[23] Floarea Serban, Joaquin Vanschoren, Jörg-Uwe Kietz, and Abraham Bernstein. 2013. A Survey of Intelligent Assistants for Data Analysis. ACM Comput. Surv. 45, 3, Article 31 (July 2013), 35 pages. https://doi.org/10.1145/2480741.2480748
[24] Guy Shani, Lior Rokach, Bracha Shapira, Sarit Hadash, and Moran Tangi. 2013. Investigating confidence displays for top-N recommendations. Journal of the American Society for Information Science and Technology 64, 12 (2013), 2548–2563. [25] L. S. Shapley. 1953. A value for n-person games. Contributions to the Theory of
Games 28 (1953), 307–317.
[26] Avanti Shrikumar, Peyton Greenside, and Anshul Kundaje. 2017. Learning Im-portant Features Through Propagating Activation Differences. In Proceedings of the 34th International Conference on Machine Learning - Volume 70 (Sydney, NSW, Australia) (ICML’17). 3145–3153.
[27] Quan Sun, Bernhard Pfahringer, and Michael Mayo. 2012. Full model selection in the space of data mining operators. In Proceedings of the 14th annual conference companion on Genetic and evolutionary computation. ACM, 1503–1504. [28] Nava Tintarev and Judith Masthoff. 2015. Explaining Recommendations: Design
and Evaluation. Springer US, Boston, MA, 353–382. https://doi.org/10.1007/978-1-4899-7637-6_10
[29] Joaquin Vanschoren, Jan N. van Rijn, Bernd Bischl, and Luis Torgo. 2013. OpenML: Networked Science in Machine Learning. SIGKDD Explorations 15, 2 (2013), 49– 60.
[30] Sandra Wachter, Brent D. Mittelstadt, and Chris Russell. 2017. Counterfactual Explanations without Opening the Black Box: Automated Decisions and the GDPR. CoRR abs/1711.00399 (2017). arXiv:1711.00399 http://arxiv.org/abs/1711. 00399
[31] Qi Wang, Jian Ma, Xiuwu Liao, and Wei Du. 2017. A context-aware researcher recommendation system for university-industry collaboration on R&D projects. Decision Support Systems 103, Supplement C (2017), 46 – 57.
[32] Monika Zakova, Petr Kremen, Filip Zelezny, and Nada Lavrac. 2011. Automating knowledge discovery workflow composition through ontology-based planning. Automation Science and Engineering, IEEE Transactions on 8, 2 (2011), 253–264. [33] Yong Zheng, Bamshad Mobasher, and Robin Burke. 2015. Similarity-Based
Context-Aware Recommendation. Springer International Publishing, Cham, 431– 447.