O
pen
A
rchive
T
OULOUSE
A
rchive
O
uverte (
OATAO
)
OATAO is an open access repository that collects the work of Toulouse researchers and
makes it freely available over the web where possible.
This is an author-deposited version published in :
http://oatao.univ-toulouse.fr/
Eprints ID : 17038
The contribution was presented at ICASSP 2015 :
http://icassp2015.org/
To cite this version :
Fontugne, Romain and Abry, Patrice and Fukuda, Kentaro
and Borgnat, Pierre and Mazel, Johan and Wendt, Herwig and Veitch, Darryl
Random Projection and Multiscale Wavelet Leader Based Anomaly Detection
and Address Identification in Internet Traffic. (2015) In: 40th IEEE International
Conference on Acoustics, Speech, and Signal Processing (ICASSP 2015), 19
April 2015 - 24 April 2015 (Brisbane, Australia).
Any correspondence concerning this service should be sent to the repository
administrator: [email protected]
RANDOM PROJECTION AND MULTISCALE WAVELET LEADER BASED ANOMALY
DETECTION AND ADDRESS IDENTIFICATION IN INTERNET TRAFFIC
R. Fontugne
1,2, P. Abry
3, K. Fukuda
1, P. Borgnat
3, J. Mazel
1,2, H. Wendt
4, D. Veitch
5 1National Institute of Informatics, Tokyo, Japan,
[email protected]2
Japanese French Laboratory for Informatics, Tokyo, Japan,
3
CNRS, Ecole Normale Sup´erieure de Lyon, France,
[email protected]4
CNRS, ENSEEIHT-IRIToulouse, France,
5Dept. EEE, University of Melbourne, Australia,
Supported by CNRS-JSPS France-Japan grant, ANR BLANC 2011 AMATIS BS0101102, Strategic International Collaborative R&D Promotion Program of the Ministry of Internal Affairs and Communication, Japan, and EU FP7/2007-2014, grant 608533 (NECOMA)
ABSTRACT
We present a new anomaly detector for data traffic, ‘SMS’, based on combining random projections (sketches) with multiscale analysis, which has low computational complexity. The sketches allow ‘nor-mal’ traffic to be automatically and robustly extracted, and anomalies detected, without the need for training data. The multiscale analysis extracts statistical descriptors, using wavelet leader tools developed recently for multifractal analysis, without any need for timescales to be selected a priori. The proposed detector is illustrated using a large recent dataset of Internet backbone traffic from the MAWI archive, and compared against existing detectors.
Index Terms— Multifractal analysis, multiscale representation, random projection, anomaly detection, Internet traffic.
1. INTRODUCTION
Context: Internet traffic monitoring. Research into Internet traffic measurement has been extensive, ranging from data capture systems, through to statistical analysis, data modeling and prediction. The goals of this activity include insights to better design and operate the network, to optimize resources and performance, and to address security issues. The detection of anomalies is a crucial network mon-itoring task as it impacts at multiple levels including the diagnosis of network dysfunction, localization of performance bottlenecks, and discovery of unusual traffic including malicious activity.
Anomaly detection in computer network traffic context is highly challenging. First there is the variable nature of the data itself, which may be available at levels of granularity that differ in time (fromµs to daily averages), in geographic spread (single link/router or mul-tiple, core or access networks), or in detailed nature (packet times-tamps, sizes, 5-tuples1, or application level data). Second, the origins of anomalies are diverse and include the physical layer, IP protocols, application layer protocols, source traffic events such as flashcrowds, and ‘heavy hitter’ or ‘α-flows’. Anomalies due to malicious activ-ity include those whose signature is well known, for example Dis-tributed Denial of Service (DDoS) and port scanning, but new forms of attack, resulting in new anomalies which may be very subtle, reg-ularly appear. This variety implies anomalous traffics whose forms and statistics show very different kinds of departures from normal
1The standard 5-tuple consists of five IP packet header fields: IP address and port number for source and destination, and IP protocol carried (TCP, UDP or ICMP). Timestamps may be combined with 5-tuples to define flows.
traffic, which precludes the use of matched filter approaches, even if adaptive and advanced. Third, normal traffic is itself an ill-defined notion, and the construction of a traffic reference, against which anomalies can be defined, is non-trivial, in particular since traffic characteristics naturally vary over time with the evolution of appli-cations and services. This significantly impairs the use of supervised classification strategies, as training sets of expert-annotated anoma-lies will in general be unavailable. Fourth, the very high volume of Internet traffic restricts the complexity of statistical features that can be routinely computed. Finally, privacy concerns may also constitute a barrier to anomaly detection.
Related works: anomaly detection. We focus on anomaly de-tection based on aggregated time series, being counts of IP pack-ets or bytes in consecutive time bins, obtainable from packet header traces containing timestamps plus 5-tuples for each packet. This ap-proach has the advantage of being more privacy-friendly than tech-niques that rely on packet payload, and remains relevant in the face of payload encryption techniques such as IPsec. Another advan-tage of time series is that existing signal statistical processing de-tection/classification tools are available, including many with low computational cost, suitable for long time series.
Among unsupervised approaches applied to univariate time se-ries, wavelet filtering has been used to select relevant time scales for detection [1]. Entropy-based detectors applied to specific features (IP addresses and port numbers [2, 3, 4], connection patterns [5]) have also proved successful. Exploiting the scale invariance proper-ties of Internet traffic [6, 7], anomaly detection has also been based on the self-similarity parameter [8, 9]. For multivariate data (multi-link/point measurements), Principal Component Analysis (PCA) al-lows a reference traffic to be computed, and thus to quantify anoma-lous deviations from it [10]. In an attempt to capture different classes of anomalies, multimodal detection procedures were also attempted. For example, Astute [11] monitors packet and byte counts jointly at six different aggregation levels. Random projection tools, also known as hashing procedures or sketching, were also used for the automatic construction of reference traffic [12, 13]. To do this they exploited the flow-level structure of IP traffic. Other works which exploit flow structure include [3, 4, 8].
Goals, contributions and outline. This paper proposes a network traffic anomaly detection procedure, called Sketch and MultiScale (SMS), based on the analysis of packet count time series assembled from 5-tuple plus timestamp data. The procedure is unsupervised, and is therefore suitable for the detection of new anomaly types as
well as old, and avoids the need for training sets. Instead, it uses mul-tiple flow-preserving sketches to extract a reference ‘normal’ traffic from the trace itself. Each sketch yields a time series which is anal-ysed using wavelet-leader based multiscale representations, recently designed for the most up-to-date formalism for practical multifractal analysis [14]. These result in fast, robust, multiscale representations of the statistical properties of the time series, defined over a set of time scales ranging from milliseconds to minutes (over 5 decades). This avoids the a priori selection of time scales at which anoma-lies should be seen and make it feasible to process very large traces. Finally, comparing across independent sets of sketches allows the flow-defining IP addresses involved in the anomaly to be isolated.
Random projections and wavelet leaders are presented in Sec-tion 2.1 and 2.2 respectively, while the anomaly detecSec-tion and anomalous flow identification is detailed in Section 2.3. We put SMS to work on a large recent Internet dataset (1st half of 2014), part of the Japanese MAWI repository [15], described in Section 3. Detection performance is quantified and interpreted qualitatively in Section 4, and compared against that obtained with MAWILab [16], the reference tool of the MAWI repository.
2. METHODOLOGY
For each packeti in a given trace, arriving at time ti, we assign a flow
labelAibased on its 5-tuple. Here we useAi∈ {IPsrci, IPdsti}.
2.1. Random projections / Sketches
A random projection of an IP traceX consists of a hash function, acting on flow labels, which inserts the packets ofX into a hashtable of sizeM , resulting in a random flow-splitting of X into M sub-tracesXm,m ∈ {1, . . . , M }. In other words, all packets of any
given flow are allocated together to a randomly chosen entry in the hashtable. If there are no anomalies, then we expect each sub-trace, or sketch, to be statistically equivalent (and moreover equivalent to the full trace up to a constant variance factor assuming independence between flows). The intuition here is that anomalies inX will only be present in some of its sketches. A median over sketches can there-fore provide a reference for normal traffic that shows little sensitivity to the outlier sketches carrying the anomalies. Furthermore, anoma-lies will be easier to detect in sketches where they appear, as the volume of normal traffic is reduced (higher signal to noise ratio).
A random projection procedure [12, 13] consists of{hn, n =
1, . . . , N } k-universal hash functions [17], giving rise to N indepen-dent sets ofM sketches, and N M packet count timeseries Xn,m.
2.2. Wavelet-leader multiscale representations
It is well-accepted that Internet traffic statistics are well-characterized by scale invariance properties, notably self-similarity and long-memory [6], and that such scaling can be efficiently analyzed using multiscale representations, in particular based on wavelet decompo-sitions [7]. It has also been proposed that scaling in Internet traffic can be modeled by multifractal models [18, 19], and that multifractal properties are best analyzed using wavelet leader based represen-tations [14]. Wavelet-leader based multiscale represenrepresen-tations are therefore a natural choice as a basis for anomaly detection. Wavelet coefficients. Letψ denote the mother wavelet, charac-terized by a strictly positive integerNψ, defined asRRtkψ(t)dt ≡ 0
∀n = 0, . . . , Nψ− 1, andRRtNψψ(t)dt 6= 0, known as the
num-ber of vanishing moments. The (L1-normalized) discrete wavelet transform coefficients dX(j, k) of the process X are defined as
dX(j, k) = hψj,k|Xi, with {ψj,k(t) = 2−jψ(2−jt − k)}(j,k)∈N2. For a detailed introduction to wavelet transforms see [20].
Wavelet leaders. Letλj,k = [k2j, (k + 1)2j) denote the dyadic
interval of size2jcentered atk2j, and3λ
j,kthe union ofλj,kwith
its left and right neighbors: 3λj,k = Sm{−1,0,1}λj,k+m. The
wavelet leaderL(γ)X (j, k) is defined as the largest wavelet coefficient in the neighborhood3λj,kover all finer scalesj′< j [14]:
L(γ)X (j, k) := sup
λ′⊂3λj,k
|2j′γdX(λ′)|. (1)
The parameterγ ≥ 0 must be chosen to ensure a minimal regularity constraint (see [14] for a theoretical study).
Log-cumulants. It has been shown the cumulants of orderp, Cpγ(j),
ofln L(γ)X (j, k) provide relevant representations of the statistics of X as a function of scale 2j([21, 14]). Notably, whenX is
charac-terized by multifractal properties, theCpγ(j) take the explicit form
Cpγ(j) = c0,(γ)p + c(γ)p ln 2j (2)
where thec(γ)p can be directly related to the multifractal spectrum
ofX (see [14, 22] for details). The attributes c(γ)p are not explicitly
used here, instead SMS relies on the underlying multiscale represen-tationsCp(γ)(j), where C1γ(j) is mainly associated to the 2nd-order
statistics ofX (covariance or spectrum), while C2γ(j) conveys
infor-mation beyond 2nd-order statistics. 2.3. Sketch and MultiScale (SMS)
The anomaly detection and address identification procedure of SMS can be outlined as follows.
Step 1 For each trace, use theN hash functions to produce N sets ofM sub-traces, and aggregate each one at resolution ∆0to produce
the flow-sampled time seriesXn,m(t).
Step 2 For eachXn,m, compute wavelet-leader basedCp,n,m(γ) (j),
p = 1, 2. For each n compute the median over the n-th set of M cumulants asC(γ)p,n(j) = Median{C(γ)p,n,m(j), m = 1, . . . , M }.
Step 3 For eachn and p, C(γ)p,n(j) constitutes a robust reference
regarded as characteristic of normal traffic. The Euclidean distance of each sketch to its respective reference in setn is calculated as
Dmp,n= 1 1 + j2− j1 j2 X j=j1 (Cp,n(γ)(j) − C (γ) p,n(j))2 !1/2 . (3)
A sketchk in set n is reported, by cumulant p, as suspicious when its distance to its reference is large compared to the reference variation: Dkp,n> medianm{Dmp,n} + τ MADm{Dmp,n}, (4)
where MAD = Maximum Absolute Deviation, andτ is a parameter.
Step 4 LetAn denote the set of all flow labels from suspicious
sketches from then-th table. This set contains many normal flows which will vary randomly from table to table, whereas anomalous flows will be in found in multipleAn. We define a flow to be
suspi-cousif it appears in at leastℓ of the An.
3. MAWI TRAFFIC ARCHIVE
MAWI Repository. We evaluate SMS using Internet backbone
samplepoint-F transit link connecting several Japanese research institutes and universities to the Internet. Here packet header traces, collected daily from 14:00 to 14:15 (Japanese Standard Time), are anonymized and made publicly available. We use traces captured from the first 15 days of each of the first 6 months of 2014, a total of 78 excluding incomplete traces. Each trace contains roughly 100 to 150 million IP packets, corresponding to an average packet inter-arrival time (IAT) of the order of7µs.
MAWILab. MAWI traffic is currently monitored by MAWILab [16], a combination of four conventional detectors [8, 4, 24, 25], based respectively on multiscale gamma distributions, entropies, Hough transforms and association rules, that incorporates automated reporting and documentation of anomalies.
4. RESULTS
Parameter settings. For random projections, we setN = 8, M =
16, and adopt the hnfrom [17]. The aggregation time (bin size)
is set to∆0 = 2−3= 0.125ms, close to the sketch average IAT of
0.115ms ≈ 16×7µs. Cumulants of order p = 1, 2 with γ = 1 (thus,
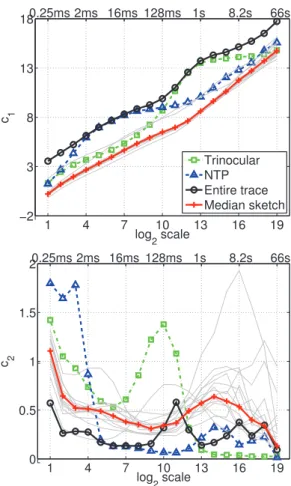
1 4 7 10 13 16 19 −2 3 8 13 18 log2 scale c 1 Trinocular NTP Entire trace Median sketch 0.25ms 2ms 16ms 128ms 1s 8.2s 66s 1 4 7 10 13 16 19 0 0.5 1 1.5 2 log2 scale c 2 0.25ms 2ms 16ms 128ms 1s 8.2s 66s
Fig. 1. Analysis Example: MAWI trace 2014/01/05. C1(j) (top)
andC2(j) (bottom) computed for the entire trace (solid black line
with ‘o’), each of theM sketches (light gray) and median Cp(j)
(solid red with ‘+’). The median (normal)C1(j) is free of prominent
anomalies and exhibits biscaling. Two sketches contain prominent anomalies: trinocular (green dash-dot line) and NTP (blue dashed).
mean and variance ofln L(γ)X (j, k)) are used as suggested for Inter-net traffic statistical characterization in [22]. The detection threshold for suspicious sketches is set toτ = 3. This value was found em-pirically to control false positives, and allows (4) to be viewed as a robust form of ‘µ + 3σ’ . The detection threshold for suspicious flows is set toℓ = 7, since ℓ = 8 frequently yielded no candidates (N too small given the sensitivity of the underlying detector for this data), and the false positive rate is monotonically decreasing inℓ. Introduction. We begin with an example of the analysis procedure over a representative trace, using a single hashtable with IPsrc as flow key. The top plot of Fig. 1 reportsC1(j) computed for each
sketch. All but two almost superimpose (grey lines), and these define the sketch-medianC1(j), whereas the two outliers are detected as
suspicious. The same holds in the bottom plot forC2(j).
Although only two sketches are suspicious, theCp(j) computed
from the entire trace is mostly dominated by them, showing the dan-ger of performing statistical analysis blindly on full traces. Inconsis-tent and difficult to interpret results will be obtained, as the nature of anomalies varies from day to day. Instead, the proposed procedure allows the robust extraction of normal traffic and the characterization of its statistical properties, and thereby the unveiling of anomalies.
Fig. 1 shows that the median sketchC1(j) (red) exhibits
biscal-ing: two different scale ranges separated by a ‘knee’, here atj = 12 (0.5s). Originally reported in [26], this is now commonly consid-ered as a signature of normal traffic. To avoid a failure of statistical robustness at small (too close to the IAT) or large (limit of trace du-ration) scales, we restrict analysis to J = (j1, j2) = (4, 16) (2ms
to 8s). ForC2(j), it is now documented [22] that a relevant range,
where multifractality is shown, is(j1, j2) = (2, 10) (0.5-128ms).
LetDmp,n= | Dmp,n− median(Dmp,n)|/ MAD(Dmp,n) denote the
normalized sketch distance. Fig. 2 provides an overview of all the
sketch summaries by superimposing theN M normalized distance
pairs(Dm1,n, D m
2,n) for each of the 78 traces, using IPsrc (left) or
IPdst (right) flow keys. The thresholds defining suspicious sketches appear atτ = 3 (dashed red lines). The percentages shown give the proportions of these detected byC1orC2alone, or both.
Two Important Anomaly Classes. A manual inspection of the sus-picious flows extracted from the sussus-picious sketches from Fig. 1 con-firmed them to be anomalies belonging to two particular classes.
The first consists of reflection DDoS attacks based on the Net-work Time Protocol (NTP) [27]. Here NTP query traffic sent by the attacker is amplified by triggering NTP servers to ‘reflect’ a large message to the victim. Like most protocols susceptible to reflec-tion attacks, the NTP protocol is carried by UDP, a connecreflec-tionless protocol that allows the reflected traffic to be sent in a tight burst. Consequently, the compromised server sends packets at an abnor-mally high rate, visible in bothC1(j) and C2(j) at fine time scales
Fig. 2. Normalized sketch distance pairs over all traces. The dashed lines mark the thresholds defining suspicious sketches.
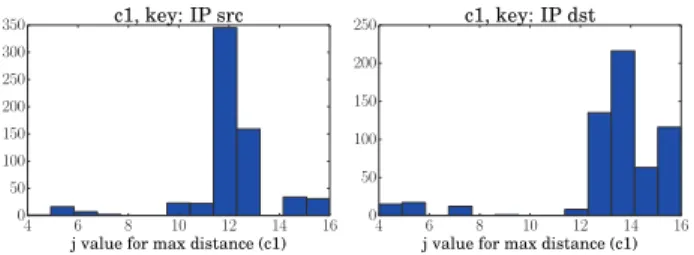
4 6 8 10 12 14 16 j value for max distance (c1) 0 50 100 150 200 250 300 350 c1, key: IP src 4 6 8 10 12 14 16
j value for max distance (c1) 0 50 100 150 200 250 c1, key: IP dst
Fig. 3. Locationj∗ofC1-spikes (spike threshold= 0.1).
(j < 10, or below 128ms), implying it impacts on both temporal correlations and higher order dependencies. Recent NTP reflection attacks have had a significant impact worldwide [27, 28].
The second class corresponds to the scanning activities of the
Trinocularproject [29]. Trinocular probes millions of computers on an ongoing basis in order to monitor their network connectivity, and to detect Internet outages. Because probes are all sent with a timeout of 3 seconds, the corresponding traffic shows a clear characteristic time scale, visible inC1(j) at coarse time scales (j > 10) and in
C2(j) at j = 10 (roughly 128ms). This unusual though benign
traffic has a similar appearance to malicious scans.
Anomaly Classification. Due to the huge volume of traffic data it is not feasible in general, nor here (almost 20,000 sketches were col-lected) to manually inspect all suspicious sketches and flows in order to provide the ground truth needed to assess detection performance using classical tools such as ROC curves. It is however indispens-able to provide a practical means, beyond the conservative settings of thresholds detailed above, to ensure that detected anomalies are meaningful. To this end we make use of a recently proposed back-bone traffic taxonomy [30] to classify suspicious flows into one of six categories, those heading the columns in Tables 1 and 2. This approach contributes to two objectives: (i) an estimated breakdown of anomaly causes, (ii) a check for false positives - the taxonomy is a set of independent context-aware checks which in principle should identify false positives by classifying them as ‘Other’.
To better understand the kinds of anomalies detectable by SMS, two types of suspicious sketches underC1are distinguished:
i)C1-shifts: those distant from the medianC1across all of J. These
are consistent with a volume change of a subset of traffic with the same characteristics as normal traffic;
ii)C1-spikes:those that are close toC1except at some time scale
j∗∈ J. These indicate traffic with anomalous characteristics. Fig. 3 shows that the distribution ofj∗forC1-spike sketches
con-centrates in the range 500 to 1000 ms. Thus, being close to the knee of biscaling, spikes strongly influence multiscale behaviour.
Applying SMS yielded 554 suspicious flows over all traces and both IPsrc and IPdst flows, broken down in Table 1 according to the taxonomy and five disjoint detection scenarios. The proportion classified as ‘Other’ is only26/554 ≈ 4.7%, an indication that the
Scan DoS NTP Pt.Multi.Pt. α-Flow Other Total
C1-shift &C2 37 2 2 40 9 1 91 C1-spike &C2 23 1 9 4 1 0 38 C1-shift only 37 1 14 106 40 15 213 C1-spike only 70 0 3 6 0 5 84 C2-only 14 7 7 45 50 5 128 Total 181 11 35 201 100 26 554
Table 1. Detection detail of suspicious flows, and classification.
Scan DoS NTP Pt.M.Pt. α-Flow Other Total
SMS 181 11 35 201 100 26 554 MAWILab 3626 94 105 2878 1178 260 8141 SMS\ MAWILab 44 11 26 81 93 12 267 MAWILab\ SMS 3489 94 96 2758 1171 246 7854 SMS∩ MAWILab 137 0 9 120 7 14 287 SMS∪ MAWILab 3670 105 131 2959 1271 272 8408 Table 2. Detection breakdown comparison: SMS and MAWILab.
false positive rate is low. The four volume based anomalies [Denial-of-Service (DoS), NTP reflection attacks (NTP), point-to-multipoint traffic (Pt.Multi.Pt.), andα-flows (α-Flow)] are mainly captured as C1shift andC2anomalies, corresponding to both a traffic volume
change and subtle temporal changes beyond correlation. It is worth noting thatC2-only detections, which includes 7/11 DoS and 50/100
α-Flow anomalies, imply that volume-based or correlation based procedures would fail to detect them. Manual inspection of the 7 DoS cases showed that 5 of them occured on the same day, and
consisted of many IP sources each sending45 or fewer TCP SYN
packets to the same network.
Anomalies detected asC1-spikes are mostly classified as Scan
which implies ICMP or UDP traffic. Scanning injects packets with a typical rate, and hence time scale, which interferes with the entire dependence structure (correlation,C1, and beyond,C2) of traffic.
Detector Comparison. Table 2 details the detections, classified ac-cording to the taxonomy, made by SMS and MAWILab over all traces and flow labels. Unsurprisingly, MAWILab detects many more anomalies than SMS, as it combines four different detectors, and multiple parameter settings for each. The main point here is that SMS provides a complementary detection ability: out of its 554 de-tections, 267 are new. Adding SMS to MAWILab would allow 12% (11/94) more DoS detections and 25% (26/105) more NTP ones.
The scan, point-to-multipoint andα-flow anomalies identified
by SMS only (see ’SMS\ MAWILab’ in Table 2) have similar
characteristics to those detected by MAWILab, but they involve far fewer packets. This indicates a greater sensitivity of SMS in those cases. Moreover, out of the 26 NTP amplification attacks caught by SMS only, 13 are significant as they have very high bandwidth. These were captured using IPdst based flows, whereas MAWILab missed them because these attacks had few packets per individual (IPsrc,IPdst) pair.
5. CONCLUSIONS
We have proposed a multiscaling, sketch and flow based detection procedure, Sketch and MultiScale (SMS), which has low computa-tional cost, does not require sensitive payload data, has an ability to generate its own reference traffic automatically and robustly, and in many cases an ability to identify the flows causing the anomalies.
Although it is not feasible, due to a lack of authoritative ground truth, to assess the performance of SMS formally, the majority of the flows detected as suspicious were manually inspected and confirmed as anomalies. By using the anomaly taxonomy of [30], we were able not only to explain the classification of SMS’s detections in terms of the capabilities of the underlying multiscale representations C1(γ)(j), and C2γ(j), we argued that the taxonony acts as a practical cross-check on the false positive rate, which was inferred to be low. We found that SMS provides a useful complementary detection capability compared to the MAWILab detector-set, capable of find-ing both subtle and significant anomalies missed by the latter.
6. REFERENCES
[1] P. Barford, J. Kline, D. Plonka, and A. Ron, “A Signal Analysis of Network Traffic Anomalies,” ACM SIGCOMM IMW ’02, pp. 71–82, 2002.
[2] A. Lakhina, M. Crovella, and C. Diot, “Mining Anomalies Us-ing Traffic Feature Distributions,” ACM SIGCOMM ’05, pp. 217–228, 2005.
[3] X. Li, F. Bian, M. Crovella, C. Diot, R. Govindan, G. Iannac-cone, and A. Lakhina, “Detection and Identification of Net-work Anomalies Using Sketch Subspaces,” ACM IMC ’06, pp. 147–152, 2006.
[4] Y. Kanda, R. Fontugne, K. Fukuda, and T. Sugawara, “AD-MIRE: Anomaly Detection Method Using Entropy-based PCA with Three-step Sketches,” Comput. Commun., vol. 36, no. 5, pp. 575–588, Mar. 2013.
[5] G. Nychis, V. Sekar, D. G. Andersen, H. Kim, and H. Zhang, “An Empirical Evaluation of Entropy-based Traffic Anomaly Detection,” ACM IMC ’08, pp. 151–156, 2008.
[6] W. E. Leland, M. S. Taqqu, W. Willinger, and D. V. Wilson, “On the Self-Similar Nature of Ethernet Traffic (Extended Ver-sion),” Networking, IEEE/ACM Transactions on, vol. 2, no. 1, pp. 1–15, 1994.
[7] P. Abry, R. Baraniuk, P. Flandrin, R. Riedi, and D. Veitch, “Multiscale Nature of Network Traffic,” IEEE Signal Proc.
Mag., vol. 19, no. 3, pp. 28–46, 2002.
[8] G. Dewaele, K. Fukuda, P. Borgnat, P. Abry, and K. Cho, “Ex-tracting Hidden Anomalies using Sketch and Non Gaussian Multiresolution Statistical Detection Procedures,” ACM
SIG-COMM LSAD ’07, pp. 145–152, 2007.
[9] A. Scherrer, N. Larrieu, P. Owezarski, P. Borgnat, and P. Abry, “Non-Gaussian and Long Memory Statistical Characteriza-tions for Internet Traffic with Anomalies,” Dependable and
Secure Computing, IEEE Transactions on, vol. 4, no. 1, pp. 56–70, Jan 2007.
[10] A. Lakhina, M. Crovella, and C. Diot, “Diagnosing Network-Wide Traffic Anomalies,” ACM SIGCOMM ’04, pp. 219–230, 2004.
[11] F. Silveira, C. Diot, N. Taft, and R. Govindan, “ASTUTE: Detecting a Different Class of Traffic Anomalies,” ACM
SIG-COMM ’10, pp. 267–278, 2010.
[12] S. Muthukrishnan, “Data Streams: Algorithms and Applica-tions,” in ACM SIAM SODA ’03, Jan. 2003, p. 413.
[13] B. Krishnamurthy, S. Sen, Y. Zhang, and Y. Chen, “Sketch-based Change Detection: Methods, Evaluation, and Applica-tions,” in ACM IMC ’03, 2003, pp. 234–247.
[14] H. Wendt, P. Abry, and S.Jaffard, “Bootstrap for Empirical Multifractal Analysis,” IEEE Signal Processing Mag., vol. 24, no. 4, pp. 38–48, 2007.
[15] WIDE Project, MAWI Traffic Archive. [Online]. Available: http://mawi.wide.ad.jp/mawi/
[16] R. Fontugne, P. Borgnat, P. Abry, and K. Fukuda, “MAW-ILab : Combining Diverse Anomaly Detectors for Automated Anomaly Labeling and Performance Benchmarking,” ACM
CoNEXT ’10, 2010.
[17] M. Thorup and Y. Zhang, “Tabulation Based 4-Universal Hash-ing with Applications to Second Moment Estimation,” in ACM
SIAM SODA ’04, Jan. 2004, pp. 615–624.
[18] R. H. Riedi, M. S. Crouse, V. J. Ribeiro, and R. G. Baraniuk, “A Multifractal Wavelet Model with Application to Network Traffic,” IEEE Transactions on Information Theory, vol. 45, no. 3, pp. 992–1018, 1999.
[19] N. Hohn, D. Veitch, and P. Abry, “Multifractality in TCP/IP Traffic: the Case Against,” Computer Network Journal, vol. 48, pp. 293–313, 2005.
[20] S. Mallat, A Wavelet Tour of Signal Processing. San Diego, CA: Academic Press, 1998.
[21] B. Castaing, Y. Gagne, and M. Marchand, “Log-similarity for turbulent flows,” Physica D, vol. 68, pp. 387–400, 1993. [22] S. Jaffard, P. Abry, and H. Wendt, “Irregularities and Scaling in
Signal and Image Processing: Multifractal Analysis,” in Benoit
Mandelbrot: A Life in Many Dimensions. World scientific publishing, 2014.
[23] K. Cho, K. Mitsuya, and A. Kato, “Traffic Data Repository at the WIDE Project,” in USENIX 2000 Annual Technical
Con-ference: FREENIX Track, 2000, pp. 263–270.
[24] R. Fontugne and K. Fukuda, “A Hough-transform-based Anomaly Detector with an Adaptive Time Interval,” ACM
SIGAPP Appl. Comput. Rev., vol. 11, no. 3, pp. 41–51, Aug. 2011.
[25] D. Brauckhoff, X. Dimitropoulos, A. Wagner, and K. Salama-tian, “Anomaly Extraction in Backbone Networks using Asso-ciation Rules,” ACM IMC ’09, pp. 28–34, 2009.
[26] N. Hohn, D. Veitch, and P. Abry, “Cluster Processes: A Natural Language for Network Traffic,” IEEE Transactions On Signal
Processing, vol. 51, pp. 2229–2244, 2003.
[27] C. Rossow, “Amplification Hell: Revisiting Network Proto-cols for DDoS Abuse,” in Proceedings of the 2014 Network
and Distributed System Security (NDSS) Symposium, February 2014.
[28] J. Czyz, M. Kallitsis, M. Gharaibeh, C. Papadopoulos, M. Bai-ley, and M. Karir, “Taming the 800 Pound Gorilla: The Rise and Decline of NTP DDoS Attacks,” in ACM IMC ’14 (to
ap-pear), Vancouver, BC, Canada.
[29] L. Quan, J. Heidemann, and Y. Pradkin, “Trinocular: Under-standing Internet Reliability Through Adaptive Probing,” ACM
SIGCOMM ’13, pp. 255–266, 2013.
[30] J. Mazel, R. Fontugne, and K. Fukuda, “Taxonomy of Anoma-lies in Backbone Network Traffic,” in Proceedings of the fifth
International Workshop on TRaffic Analysis and Characteriza-tion (TRAC ’14), 2014, pp. 30–36.