THE SODIUM BACKGROUND CURRENTS IN CULTURED NEONATAL RAT VENTRICULAR MYOCYTES
par Jihong Qu
Département de Physiologie et Biophysique Faculté de Médecine
Thèse présentée à la Faculté de Médecine en vue de l'obtention du grade de
PHILOSOPHIAE DOCTOR (Ph.D)
en Physiologie (Biophysique)
1^1
of Canada Acquisitions and Bibiiographic Services 395 Wellington Street Ottawa ON K1A0N4 Canada du Canada Acquisitions et services bibliographiques 395, rue Wellington Ottawa ON K1A0N4 CanadaYourfilG Votre référence
Ourfile Notre référence
The author has granted a
non-exclusive licence allcwing the
National Library of
Canada to
reproduce,
loan, distribute or sell
copies of
this thesis in microfoim,
paper or electronic formats.
The author retains ownership of
the
copyright in this thesis. Neither the
thesis nor substantial extracts from itmay
be printed or otherwise
reproduced without the author's
permission.
L'auteur a accordé une Ucence non
exclusive permettant à
la
Bibhothèque nationale du Canada de
reproduire, prêter, distribuer ou
vendre des copies de cette thèse sous
la forme de microfiche/film, de
reproduction sur papier ou sur format
électronique.
L'auteur conserve la propriété du
droit d'auteur qui protège cette thèse.
Ni la thèse ni des extraits substantiels
de celle-ci ne doivent être imprimés
ou autrement reproduits sans son
autorisation.0-612-26394-0
and my father who gave me their gift of confidence and courage for life, and to my niece Dehui with whom I wish to share a faith that there is a will, there must be a way.
Acknowledaements
I would like to thank Dr. Otto F. Schanne and Dr. Elena Ruiz-Petrich who offer me their tremendous hospitality, support and protection. Four years ago they accepted me as a member of their laboratories. Dr. Schanne prodded and directed me so that I began to systematically learn ion channels théories and Patch Clamp techniques. Without his kindness, encouragement, and meticulous perusal of my study and research, I would not have been able to reach completion of this Ph.D thesis. I thank Dr. Ruiz particularly for her patience and tolérance especially as I came from a world of
another culture and language.
As well I would love to express my spécial thanks to Dr. Jacques Turgeon from the Institut de Cardiologie de l'Hôpital Laval, and Dr. Gilles Dupuis and Dr. Paul G. Pape from the Université de Sherbrooke for their generosity in accepting being judges of this thesis. Certainly to Dr. Marcel Daniel Payet who must have suffered through my endless botherings these years but still helps me in presiding over the jury committee, I am truly grateful.
prof essors in the department of Physiology and Biophysics who, in one way or another, guided and trained me in the scientific world over the years. To Dr. Eric Rousseau who, as a venerable educator, has been enthusiastically supporting and inspiring me since the very beginning of my studies here, I owe heartfelt thanks.
For me to be able to get through the highs and lows these past few years, friendship surely has been crucial. Ms. Shufen Cai is the first friend who showed me the ropes around the lab when I returned to the académie field. Ms. Diane Beaudoin constantly gives me her loving assistance in cell culture as
well as in the study of French in Québec. I would certainly
like to verbalize my appréciation for ail the pleasant conversations about life I had with Miss Yann Rioux.
Moreover I would like to show my gratitude for the constant assistance provided by o\ar department secretaries Ms. Christiane Ducharme and Ms. Denise Girardin. I am indebted for
the efforts they have made on my behalf.
I am most deeply indebted to my parents who have had the least opportunities for éducation, but who are aware of the most important things in life. They devote their lives to support and secxire whatever I want to try, and always remind me that I can go back to their home whenever I feel tired. For
me the most cherished things in this world are their great love and dedicatory spirit, without which this thesis would never have been brought to completion.
TABLE OF CONTENTS
Chapter 1. Introduction 2
Chapter 2. Materials and Methods 10
2.1 Cell isolation and primary culture 10 2.2 Expérimental apparatus and procédures . . . . 12 2.2.1 Electrodes and basic instrumentation . 12 2.2.2 Modifications of the basic set-up . . . 15
2.2.3 Expérimental procédures 17
2.2.4 Expérimental solutions 20
2.3 Data anaiysis
21
2.3.1 Détermination of input capacitance of
cells 21
2.3.2 Détermination of the transient and
steady state Ij,, 21
2.3.3 Anaiysis of Na currents 24
2.3.4 Anaiysis of the inactivation time co\irse
of In. 27
2.3.5 Statistics and graphies 28
Chapter 3. Results 30
3.1 Surface of the cultured ventricular cells . . 31
3.2 Steady state Na currents 31
3.2.1 Voltage dependence of 31
time in culture 37
3.3 Transient Na currents 42
3.3.1 Voltage control 43
3.3.2 Analysis of 45
3.3.2.1 Analysis of I-V relation . . . . 48
3.3.2.2 Analysis of and 51
3.3.2.3 Analysis of the inactivation time
coiirse of 1^, 52
3.4 Simulation of Na currents 58
Chapter 4. Discussion 62
4.1 Voltage control of Na current measurements . 62
4.2 Discussion about results 64
4.2.1 Two types of Na currents 65
4.2.1.1 Différent voltage dependences . 65 4.2.1.2 Différent channel chord
conductances 67
4.2.1.3 Différent TTX sensitivities . . 71 4.2.2 Na channels change with the development
of cells in culture 74
4.2.2.1 Cell surface develops with the 1^, density remaining unchanged . . . . 74 4.2.2.2 Shift of the window (ho»,
with the shift of the steady state
In. 74
with the âge of cells 76
4.2.2.4 Inactivation time course of Ij^, 78
4.3 Nature of the two types of Na currents . . . 80
Chapter 5. Conclusions 85
Appendix 1. Method of evaluating I"jj, 89
Appendix 2. Analysis of the voltage dependence of 92
LIST OF FIGURES AND TABLES
Figure 1-1 Subdivisions of the persistent Na current
^N»P 6
Figure 2-1 Schematic of the cell-attached (on cell) and
whole-cell patch configuration 14
Figure 2-2 Block diagram of electronic set-up used in
this study 16
Figure 2-3 Phase contrast micrograph of cardiac cells
from 1 day old rats lOh after explantation 18
Figure 2-4 Expanded capacitive transient evoked by a
lOmV depolarizing puise 22
Figure 2-5 Evaluation of I'^n, and I"^,
23
Figure 2-6 Eléments to analyze 1^,
26
Figure 3-1 Examples of measurements of I"^,
32
Figure 3-2 Inhibition of Ij^, by high TTX concentrations
(100-200/tM) 35
Figure 3-3 Effect of high concentrations of TTX on Ij,,
36
Figure 3-4 Effect of low concentrations of TTX on 1^, in
cells cultured < 14h 38
Figure 3-5 Inhibition of 1^, by low TTX concentrations
(5-10/iM) in cells cultured < 14h 39
Figure 3-6 Effect of low concentrations of TTX on 1^, in
cells cultured > 24h 40
(5-10/tM) in cells cultured > 24h 41
Figure 3-8 Transient currents elicited in the same cell
from a conditioning potential of -120 and -70mV 44 Figure 3-9 Examples of current traces and I-V relations
of cell J940518B cultured for 27.5h and cell
J960312R cultured for 12h 46
Figure 3-10 Changes with time in culture of the voltage
dependence of h„ and nioo 49
Figure 3-11 The inactivation time course of 1^, in the
cells cultured < 14h 54
Figure 3-12 The inactivation time course of in cells
cultured > 24h 55
Figure 3-13 Expérimental data fitted to the model of 2 coexisting complété Na current Systems in neonatal
rat ventricles 59
Figure Al-1 Relationship between the I-V curve of the steady state Na current l'^a and the parameters measured in the présent study in an individual
current record 91
Table 3-1 Steady state 1^, in ventricular cells of
neonatal rats 33
Table 3-2 Sensitivity of Na currents to TTX 34
neonatal rats 47
Table 3-4 Steady state Na current inactivation and
activâtion 50
Table 3-5 Inactivation phase of Ifj, in neonatal rat
LIST OF ABBREVIATIONS AMD SYHBOLS A; APD: ATP: Af: A.: BSA: fftp EGTA: En.: 4-AP: Ff: F • '§• gN.: gn»x: g'm«: HEPES; HMEM: HP:
surface area of cells action potential duration adenosine triphosphate
amplitude of the fast inactivating component of Na currents
amplitude of the slowly inactivating component of Na currents
bovin sérum albumin input capacitance
ethylene glycol-bis(/3-aminoethylether) N,N,N',N'-tetraacetic acid
Na current reversai potential 4-aminopyridine
filtering frequency sampling frequency
Na current (chord) conductance
maximum Na current (chord) conductance g^ normalized to the unitary membrane
N-hydroxyethyl-piperazine-N-2-ethanesulfonic acid minimum essential médium with Hanks salts
ho^: steady state inactivation variable, or availability of Na currents
I-V: current-voltage relationship
Iq^:
capacitive current
Ijj: holding current
II: leeik current
Ijj,: sodium (Na) current I"jj,: steady state Na current
l'^N.* transient Na current
IP*^N«*
peak Na current
I(j,p: persistent Na current
1^: the Na current whose steady state component appears
at more négative voltage I"nî steady state component of I^,
I\: transient component of Ijj
IpZ the Na current whose steady state component appears at more positive voltage
I"p: steady state component of Ip
1%: transient component of Ip
Iki: inward rectifier potassi\im (K) current Ijot transient outward current
le,: calcium (Ca) current
J^,: Na current density
k: slope factor in Boltzmann function MEM: minim\am essential medixim
relative conductance of Ij^,
n: niimber of samples
r: corrélation coefficient SD: standard déviation
SEM; standard error of the mean TTX: tetrodotoxin
T;
time constant of the inactivation course of 1^,
Tf: time constant of the fast inactivating component of
^N«
T.: time constant of the slow inactivating component of
^Nâ
TH: activation threshold of of 1^,
V0.5: half maximum voltage in Boltzmann function Vjj; cell membrane potential
Vpj^;
the voltage where the maximum transient Ijj, appears
V^: resting potential
ABSTRACT
Université de Sherbrooke
THE SODIUM BACKGROUND CURRENTS IN CULTURED NEONATAL RAT VENTRICULAR MYOCYTES
by
Jihong Qu
Department of Physiology and Biophysics Faculty of Medecine
Thesis submitted to the Faculty of Medecine to obtain the degree of
PHILOSOPHIAE DOCTOR (Ph.D)
in Physiology (Biophysics)
Sherbrooke, Québec, September, 1996
In neonatal rat ventricular myocytes tetrodotoxin (TTX),
a spécifie blocker of the Na current (In») decreases the
beating rate and the slope of the diastolic depolarization when these cells develop spontaneous activity in culture (Schanne et al., J.Mol.Cell.Cardiol., 9:269-283, 1977). The objective of this study was to measure and characterize the steady state component of 1^, in neonatal rat ventricular myocytes to see whether this current component can modulate the diastolic depolarization. Cardiocytes from one day old
rats were isolated by enzymatic digestion and studied 5-14 and 24-36 hours after explantation at room température with the patch clamp method in the whole-cell configuration. After
pharmacological isolation of 1^,, its steady state and
transient components were recorded using depolarizing puise
protocols with a patch amplifier whose current sensitivity had
been increased to résolve the small steady state 1^,.
In 27 of the total 43 cells an I-V relation of the steady state was found that contained 2 peaks at -49.0±1.4mV (range -66 to -40mV, négative peak) and at -15.4±1.0mV (range -39 to +9mV, positive peak) for the cells cultured < 14 hours. The mean amplitude of the maximum steady state was 4.0±0.3pA. In the cells cultured > 24h, the potentiels where the peciks occurred were shifted in the hyperpolarized
direction to -54.6±1.3mV and -21.4±1.3mV respectively. There was no significant différence in the amplitude and range of
the steady state Ij,, with time in culture.
To test whether the 2 peaks represented 2 différent In,s,
TTX was used. A high concentration (200/iM) abolished both
peaks of the steady state current and the transient component of 1^,. A low concentration (10/iM) inhibited the positive peak
by 51.3±7.8% in cells cultured < 14h whereas the négative peak
did not change. In cells cultured > 24h the inhibition by 10/tM
TTX increased to 91.5±7.5% for the positive peak but the négative peak remained unchanged.
elements for a quantitative description of the steady state
1^4- The I-V relation of the transient 1^,, could be described
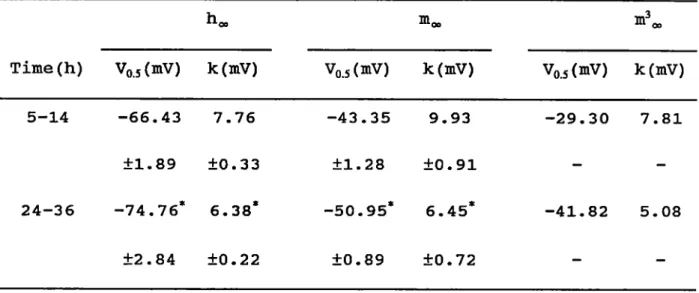
as a single Na current. During time in cultxire (a) the
potentiel of half maximal steady state inactivation changed
from -66.4 to -74.8mV and the slope factor decreased from 7.8 to 6.4mV; (b) the potentiel of the half maximal normalized
conductance shifted from -29.3 to -41.8mV with a change in
slope factor from 7.8 to S.lmV; and (c) the time in culture
did not influence the current density of 107.
0±8.0/tA/cm^ and
the maximum chord conductance of 2.5±0.5mS/cm^. Moreover, the
inactivation of was a monoexponential process shortly after
explantation while it took 2 time constants to describe the
inactivation of the transient in cells cultured > 24h.
We concluded that in neonatal rat ventricular cells (a) two steady state 1^,3 are présent that can be distinguished by
their TTX sensitivity and the potentiel where the peak steady
state current occurs; (b) the steady state current with the
more négative peak is associated with the expérimentally determined transient Ijj,; (c) the shape of the I-V curves of
both steady state currents is compatible with the I-V curve of a window current; (d) if the backgroiind current with the more positive peak is a window current, the conductance of its transient component must be low and comparable to that of the steady state component; (e) the 2 steady state components of Ini appear to reflect the properties of 2 isoforms of the Na channel molecule whose relative importance changes with time
in culture and development so that at a later stage the more TTX sensitive isoform prédominâtes. This could explain the increase in TTX sensitivity of the transient 1^, by a factor
of 10 between the neonatal and adult rat; and (f) the 2 steady
State Ij^,s have considérable physiological importance because the current with the négative peak can modulate the diastolic depolarization whereas the current with the positive peak can influence the plateau phase of the action potential and consequently the action potential duration.
RESUME
Université de Sherbrooke
THE SODIUM BACKGROUND CURRENTS IN CULTURED NEONATAL RAT VENTRICULAR MYOCYTES
par Jihong Qu
Département de Physiologie et Biophysique
Faculté de Médecine
Thèse présentée à la Faculté de Médecine en vue de l'obtention du grade de
PHILOSOPHIAE DOCTOR (Ph.D)
en Physiologie (Biophysique) Sherbrooke, Québec, Septembre, 1996
Dans les myocytes ventriculaires de rats nouveau-nés, la
tétrodotoxine (TTX) , un bloqueur spécifique du courant sodique
(In») , diminue la fréquence des battements et la pente de la
dépolarisation diastolique quand ces cellules développent une activité spontannée après la mise en culture (Schanne et al.,
J. Mol. Cell. Cardiol., 9:268-283, 1977). Le but de cette étude était de mesurer et de caractériser la composante basale du 1^, chez les myocytes du ventricule du rat nouveau-né poiir
dépolarisation diastolique. Des cardiocytes dérivés de rats
âgés de 1 jour furent isolés par digestion enzymatique et étudiés 5 à 14 et 24 à 36h après la mise en culture. Les expériences furent effectuées à la température de la pièce en
employant la méthode de patch clamp en configuration
cellule-entière. Après isolation pharmacologique du 1^,, sa composante
basale et la composante transitoire furent mesurées en employant des puises dépolarisantes avec un amplificateur de
patch, spécialement modifié pour résoudre la petite composante
basale du Ij^,.
Chez 27 cellules sur un total de 43, une relation I-V de
la composante basale du Ijj, était trouvée, celle-ci montrait
2 pics à -49.0±1.4mV (écart -66mV à -40mV, pic négatif) et à
-15.4 ±1.0mV (écart -39mV à +9mV, pic positif) dans des
cellules cultivées pour moins de 14h. L'amplitude moyenne du
maximum de la composante basale du 1^, fut 4.0±0.3pA. Chez les
cellules cultivées pour plus de 24h, les potentiels auxquels
les pics apparaissaient furent déplacés vers des vale\ars plus
négatives,
-54.6±1.3mV
et
-21.4±1.3mV
respectivement.
Cependant, l'cimplitude du courant et l'écart de voltage où
apparaissaient les pics n'étaient pas influencés par le temps
de mise en culture.
Afin de vérifier si les deux pics représentaient deux 1^,3
différents, la TTX était utilisée. Une concentration élevée de 200fM abolissait les deux pics du courant basale et la
inhibait le pic positif de 51.3±7.8% chez des cellules < 14h en culture et l'amplitude du pic négatif ne changeait pas de
façon significative. Chez des cellules > 24h après la mise en culture, l'inhibition par 10/xM de TTX augmentait à 91.5±7.5% pour le pic positif mais l'amplitude du pic négatif ne
changeait pas.
La composante transitoire du Ijf, a été analysée pour obtenir les éléments pour décrire quantitativement la
composante basale. La relation I-V de la composante transitoire du pouvait être décrite comme une seule
composante transitoire du Ij^,.
Avec l'augmentation du temps
de culture (a) le potentiel où 50% d'inactivation au régime
établi était observé passait de -66.4 à -74.8mV et le facteur
de pente diminuait de 7.8 à 6.4mV; (b) le potentiel où la
conductance normalisée était de 50% fut déplacé de -29.3 à -41.8mV accompagné d'une diminution du facteur de pente de 7.8
à 5.1mV; et (c) le temps en culture n'influençait pas la
densité du courant (107.0+8.0/xA/cm^) et la conductance
maximale (maximum chord conductance) de 2.5±0.5mS/cm^. De
plus, 1'inactivation du 1^, fut monoexponentielle < 14h après la mise en culture mais 2 constantes de temps f\irent
nécessaires povir décrire le décours de 1 ' inactivation chez des cellules 24h après 1'explantation.
En conclusion, nous constatons que chez des cellules ventriculaires de rats nouveau-nés (a) existent deux
leur sensitivité vis-à-vis la TTX et par les potentiels où
apparaissent leurs pics; (b) le courant basale avec le pic
négatif est associé avec le courant transitoire mesuré expérimentalement; (c) l'allure des deux courbes I-V des courants basales est compatible avec l'allure de la courbe I-V d'un courant de fenêtre; (d) si on admet que le courant basale
avec le pic positif est \in courant de fenêtre, la conductance de sa composante transitoire doit être basse et comparable à
celle du courant basale; (e) les deux courants basales
sodiques reflètent les propriétés des deiix isoformes de la
molécule du canal sodique dont le rapport change avec le temps
après la mise en culture et le développement, de sorte que
chez l'animal adulte l'isoforme à haute sensibilité vis-à-vis
la TTX est prédominant. Ceci pourrait expliquer l'augmentation
de la sensibilité du 1^» transitoire vis-à-vis de la TTX par
un facteur de 10 chez le rat adulte par rapport au rat nouveau-né; et (f) les deux composantes des courants basales
sont d'une importance phsyiologique considérable parce que le
courant avec un pic négatif peut moduler la dépolarisation
diastolique tandis que le courant avec le pic positif peut
influencer la phase de plateau du potentiel d'action et en
In their pioneering analysis of the process of excitation in the sguid giant axon, Hodgkin and his collaborators
(Hodgkin et al., 1952; Hodgkin and Huxley, 1952a-d) provided
a quantitative description of the transient sodium c\irrent
(l\,) that has later been recognized as responsible for the
upstroke of the action potential in most electrically
excitable cells. At that time, electrophysiological meas\iring
techniques were not available to differentiate between
différent small time independent (background) cxirrents and for this reason Hodgkin and Huxley (1952d) treated the sum of
these currents as a background leak current with a voltage
independent conductance. This situation did not change for
several décades. When Beeler and Reuter (1977) simulated the
ventricular action potential, they used only a voltage
independent sodium background conductance that was about 1000
times smaller than that of the transient ciirrent. However, this parameter was not directly measiired but arrived at by
adjusting the Na background current to account for the level of the resting potential. A similar procédure was adopted by McAllister et al. (1975) and later by DiFrancesco and Noble
(1985) in simulations of the Purkinje fiber action potential. Simultaneously Attwell et al. (1979) foxmd in sheep Purkinje
fibers a TTX sensitive background inward current that had a bellshaped I-V relationship. This current could be described
within the framework of the Hodgkin-Huxley theory as resulting
from the overlap of the voltage ranges of the steady state activation and inactivation (window) of the macroscopic Na c\irrent and it was termed Na window current. Like in the case of the background cxirrent with a voltage independent conductance, the amplitude of the window current is small when compared with that of the transient current, but its conductance is voltage dépendent. Sodium window currents were subsequently found in a variety of cells: Skeletal muscle
(Patlak and Ortiz, 1986, 1989; Gage et al. 1989), sguid giant axon (Gilly and Armstrong, 1984), meimmalian hippocampal
neurons (French et al., 1985, 1990), and in cardiac muscle
(Ten Eick et al.,1984, embryonic chick; Patlak and Ortiz, 1985; Saint et al., 1992, 1994, adult rat; Cohen and Lederer,
1987, neonatal rat). It is probable that a window current
associated with the Na current responsible for the action
potential upstroke cannot explain ail expérimental
observations because Na background currents with voltage
dépendent conductances were observed in a voltage range outside the window (Saint et al., 1992; adult rat).
When the development of the patch clamp technique (Hamill et al., 1981) allowed the analysis of the activity of single Na channels, three types of channel activity were found in
response to a depolarizing voltage step: a sériés of openings whose frequency decreased with time, a sériés of rapid bursts that occurred randomly during the test puise, and isolated
openings also occurring sporadically during the puise. The
first type of activity is consistent with a fast inactivating
macroscopic transient sodium current, the second was attributed to reopenings of the channei that cause a siow
inactivation of
(Kunze et ai., 1985), and the third type
of channei activity was thought to underiie a time indépendant
background current (Patiak and Ortiz, 1985). These resuits were expiained by the hypothesis that the same channei moiecuie can have différant operating configurations or modai behavior but this hypothesis couid not be confirmed because of
the difficuity of obtaining a membrane patch with just one
single Na channei.
There is presentiy considérable interest in the background Na currents concerning their contribution to the
cardiac spontaneous activity. Technicai limitations, however,
do not aiiow us yet to compieteiy understand the mechanisms
that détermina them. In a recent review Criil (1996) termed
the group of Na background currents "persistent Na ciorrents" (Ij^rf) . The common characteristic of the group is that the
currents are either time indépendant or siow inactivating. The iatter notion impiies a long iasting inactivation process that is negiigibie during a test puise duration of 200 to 500ms.
£
Qfsja constanto
gNa(V) (windowc.) modal change Isoforms 1 channelFigure 1-1 Subdivisions of the persistent Na current
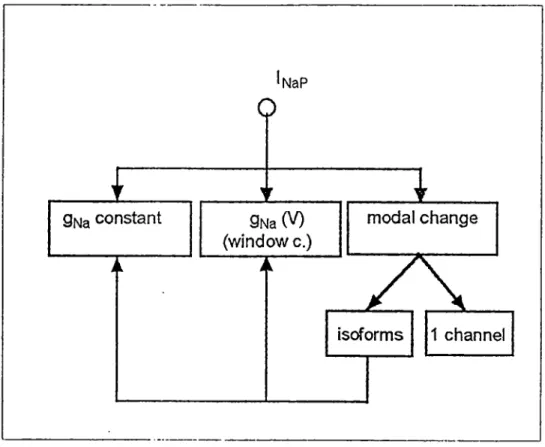
chord conductance of 1^,^; window c.; window current. For détails see text.
In Fig.1-1 I propose a schéma for Ij^p that is compatible
with présent knowledge. According to this schéma has 3 components: currents with a voltage indépendant conductance, currents characterized by a voltage dépendant conductance that englobe also the window carrent, and currents that resuit from modal channel activity. If it can be proven that the modal
changes occur in the same channel molecule, we have genuine modal activity (1 channel in Fig.1-1). But if each mode of
activity corresponds to différant isoforms of the Na channel
(isoforms in Fig.1-1), the modal changes are only apparent and
resuit from the activity of isoforms of Na channels with différant properties that produce currents with either
constant or voltage dépendant conductances.
Although I^ifS are small and at the limit of resolution by
commercially available patch amplifiera in small cells (<10pA,
Qu et al., 1995), these currents are of considérable
physiological and pathophysiological interest. The plateau of the cardiac action potential covers a voltage range where the
membrane résistance is high and the net membrane currents are small. Therefore small current changes can modulate the net membrane current and also the action potential duration, an
important parameter that influences cardiac performance and is
a target for antiarrhythmic therapy. Tetrodotoxin (TTX) has been found to reduce the duration of the plateau of the cardiac action potential (Attwell et al., 1979; Coraboeuf et
al., 1979; Wasserstrom and Salata, 1988) and it is accepted that iNapS responsible for this shortening of the action potential duration.
A similar reasoning holds for the potential range of I^ij.
positive to the resting potential where the diastolic
depolarization occurs. That is of crucial importance for
normal and pathological spontaneous activity. In a cell with an input résistance of 500Mn, a lOpA change in net membrane
current will change the resting potential by 5mV. Depending
whether such a current depolarizes or hyperpolarizes the
membrane, it is strong enough to enhance or suppress
spontaneous activity in a ventricular or sinoauricular cell, for reviews see Schanne et al., 1994, 1995. Moreover, there are reports that in cultured embryonic chick heart cells that
exhibited slow action potentials insensitive to TTX, the drug
decreased the spontaneous beating rate (McLean and Sperelakis, 1975). In cultured neonatal rat myocardial cells a concentration dépendent decrease in beating rate was found between 0.3 and 30fiM. TTX (Schanne et al., 1975). Later it was found that this effect was caused by a decrease in the slope of diastolic depolarization with no measurable change in the parameters of the slow action potentials (Schanne et al., 1977). In the same préparation, Matsuki and Hermsmeyer (1983) confirmed that TTX exposure decreased the spontaneous beating
results were compatible with the hypothesis that an was
contributing to the diastolic depolarization although 1%,
was
inactivated either experimentally or by depolarization occurring during time in culture. At that early time it was technically not possible to confirm this hypothesis by voltage clamp measurements in isolated cells. Cohen and Lederer (1987)
reported an example of an I-V relationship of an measured
in a neonatal rat ventricle cell which they interpreted as a window current. According to our knowledge the only other
measurements of the macroscopic in rat were made in the
laboratory of Saint (1992) in adult rat myocytes where they
found a background current with voltage dépendent conductance that extended too far in the positive potentiel range to be
considered as a window current. Because of these sparse and contradictory results, we decided to study the Na background current(s) in neonatal rat ventricular myocytes at différent
times in short term culture with the objective to clarify i)
their nature in the neonatal rat ventricles and ii) to see
whether the characteristics of these current(s) changed as a function of time in culture.
Chapter 2. Materials and Methods
This chapter starts with a description of the method of cell isolation and culture, followed by an introduction of the
expérimental apparatus and procédures. In the final part, the
techniques of data analysis and data processing are presented.
2.1 Cell isolation and primary culture
The isolation procédure of the myocytes was similar to
that described elsewhere (Payet et al., 1985) . The hearts were
taken under stérile conditions from 10-12 Sprague Dawley rats
(less than 1 day old) after décapitation. The apical third of
the heart was used to avoid contamination of the ventricular
myocardium by conducting tissue. The ventricle parts were
collected in ice cold Hanks solution supplemented with 0.1%
ser\im albximin and 5mM
N-hydroxyethyl-piperazine-N-2-ethanesulfonic acid (HEPES) adjusted to a pH of 7.2. After
mincing with fine scissors for 2-3min the fragments were
transferred to a 25ml Erlenmeyer flask containing a stir bar
together with 0.1% of collagenase (type 2, Worthington Biochemlcals). The tissue fragments were incubated in this solution for 2 periods of 10min at 3 6°C; after each period the supernatant was decanted and replaced with fresh and prewarmed collagenase solution. The cells were then inciibated for another set of four 10min period in collagenase solution during which the suspension was gently stirred at 90rpm. After each period the supernatant was collected in centrifuge tubes filled with HanJcs solution and 0.1% bovine sérum alb\imin at 4°C. The suspension was centrifuged at 100g for 10min and the pellets were resuspended in Minimxim Essentiel Mediim with Hanks salts (Gibco) supplemented with 20% fetal bovine semm and 50^g/ml penicillin-G (cultiire medixim) . The semim had been dialyzed to reduce its K concentration to that of the Hanks solution. The cell suspension was then seeded at a density of
3x10^ cells in a Pétri dish of 35mm diameter. The cultures
were kept in an incubator at 36®C with controlled atmosphère
(air and 5% COj) . The cells were used within 5 to 36 hours
after explantation.
The basic electrolyte solution was the Hanks solution composed of (in mM) : NaCl 137, Na2HP04 0 . 34, NaH2P04 0.50, NaHCOj 4.2, KCl 5.4, KH2PO4 0.44, MgS04 0.81, CaCl2 1.3, and glucose 5.6. The pH was adjusted to 7.4 with IN NaOH. Ail solutions were filtered through filters with 0.22/<m pore size (Millipore Products Division, Bedford, MA).
2.2 Expérimental apparatus and procédures
In this section, first the electrodes and basic
instrximentation used in this study are discussed, followed by
the description of the modifications on the basic set-up. These modifications were made to improve our ability to résolve the small currents and to prevent saturation of the A/D converter by the large during recording of the steady State Na current Finally a summary of the expérimental procédures will be presented.
2.2.1 Electrodes and basic instrumentation
The patch electrodes were drawn from Pyrex code 7740
glass (Corning Glass Works, Corning, NY) with 1.5mm O.D. in a 2 stage process on a vertical puller (Narishige, Tokyo, Japan; Model PP-83), they had résistances of 3-4Mn and junction potentials of < -5mV when measured in the bath solution. The electrodes were filled with a solution consisting of (mM) : CsCl 120, NaCl 5, Mg-ATP 5; MgClj 4; EGTA (ethylene glycol
bis(jS-aminoethyl ether)NN^-tetraacetic acid) 20; and HEPES 10.
The pH was adjusted with IN CsOH or HCl to 7.2.
section of a Dagan 8800 Total Clamp System (Dagan Corporation, Minneapolis, MN) in the whole-cell configxiration (Fig.2-1) with a probe containing a feedback resistor of lOOMfî. In sériés with the amplifier was an 8 pôle Bessel filter with a maximal selectable gain of 10 and a corner frequency of 30kHz (Model 902, Frequency Devices, Haverhill, MA). The filter output was connected via an IBX data acçpiisition interface
(INDEC Systems, Sunnyvale, CA) to a Commodore PC 40-III
computer (Commodore Business Machines, Agincourt, Ont). This arrangement allowed automatic data acquisition (maximxim rate 40kHz) and command puise génération using the BASIC FASTLAB, V4.5 software package (INDEC Systems). Parallel to the input of the instr\imentation interface was a storage oscilloscope (model 5113, Tektronix, Beaverton, OR) that allowed continuons monitoring of the input signais to the computer.
The mechanical part of the set-up was mounted on a granité plate supported by an antivibration device (TMC, Peabody, MA) that itself was positioned on a stone table. On the granité plate was an inverted microscope (Model CK2, Olympus Optical Co., Tokyo, Japan) bolted to a 12mm iron plate together with a mechanical micro-manipulator (Zeiss Jena, Germany). The microscope was equipped with phase contrast optics that allowed observation of the cells with 300x magnification. A condensor with an ultrawide working distance peraitted the positioning of the patch electrode. To reduce
On-cell
B-
a
Wliole-cell Suck 14A-b
m s T14B-b
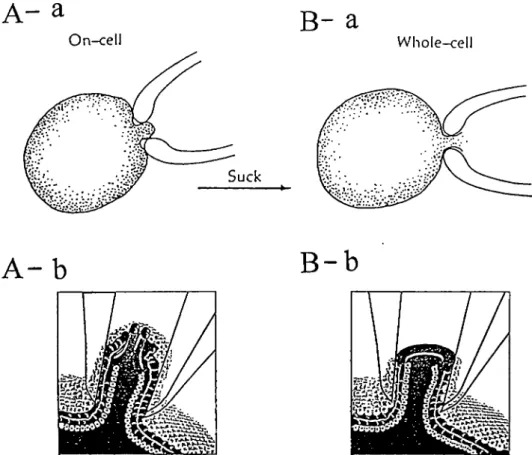
Figure 2-1 Schematic of the cell-attached (on cell) A and whole-cell patch configuration B. A-a; The electrode forme an electrically tight seal (gigaohm seal) with the sxirface membrane of a cell, usually by applying a slight négative pressure. Under favorable conditions the electrical activity of a single channel can be recorded, A-b. B-a: Applying a puise of négative pressure in the cell attached configuration breciks the membrane and gives the electrode access to the cell interior, B-b. In this configviration the capacity of the whole membrane sxirface is accessible to the electrode and, in voltage clamp mode the net current crossing the cell membrane can be recorded.(A,B-a from "lonic Channels of Excitable Membranes", p.89, 2nd Ed., B.Hille, Sinauer Associates Inc.; A,B-b from "Calcium Channels in the Heart; An Overview", Heart Disease and Stroke 1992, 1:398-403, CW.Willieim & MR.Gold)
electromagnetic interférence, the microscope lamp was separated from its original circuit and reconnected to a highly filtered DC power supply, positioned outside the steel Faraday cage that covered the mechanical set-up.
2.2.2 Modifications of the basic set-up
Because the current resolution of commercial patch amplifiera is too low to résolve small currents in the whole-cell mode, signal conditions were carried out with a filter/amplifier (8 pôle Bessel filter, Frequency Devices) in sériés with a mode! LPF-lOOA (Warner Instrument Corporation, Hamden, CT) amplifier/filter typically in BYPASS mode that allowed an adjustable gain with a maximum of 1000 between the output of the clamp amplifier and the input of the instrumentation interface. This resulted in a maximum sensitivity of the current to voltage converter of lOfA/mV (lOpA/mV at output of clamp amplifier). While the increase in gain was sufficient to résolve currents in the range of 1 to lOpA, we were aware that the trade off was a détérioration of the signal to noise ratio.
The analog to digital converter of the recording system was set to a maximum input voltage of ±10V and therefore at full gain the converter would saturate when the cell developed a current larger than lOOpA. This posed a serions problem when
CURRENT
PATCH ELECTRODE IN CELL
AMPLIF.
fil COMMAND SIGNAL D/A
CONVERT.' RELAY DRIVER TRIGGER#! DIGITAL OUTPUT INTERFACE
o
A/D CONVERT 1 to FILTER 000 RELAY CLAMP AMPLIF OSCILLOSCOPEFigure 2-2 Block diagram of electronic set-up used in this study. For détails see text. Amplif. amplifier; convert. converter.
nieas\iring the Na background current by applying depolarlzing puises. Under these conditions, the peak transient current in the order of 5nA would Overdrive the A/D converter. To overcome this problem, at the output of the clamp amplifier a relay (Fig.2-2) was introduced which was normally open and could be activated by a trigger puise available at the interface (Fig.2-2, trigger#l). In addition, a circuit (relay driver, Fig.2-2) was added to link trigger#l with the relay. Ail these provided a delay between the onset of the depolarization and the moment when the relay closed, and thus protected the filter/amplifier cascade and the A/D converter
from overload during the surge of l\,. This also enabled the
use of the high sensitivity of the recording system to measure
the steady state current once the relay was closed at a time when I\, had declined. Usually the closing of the relay was
set to 50ms after the onset of a depolarizing puise. Fig.2-2 shows the schematic of the electronic circuit used in the
présent study.
2.2.3 Expérimental procédures
The cells used for the measurements were attached to the
bottom of the Pétri dish. They had a spindle or triangular shape, and they did not show spontaneous activity in the first 10-12 hours after explantation, Fig.2-3. Cells exhibiting visible blebs or intracellular lipid droplets were discarded.
o
/F
rs &F
kl
•J O é / ' % «rFigure 2-3 Phase contrast micrograph of cardiac cells from 1 day old rats 10 hours after explantation. The myocytes were thicker than the stretched eut fibroblasts (F) and can be recognized by a halo around their cell body. Note that
although these cells contracted upon stimulation or
spontaneously, they did not show cross striations as seen in adult myocytes. Calibration 50^m.
Ail current measurements were performed at room
température (21-23°C) . After the culture médium was replacedby the basic expérimental solution, the Pétri dish was transferred to the stage of the inverted microscope. To avoid the effects of eventual concentration changes due to evaporation or convection, the médium was changed at 15min intervais or after every successful patch measurement.
Once the patch electrode was in the extracellular
solution, first the electrode résistance was determined and
the junction potentiel was compensated to zéro. The electrode capacitance was optimally compensated and, after the membrane was ruptured, the charging transient of the membrane current was recorded in response to hyper- and depolarizing puises of lOmV. Intégration of the charging transient allowed the calculation of the input capacitance thereby an estimate of the surface area of an individual cell. Then the capacitive transient was minimized and the sériés résistance was compensated \intil an increase in noise level indicated maximum possible compensation before the onset of oscillation, typically 45 to 60%. A typical sequence of measurements consisted in measuring the steady state inactivation, the current voltage (I-V) relationship of the transient current (relay throughout in closed position) , and the I-V relation of the steady state current (relay initially in open position).
2.2.4 Expérimental solutions
The basic expérimental solution consisted of (in mM):
NaCl 140, KCl 5.4, MgClj 1.2, CaClj 1.3, HEPES 20, glucose 5.5. The pH was adjusted to 7.4 with HCl or NaOH. The following blockers were added from stock solutions to reach the final concentrations of 4mM 4-aminopyridine (4-AP), blocker of the Ca indépendant transient outward current, 5mM CsCl, blocker of potassium ciirrent, and 0.3mM CdClj, blocker of the slow inward current. Tetrodotoxin (TTX) was used in some experiments to block the components of at concentrations of 10 and 200/iM.
The stock solutions were prepared as follows: (1) 564.6mg 4-AP were dissolved in 5ml distilled water and 2.5ml IN HCl and the pH was adjusted to 7.4 with IN NaOH. The volume was diluted to 10ml to give a final concentration of 0.6M. The
stock solution was kept at room température. (2) 165.Omg CdClj
and 1.263g CsCl were dissolved in 10ml distilled water to give a 90mM and 0.75M stock solutions respectively that were stored at 4°C. (3) Img TTX (Sigma Chemical Company, St Louis, MO) was dissolved in lOul IN HCl and then diluted in 3.12ml distilled water to yield a ImM stock solution that was stored at -20°C.
2.3 Data analysis
2.3.1 Détermination of input capacitance of cells
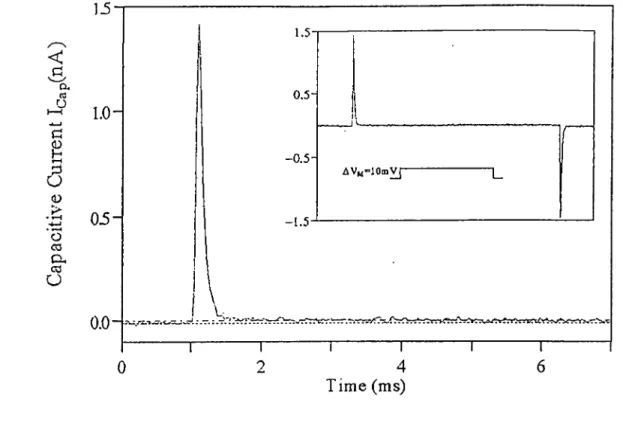
Fig.2-4 shows the capacitive current in response to a lOmV depolarizing puise. The time intégral over the capacitive transient shows that during the puise a charge of 80fC was transferred that resulted in an input capacitance of 8pF (transferred charge / amplitude of command puise). Assuming a
spécifie membrane capacitance of 1/tF/cm^ one obtains an
estimate for this cell surface of 800/^m^. For a justification
of this method of estimating the cell surface see Schanne etal., 1990.
2.3.2 Détermination of the transient and steady state INa
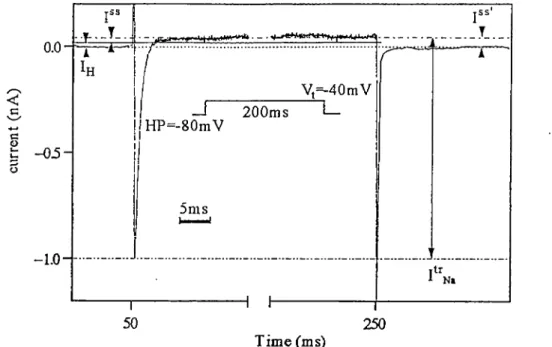
Fig.2-5 shows an example of the transient Na current
(1%) together with the steady state component I" that
contains the steady state Na current I"Na* The peak amplitude of is measured between the current peak and the steady state current level.
I" is the current measured from the zéro current line to the steady state level of 1^,. To avoid the calculation of the zéro current level for each measurement, an alternative method
< a. es U a
ë
c5
<D 'o C3 eu ca a 1.5 0.5-AV„"10m^ 1.5 0.0 rrYNtC-b»^ Time (ms)Figure 2-4 Expanded capacitive transient evoked by a lOmV depolarizing puise. The dotted line represents the current at the beginning of the puise and the dash-dot line is the level of the leak current flowing through the cell input résistance. Inset: Capacitive transients at the leading and trailing edge
0.0-c c c o -05-I
Vt=-40mV
—I 200ms I— HP=-80mV 3ms 50 250 Time (ms) itr ^ N*Figure 2-5 Evaluation of I\, and 1"^,. Peak I\, was iiieasured
directly as the current between the peak and the steady state
levai of In,. I"' (current measured from the current levai at
the beginning of the puise to the steady state levai of Ijj,)
was used to evaluate 1"^, after correction for II and lu as described in the text. Inset: puise protocol.
was chosen to evaluate the current was measxired from the holding level of the puise (holding current, i.e. at the
beginning of the test puise) to the steady state level of Ij,»,
I"', Fig.2-5. It can be shown that the I-V relation of I"' is
nonlineeir and has 3 components:
I"- = l'V. + Il - Ih
(1)
where Ih represents the constant holding current at the
holding potentiel Vh and II is a leak current with a voltage independent conductance gL,
Il = gL (Vm - VJ (2)
where V, represent the resting potentiel and the test
potentiel respectively. The term (Il -
Ih) represents a linear
I-V relation (Figs.3-1B and C) that after subtraction from I"' yields the I-V relation of I"^, (For détails and justification
of the procédure see Appendix 1).
2.3.3 Analysis of Ne currents
The quantitative description of the I-V relation of l\,
and I-Ha is modified and approximated from the Hodgkin-Huxley concepts of excitability that inspite of some shortcomings is still the most extensively used basis for modeling ionic
currents:
IV = gnux mV (Vm - En.)
(3)
and
IV
~ gmix ^^00 1^00 (Vm - En.)
(4)
where g„„ is the maximxim chord conductance (Jack et al.,
1975) , hoo and nio. represent the steady state inactivation and
activât ion respect ively, E^, is the reversai potential of 1^,,
and Vm stands for the membrane potential. The voltage dependence of m„ and hg. can be described by Boltzmann functions:
= [1 + exp((Vo.5,„ - VM)/k„)]-^
(5)
and
h„ = [1 + exp((VM - Vo.5.h)Ah)]
'
(6)
where Vqs is the potential where the function is half maximal and k is the slope factor measured in mV. Equation (3) is a simplification of a more général expression that also dépends on hoo and has been used with différent notations by Hanck and
Sheets (1992) and Schackow et al. (1995). The formulation of
I"n, (Equ.(4)) has been employed by Attwell et al. (1979) to
describe the Na'^'-window current in sheep Purkinje fibers. A
discussion of the properties of these équations can be found in Appendix 2.
B
c o C3 O :2; i.o-B C c3 -o u M "Ï C o 2 0.5- 0.0-OJJ lOOmi /• - 0 1.0- 05-WufStaV --2 --3 --A H 2 p: O § CT » 13 > 1 T" -80 -60 -40 50 -20 0 20 40 Membrane Potentiel (mV) 80 -50 — -60 — 2 -2- -70 — ^o~ \-4. -90 —//
-120 -100 210 225 (ms) 0.0-Measured Fitted,h„ -120 —I— -100 1 -80 I -60 --40 -20 Membrane Potentiel (mV)C
c D -S & 1.0- 0.5- 0.0--120hco
m 30- -^0--20 -SO -50 -00 -40 100 80 -60 -20 Membrane Potentiel (mV)Figure 2-6 Eléments to analyze 1^,. A: I-V relation of peak 1^,
(filled points) fitted by Equs.(3), (5) (dashed line) and fit
of normalized conductance (open circles) by Equ.(5) (full
line). Parameters of m„: Vqs -47.1mV, k 4.9mV, and 56.7nS.
Inset: puise protocol with sample traces. B: Measured points for steady state inactivation (filled squares) fitted by Equ.(6) (smooth curve). Parameters of h„: -69.3mV and k
7.8mV. Inset: Puise protocol and selected traces, the numbers
beside the current traces indicate the values of the
conditioning potentiels. Besides measurements, h^^ was also
able to be obtained from the simulation of the steady state Na currents (referring to 3.4 Simulation of Na currents). C: Voltage dependence of steady state activation and inactivation showing the overlap of both curves responsible for the window current. Inset: Predicted window current calculated with Equ.(4) using the parameters from the calculation shown in panels A and B. Note that the window current in this example was exceptionally large.
Fig.2-6 shows the results of an actual analysis of Panel A represents the measured values of peak 1^, fitted by Equ. (3) . The left side (open circles with full line) of the panel is the normalized chord conductance • The chord coductances (gN.) were calculated by the relation:
^Nâ ~ / (Vm - Eji,) (V)
where represents peak 1^, at a given test voltage, the slope of the ascending limb of I-V plot,was the maximum of gN,.
Panel B depicts the measured values of the steady state inactivation fitted by Equ.(6). Panel C shows the steady state activation and inactivation superimposed to demonstrate the existence of their overlap, the window, responsible for the window current. The inset shows the window current calculated with Equ.(4) using the data obtained from the curve fittings in panel A and B.
2.3.4 Analysis of the inactivation time course of INa
The time course of the inactivation process of a macroscopic current is still incompletely understood. It was postulated in the Hodgkin-Huxley theory (Hodgkin and Huxley, 1952a) that has a monoexponential inactivation. Therefore
provide an important critérium whether the behavior of a
channel population follows the prédiction of the Hodgkin-Huxley theory. In this work, the question of whether 1^,
inactivation followed a mono- or bi-exponential inactivation time co\irse was examined by fitting the first 100ms of the inactivation process to the following équations:
In. = A exp (-t/r) (8)
or In, = Af exp (-t/Tf) + A, exp (-t/T.) (9)
with a least-squares modified Marquardt algorithm (Inplot
V4.0, Graphpad Software, San Diego, CA). In these équations, A represents the amplitude of the current at time t = 0, and T is the time constant of inactivation. The subscripts f and s stand for the fast and slow components of a biexponential inactivation process.
2.3.5 Statistics and graphies
The data base for the results of this study was constructed with the Lotus 123R3 spreadsheet (Lotus Corp., Cambridge, MA). The Graphics were produced and double-sided t tests were performed either with the Inplot V4.0 or later with Prism V2.0 programs (Graphpad Software, San Diego, CA) . Unless otherwise mentioned, the threshold for statistic significance for the t tests used in this study was set at 0.05.
Chapter 3. Results
3.1 Surface of the cultured ventricular cells
It was found in this work that ventricular myocytes
isolated from newborn rats significantly increased their
surface when grown for 1 day in the presence of sérum. In a
total number of 67 cells, the mean svirface area increased from
1205±71/im^ to 1755±98/im^. This increase in cell siirface during
development is consistent with the increase in protein content
and cell volume reported for the same préparation (Simpson et al., 1982). This suggests that there is a real cell growth during the first day in culture and that it is an acceletated
growth compared to that found in the intact animal because the
sxirface of neonatal rat vèntricle cells does not significantly
increase during the first 9 days of postnatal life (Wediler,
1992).
3.2 Steady state Na currents
3.2.1 Voltage dependence of 1%,
of 43 cells and Fig.3-1 shows typical measurements. In 27 of these cells the I-V plot of I"^. showed 2 peaJcs « and the occurrence of the 2 peaks was indépendant of the time d\iring which the cells were cultured (10 cells <14h, 17 cells >24h). In the remainder of the cells, 5 showed only 1 peak and the existence of 2 peaks was uncertain in 11 cells. Because the finding of 2 peaks in the relation was unexpected and
is the major finding of this study, the I"ni~Vm curves of those
27 cells were closely examined.
In the cells cultured < 14h the 2 pecdcs of I"^, appeared at -49.0±1.4mV (range from -66 to -40mV, the négative peak) and at -15.4±1.0mV (range from -39 to +9mV, the positive peak) respectively. The mean amplitude of I"jj, was 4.0±0.3pA. In the cells cultured for more than 24h the potentiels where the 2 peaks occurred were shifted in the hyperpolarized direction to -54.6±1.3mV and -21.4±1.3mV respectively. Table 3-1. There was no significant différence in the amplitude and voltage range of I"jj, with time in culture.
« The criteriiim for the définition of a peak in the I-V relation of the steady state current was that the peak was supported by data points for a minimal voltage range of lOmV, i.e. 2 points when 5mV steps were used (Fig.3-1B) or 5 points when 2mV steps were used (Fig.3-lC).
c: ë
a
C3 zB
230 30-Time (nis) < c flj c CJ 20- 10--♦— Measured -«— Correct ed O OmV r- = 0 -10 -65 -40 15 J-30 -55 AVK,=5m V lOpA HP 270 -10-■ ♦ ■-« ■ -20--80 -60 "~r~ -20 Membrane Potential (mV)C
60- Measured Corrected 20 40 45-< ô •i-» C u 30-t 3 u co 15-2 ^ ♦ >s»**
— -15--80 1 -60 -40 -20 Membrane Potential (mV) 20Figure 3-1 Examples of measurements of A: Measurement of I"n, during the last 20ms of a 200ms test puise. The symbols beside the traces indicate the voltage level of the respective test puises. The (gross) horizontal lines at the right side of the figure indicate the constant current level after digital correction for the 60Hz interférence signal. The (fine) horizontal dot-dash line: Level of the holding current after termination of the test puise. The différences between the
broken horizontal line and the drawn out lines represent I"'
that contains I"n,- For détails see methods. The vertical dashed line: End of test puise. Vj: Test potentiel, Vh: Holding potentiel. Inset: Voltage protocol. Corner frequency of filter: 60Hz. B: I-V relations obtained from the data in A.
The closed diamonds: I-V relation of I"'; the closed squares:
I-V relation of 1"^,, obtained after subtracting (Il - Ih) from
I"', see Equs. (1) & (2) . Cell J940518B cultured for 27.5h, HP
-70mV. Note that I"' moves through 2 minime (-55mV and -15mV)
during the depolarizing voltage steps in A and B. C: I-V relationships measured under similar conditions as the record in B. The I-V curve after correction for the linear component represents I"jj, of cell J960312R cultured for 12h. HP was -80mV with test voltage steps of 2mV and a corner frequency of 20Hz. Two minime of the steady state current at -60 and -18mV can be distinguished.
Table 3-1 Steady state 1^, in ventricular cells of neonatal rats
-1-88
N I"p
Time inuuc Vpe^ i|njoc v„^
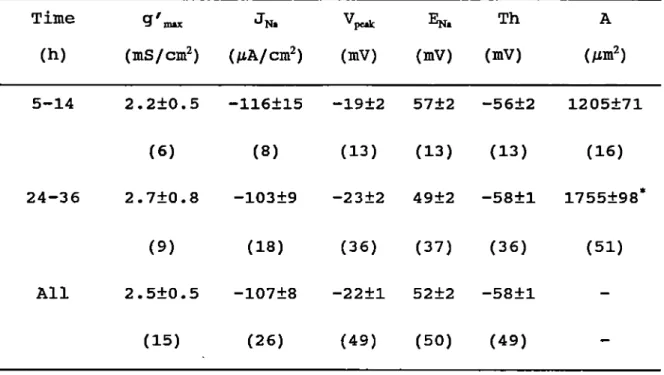
(h) (PA) (mV) (mV) (mV) (pA) (mV) (mV) (mV) 5-14 -2.9 -49.0 -65.8 -39.8 -4.9 -15.4* -38.8 9.3 ±0.4 ±1.4 ±1.1 ±1.0 ±0.9 ±1.0 ±1.4 ±2.4 (10) (10) (8) (8) (10) (10) (8) (8) 24-36 -3.6 -54.6* -66.5 -43.0 -4.6 -21.4** -38.8 1.0 ±0.6 ±1.3 ±0.9 ±1.1 ±0.5 ±1.3 ±1.4 ±2.1 (15) (17) (16) (16) (15) (17) (16) (16) g'm«.N 5-36 mS/cm^
mS/cm^
2.5 0.011 ±0.5 ±0.002 (15) (6)The data are expressed as means ± SEM (n) . Time: the time în
culture; I„.^: the maximum steady state Na current; Vj^: the voltage
where the maximxim steady state Na current occurs; and the limits of voltage range of each steady state Na current; g'niM* the normalized maximum chord conductance. *: the négative shift of with Time was statistically significant. §: the différence betweenVpck of I'n and that of I"p was statistically significant.
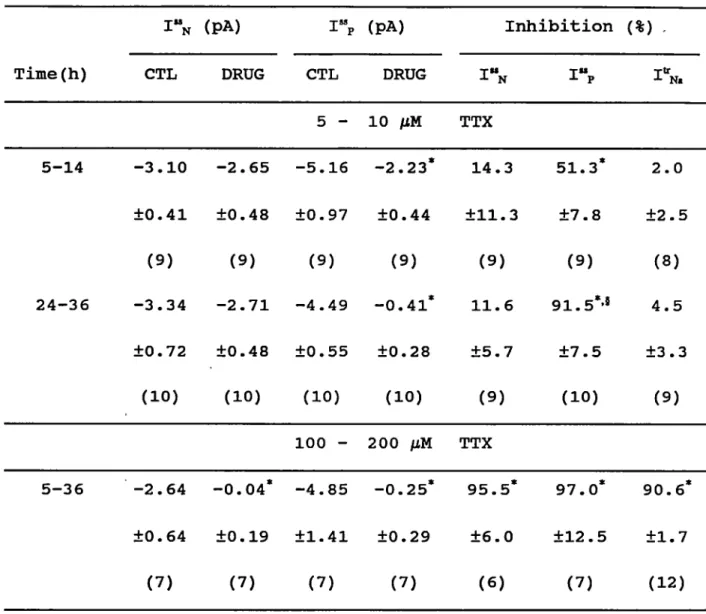
Table 3-2 Sensitivity of Na currents to TTX
T" (PA)
p (pA) Inhibition (%) Time(h) CTL DRUG CTL DRUG T"
J- N T" IV 5 - 10 llK TTX 5-14 -3.10 -2.65 -5.16 -2.23' 14.3 51.3* 2.0 ±0.41 ±0.48 ±0.97 ±0.44 ±11.3 ±7.8 ±2.5 (9) (9) (9) (9) (9) (9) (8) 24-36 -3.34 -2.71 -4.49 -0.41* 11.6 91.5*' 4.5 ±0.72 ±0.48 ±0.55 ±0.28 ±5.7 ±7.5 ±3.3 (10) (10) (10) (10) (9) (10) (9) 100 - 200 /jlM TTX 5-36 -2.64 -0.04' -4.85 -0.25* 95.5* 97.0* 90.6* ±0.64 ±0.19 ±1.41 ±0.29 ±6.0 ±12.5 ±1.7 (7) (7) (7) (7) (6) (7) (12)
The data are expressed as means ± SEM (n) . I"p and are referred to maximum Na currents. *; the block of Na currents was statistically significant. §: the change of the inhibition of I"p with the âge of cells in culture was statistically significant. For the absolute current amplitude, the statistics were done by comparing under DRUG (TTX) against under CTL (control) . For the inhibition (%), the statistics were done by comparing the reduced percentage against the theoretic zéro percentage.
•D 2; SI
Inhibition
of
Maxiinum
(%
)
W
I—• 8 0 1Maximum
of
Steady
State
I^a
(p
A)
^
U) o O O t- H -H O O3
O H H A-XFigure 3-2 Inhibition of 1^, by high TTX concentrations
(100-200^M) . A: Influence of TTX on peak amplitude of I"Na*
Results from A expressed as % inhibition together with the
effect of high TTX concentrations on the experimentally
determined transient current. 1"^ and I"p: maximxam current of
négative and positive peeik respectively; I'^n»- transient
current. The symbol * indicates a statistically significant différence with respect to control.
1 U) oo- o
Steady
State
Na
Current
(pA)
U> VO K3 t-n OO J I I I I I WNa
Current
(nA)
S CDI
■-1 p 3 m i-d o r-t- a 3 p'I
ON- O \ to- o o-• □ ■ II H n ■ H □ ><! to o oB
w K)s
vo o <: < NJ O < en o L/1Figure 3-3 Effect of high concentrations of TTX on
Influence of TTX (lOO^M) on 1^, in A and of 200^M TTX on I"^,
in B. Inset in A represents puise protocol. Note that ail
3.2.2 TTX sensitivity and its change during time in culture
The TTX sensitivity of was tested in this study to see
whether the current(s) underlying the complex cvirve was
a TTX sensitive Ijj, and whether there was a differential TTX
sensitivity of the 2 peeiks in the I-V relation of The
results are sximmarized in Table 3-2. A high concentration of
TTX (100-200^M) practically abolished both peaks in the I-V
relation of I"jj, together with the transient current (Figs.3-2 and 3-3) and the effect was indépendant of the time dviring
which the cells wère cultured. This resuit showed that a
steady state Na current was underlying the 2 peaks of I"n,.
Moreover, earlier studies also showed that Ijj, in the newborn rat ventricle had a relatively low TTX sensitivity (Fermini
and Schanne, 1991) when compared with that of other species. In addition, the TTX sensitivity of was also lower than
that of the adult rat ventricle where 30/tM TTX are sufficient
to completely abolish (Brown et al., 1981b).
To test for a differential TTX sensitivity of 1'^»/ a
concentration of 5 to lO^M TTX was used. Table 3-2 shows that there was a significant decrease in the amplitude of the
positive peak whereas the négative peak did not change, Figs.3-4 to 3-7. In addition, the sensitivity of the positive
s m 3 cr 3 3 n> a> 3 S' 3 N) • O O
-Steady
vState
Na
Currenl
(pA)
t •ptS
m\
4'
or" o .a î.J
"D N) , O M J_ □ ■ H n _} o >-y /—N 7^ •p-O X \—' àlNa(pA) ètf
"
1
:/
w
00Na
Current
(nA)
(O H H X o o X H ■-o 7^ O 00 t-o <: < SJ o < K) O oFigure 3-4 Effect of low concentrations of TTX on 1^. in cells
cultured < 14h. A: Ten TTX did not inhibit the transient current of cell J960312C, cultured for 7h. Inset: puise protocol. B: Ten /^M TTX depressed the positive peak and left
the négative peak of the steady state current unchanged.
< o C3 -r-J 00 >-, T3 Cu o +-) 00 o e
■I
a -3- -6-JSS N TSS i tX
T
CONTROL TTX, CONTROL TTXB
n <n C .2 'rg :)0 R' 1 X". îxaFigure 3-5 Inhibition of 1^, by low TTX concentrations (5-lO^M)
in cells cultvired < 14h. A: Influence of TTX on peak amplitude of l'V. B: Results from A expressed as % inhibition together with the effect of low TTX concentrations on the
experimentally determined transient current. I"^ and I"p:
maximvim current of négative and positive pecik respectively; transient current. The symbol * indicates a statistically significant différence with respect to control.
Steady
State
Na
Current
(pA)
^
Na
Current
(nA)
N) O oo o □ H O H Q o O1
t-■v
I3
h
AiNi (pA) U) o U> A E ë A>- i. O M ~ O -o o H H X "73 00 O o < to o < NJ O o>
Figure 3-6 Effect of low concentrations of TTX on 1^, in cells
cultured > 24h. A: Ten TTX did not inhibit the transient
current of cell J960313T, cultured for 29.5h. Inset; puise protocol. B: Ten fiM. TTX depressed the positive peak considerably more than in cells cultured < 14h but left the
négative peak of the steady state current unchanged, please
compare this panel with Fig.3-4B. Inset: Différence current. Cell J9603130 cultured for 28h.
Inhibition
of
Maximum
(%)
Dd
"S 2 O IMaximum
of
Steady
State
d^ UJ o Q 2; H O r Hh:
H X o oh
153 O r H H 3f XFigure 3-7 Inhibition of 1^, by low TTX concentrations (5-lO^M) in cells cult\ared > 24h. A: Influence of TTX on peeik amplitude
of I"n.. B: Résulta from A expressed as % inhibition together with the effect of low TTX concentrations on the
experimentally determined transient current. I"jj and I"p:
maximxim current of négative and positive peak respectively;
I\,; transient current. The symbol * indicates a statistically
cultxired for more than 1 day when compared with those < 14h in cultiire, Figs.3-5B and 3-7B. Moreover, the peak transient
current did not change in low TTX concentrations. Table 3-2, Figs.3-4A and 3-6A. These results support the following
concepts: i) there are 2 components of the steady state Na current that peak at négative potentiels (I"n) and at more positive potentiels (I"p) respectively; ii) the experimentally
measured transient cvirrent is associated with because they are both insensitive to low TTX concentrations; and iii) the
I-V relation of 1"^ and I"p have the bell-shape of a typical window current (Attwell et al., 1979; Cohen and Lederer, 1987) suggesting that in neonatal rat ventricular myocytes the Na
current may consist of the sum of 2 isoforms of the Na channel, each exhibiting its distinct transient and window
current, see Equs.(3) and (4).
In addition to the analysis on I"n,, I\, was also
quantitatively studied to see whether there is evidence for the existence of a second component of the transient current.
3.3 Transient Na currents
In the first part of this section, the examination of the
voltage control quality during 1''^» measurements will be presented. Then the quantitative analysis of l\, will be
developed in the second part of the section.
3.3.1 Voltage control
In the laeasurements of IV»/ the quality of voltage
control was verified using 2 différent approaches. First the
time coxirse of the activation of 1^, was analyzed and then the
measurements were subjected to accepted criteria for adéquate
voltage control.
In 5 cells which had a peak 1^. > 3.5nA, 1^. was measured after conditioning puises to -120iiiV that resulted in a full
peak current and to a voltage level (-70mV) that resulted in
a reduced peak 1^,. In Fig.2-6B, representing h^, the relation between the peak 1^. and the conditioning potentiel was shown. The reduced current at -70mV where h„ is almost 50% of the luaximvun, was then scaled up to the full peak current, Fig.3-8. In ail cells the time to peak and the time course of activation coincided in the trace of full peak current and in the scaled current trace indicating acceptable voltage control in this work. The slowing down of the inactivation in the scaled current trace does not argue against good voltage control because the slowing down of the time course of inactivation dépends on the conditioning potential (Dudel and Rûdel, 1970; Patlak and Ortiz, 1985; Grant and Starmer, 1987).
0
1
«a
-2
G3 2 -4--70 —V
-120 50ms HP■j(\
200ms
-120 210Time (ms)
-lOmV I 220B
0-< Gë
Ô-2-j
cC :z; 1 t 1 r L 1 210Time (ms)
220Figure 3-8 Transient currents elicited in the senne cell from a conditioning potential of -120 (continuons line) and -VOmV (dotted trace). A: Original record, inset puise protocol. B:
After scaling of the smaller current. Note that the activation
phase and the time to peak of the scaled record coincide with that of the current recorded from a conditioning potential of
A graduai smooth increase of the négative conductance branch of the I-V relation over a potential range of about 40mV is recognized as an empirical critérium for acceptable voltage control (Bodewei et al.,1982; Brown et al., 1981a,b; Colatsky and Tsien, 1979). Table 3-3 shows a mean voltage range of activation of 36mV (différence between and Th) that, in the other way, suggests an acceptable voltage control. Another more strigent critérium established for cardiocytes derived from Purkinje fibers postulâtes a slope factor > 6mV for as an indicator of good voltage control (Hanck and Sheets, 1992). As shown in Table 3-4, the mean
value of m^<„ was 7.8 and 5.1mV for cells culture < 14h and >
24h respectively and these results point equally to acceptable voltage control in the measurements in this work in spite of
the application of a physiological [Na]„ to increase the driving force for
I"n«-3.3.2 Analysis of I'Ni
In this subsection the analysis of the relation will first be discussed, followed by the examination of the steady state activation and inactivation. Finally the analysis of the inactivation phase of will be presented.
200ms