HAL Id: hal-00465789
https://hal.archives-ouvertes.fr/hal-00465789
Submitted on 21 Mar 2010
HAL is a multi-disciplinary open access archive for the deposit and dissemination of sci-entific research documents, whether they are pub-lished or not. The documents may come from teaching and research institutions in France or abroad, or from public or private research centers.
L’archive ouverte pluridisciplinaire HAL, est destinée au dépôt et à la diffusion de documents scientifiques de niveau recherche, publiés ou non, émanant des établissements d’enseignement et de recherche français ou étrangers, des laboratoires publics ou privés.
Survey of the main databases providing solar radiation
data at ground level
Sylvain Cros, Lucien Wald
To cite this version:
Sylvain Cros, Lucien Wald. Survey of the main databases providing solar radiation data at ground level. 23rd EARSeL Annual Symposium ”Remote Sensing in Transition”, Jun 2003, Ghent, Belgium. pp.491-497. �hal-00465789�
Cros S., Wald L., 2003. Survey of the main databases providing solar radiation data at ground level. In Proceedings of the 23rd EARSeL Annual Symposium "Remote Sensing in Transition", 2-4 June 2003, Ghent, Belgium, Rudi Goossens editor, Milpress, Rotterdam, Netherlands, pp. 491-497
Survey of the main databases providing solar radiation data at the ground
level
S. Cros & L. Wald
Remote Sensing and Modeling Group, Ecole des Mines de Paris, France
Keywords: solar radiation, database, information system, climatology
ABSTRACT: Solar radiation at ground level is a necessary input for several applications such as primary production and agronomic related studies or potential solar energy assessments. The user needs consist gener-ally in values of global daily or hourly irradiation with a spatial resolution of approximately 10 km. Relative errors (RMSE) of daily irradiation should be less than 20 %. Spatial coverage (continent) and temporal cover-age are of importance. The data must be available conveniently at low cost. Several regional solar atlases have been made by interpolation of ground measurements, taking into account the local variation of climate. Satel-lite data produce irradiation maps offering a regular sampling in space and a wide geographical coverage. Time-series are also obtained by weather forecast models. Digital atlases have been created as integrated in-formation system. They comprise a database and software to exploit it. The co-operative systems are con-nected with other servers that provide necessary weather data to compute solar radiation quantities. This sur-vey of solar databases showed that in a general case, there is a discrepancy between users needs and available databases. This conclusion supports the efforts made in integrating information systems and co-operative sys-tems to overcome the technical limits of measurements by using the information and communication technol-ogies.
1 INTRODUCTION
Incident downwelling solar radiation at ground level is a key input for several applications. Solar energy engineering, optimization of daylight use in building applications, biomass production and crop forecast, oceanography and limnology applications and urban air quality studies or even the sizing of space borne sensors are among the various domains needing so-lar radiation information.
Researchers and engineers are facing the problem of solar radiation data retrieving on land or on ocea-nic surfaces. Their needs consists generally in values of hourly or daily global irradiation and its derived quantities (diffuse component, spectral distribution, spatial structure of the radiation) for various part of the world. Accordingly, databases should be availa-ble that cover the whole Earth surface for several years. These data should be available in a high spa-tial resolution (about 10 km in size) with a relative accuracy of 20 % in root mean square error (RMSE)
for the daily irradiation. The data should present a convenient and low cost access.
The access to the relevant information is poor for many reasons. The number of stations measuring ir-radiation is too small to achieve an accurate world-wide coverage. Access is generally complicated by the various type of data, various storage standards, various units, various way of expressing time … Space and time characteristics of presently available data are often unsatisfactory. Most often, raw mea-surements stored and supplied by the present data-bases are not matching to actual users needs.
Nevertheless, efforts have been made to collect, store and disseminate such information with respect to the user needs.
This paper presents a survey on the main possibil-ities offered for retrieving solar irradiation values at ground level. This study has been performed by ana-lyzing different information sources of focused data and their characteristics having major interest to us-ers.
2 SOLAR RADIATION RETRIEVAL FROM GROUND MEASUREMENT STATIONS 2.1 The world radiometric network
Solar radiation is measured by ground networks of measuring stations. Well controlled measurements have only been available in a limited number of sites, and since the middle of the 20thcentury or so. Various types of data are measured: sunshine dura-tion, cloudiness, global irradiation and more rarely its diffuse and direct components, spectral distribu-tion etc. Ground based measuring networks have been established but investments and maintenance costs for each site are of importance. Consequently, national networks often comprise only few stations, even in Western Europe and Northern America. In other parts of the world, measures are more rare. Oceanic surfaces are almost totally deprived of measures sites.
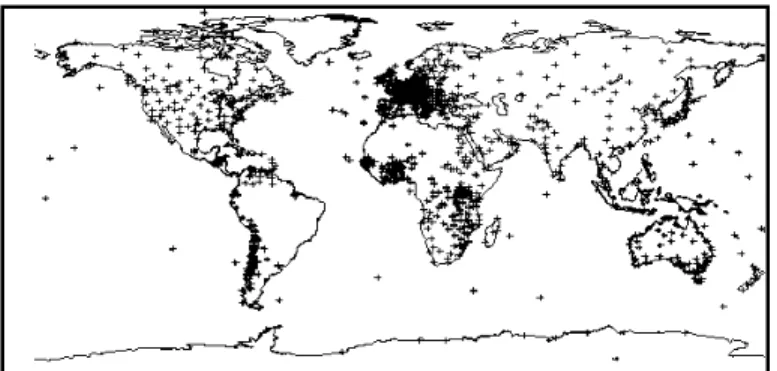
The exact number of stations measuring irradia-tion throughout the world depends on sources of in-formation. Stations belonging to a national network are not necessary part of the World Radiation Net-work supervised by the World Meteorological Or-ganization (WMO). According to the list of stations available from the WMO in May 2002, there are 10930 measuring stations, of which 2900 measure the sunshine duration and 751 the global irradiation. Between 1966 and 1993, 1195 stations were measur-ing the sunshine duration and the global irradiation (WRDC/WMO). As shown in figure 1, the spatial distribution of stations is strongly heterogeneous through the world.
Figure 1. The World Radiometric Network for the period 1966-1993 (source WRDC)
One can see that regions are better covered than others. The network is very dense in Western and Central Europe and Japan. The coasts of Australia are well covered but not the inland. There are large parts of the world that are mostly unknown.
Estimation of the solar irradiation at each point of a zone needs consequently to proceed with interpola-tions or extrapolainterpola-tions of measurements. This me-thod induces some errors due to the distance be-tween two stations. Climatic zones difference between measurement sites is also a source of errors.
Several studies have been performed to retrieve solar radiation by this way (Hay 1981, 1984; Hay, Hanson 1985; Perez et al. 1997; Supit 1994, 1998; Zelenka et al. 1992). It was shown that daily values measured at a station may be considered valid in an area of 30 km of radius. The validity area of a daily measurement is taken as a square of 0.5 degrees (ap-prox. 60 km) in size. If we limit ourselves to the land masses (30 % of the Earth surface), and assuming that the 751 stations were equally distributed (which is wrong as shown in the map on figure 1), the prob-ability of being in the vicinity of a station is equal to 1 %. In other terms, in 99 % of cases, the stations are too far to deliver an accurate information to users. Considering only Western and Central Europe, out-side Scandinavia, the number of stations is large: 2030 stations, of which 214 are measuring the global irradiation and 890 the sunshine duration. In that case, the probability of being in the vicinity of a sta-tion amounts to 7 %. That is 93 % of sites are too far from stations.
These numbers should be considered with care. In many countries, more radiometric stations are avail-able than those reported to the WMO. For example, Germany and United Kingdom total more stations than the 214 reported above for Europe. In addition, parallel networks exist, e.g. for agriculture or hy-drology purposes, that are unknown to the WMO and not managed by the weather bureaus. Their data are usually available to other users. However, it re-mains that the density of the networks is too small for the delivering of accurate data according to users needs.
2.2 Access to the data
Getting the data physically is not always simple. They are usually provided by the weather bureaus in each country. Sometimes, centralized access is poss-ible. For example, the World Radiation Data Center (WRDC) offers an on-line access to archived data for many countries.
Measurements are most often made on a daily ba-sis and not hourly baba-sis, except for a limited number of countries. Users should find models that synthes-ize hourly irradiation from a daily irradiation. These models call upon statistical knowledge on the hourly profile that is not available at most stations and should be inferred from other stations performing hourly measurements. A good point is that long se-ries of records are most often available in stations.
Another good point is that data are in digital form, even for the past years which have been digi-tized. The accuracy is excellent if the instrument is well maintained.
Access is further complicated by the various types of data (hourly or daily measurements, global and diffuse irradiation, sunshine duration) that are available for the countries of interest. If collected in several countries, these data have various storage
standards and various units (e.g., J/cm2, J/m2, Wh/m2, cal/cm2). Various ways of expressing time (coordinated universal time, mean solar time, true solar time, local time) are used. A standard exists within the WMO for defining hourly measurement: the hour allotted to the data is the end of the measur-ing period (e.g., data at 12h is the measurement made between 11 and 12h). It is not always the case in other networks, where the hour may be the begin-ning of the measuring period or the middle of the pe-riod.
2.3 A particular case : the Baseline Surface Radiation Network
The Baseline Surface Radiation Network (BSRN) is a project of the World Climate Research Pro-gramme (WCRP). It aims at detecting important changes in the Earth's radiation fields which may cause climate changes. At a small number (less than 40, see figure 2) of stations in contrasting climatic zones, covering a latitude range from 80°N to 90°S, solar and atmospheric radiation is measured with in-struments of the best accuracy available and at a very high (minutes) frequency. The radiation data are stored together with collocated surface and up-per-air observations in an integrated database.
Figure 2: The Baseline Surface Radiation Network (May 2002)
3 SOLAR RADIATION SATELLITE-DERIVED ASSESSMENTS
Several initiatives are operationally producing as-sessments of the global radiation at ground level for large geographical areas. Satellites are routinely ob-serving the Earth; their data may be processed to provide estimates of the global irradiation. Large geographical regions are such covered and the irrad-iation is known at every location within these re-gions. These maps offer a regular sampling in space (pixellated form). The size of the cells varies and ranges from 1 km to 300 km. Time-series originate from 1980 approximately. The situation varies de-pending upon the source of information.
The relative accuracy (relative rms) of such as-sessment of daily irradiation is approximately 20 %.
The bias is usually very small. Compared to the models based on cloud cover or sunshine duration, the accuracy seems to be similar in regions with very dense radiometric networks (Perez et al. 1997; Ze-lenka et al. 1992). In other parts, while the accuracy of the models degrades with usually an increase in bias, that of satellite-derived assessments remains the same.
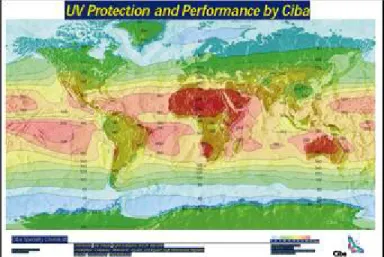
Probably the most known of these initiatives is the ISCCP program (International Satellite Cloud Climatology Project) and its brother, the SRB (Sur-face Radiation Budget) program which freely pro-vide maps of the monthly-averaged daily irradiation for the entire world on cells of 280 km in size. These satellite-derived maps offer a knowledge of the radi-ation at any site in the world. The SRB data are of easy access and are delivered by the NASA (Figure 3). They are monthly means of daily irradiation, available for several years and covering the whole world.
Figure 3. Example of information that is available for the whole world derived from the NASA Surface Radiation Budget project. This is the annual irradiance (energy flux). Units are kLangley. Values are to be multiplied by 1.33 to obtain W/m2. Copyright CIBA.
The NASA Surface Solar Energy Data Set is de-rived from the SRB data set and intends to serve so-lar energy purposes. Figure 4 is an example of the maps that can be obtained through this server for Brazil. The spatial description is coarse due to the large size of the cell.
Figure 4. Example of output of the NASA Surface Solar Ener-gy Data Set server. Map of the ten-years average of the monthly mean of daily irradiation for January for Brazil, ex-pressed in kWh/m2. Note that the displayed units (kWh/m2/day) are incorrect.
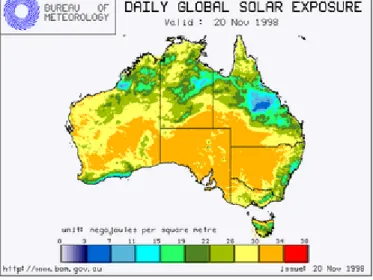
Apart from these international programmes and the NASA programme, several weather bureaus are performing routine processing of satellite images to derive hourly or more frequently maps of irradiation over large areas. These data are used for weather forecasts and can be delivered to users. Australia, France, Germany, Hungary or United States are known weather bureaus offering products of high quality. Australia delivers such information free of charge on Internet (figure 5). The spatial resolution of the maps is better than those provided by the in-ternational programmes. The spatial distribution of the radiation is much more detailed.
Figure 5 Example of output of the Australian Global Solar Radiation Archive server. This is a map of daily irradiation for the 20th
November 1998, derived from satellite images. Units are MJ/m2.
Such maps are more than nice pictures. They show the spatial distribution of the solar radiation at ground level. They demonstrate the relationships be-tween the radiation and latitude, geographical fea-tures and orography.
Apart from the weather bureaus, several initia-tives established databases that can be accessed to by customers, on a free basis or at moderate costs. The Satel-Light server delivers information of statis-tical type (i.e., cumulative frequencies) for Europe. The server of the University of Siegen (Heidt et al. 1998) provides global hourly irradiation over Eu-rope. The SoDa server offers time-series of daily ir-radiation over Europe, Africa and the Atlantic Ocean.
Several servers deliver maps of irradiation. How-ever, these maps cannot be integrated in the soft-wares used for modelling the solar systems, except integrated information systems. It follows that most servers propose an access to their satellite-derived databases under the form of time-series for a given location.
4 RE-ANALYSES OF WEATHER FORECAST Models for weather forecasts are used in a re-analysis mode to reproduce what was effectively ob-served. The global radiation, called downward shortwave radiation in such models, is one the mod-elled parameters. It is usually expressed as irra-diance (energy flux, W/m2) instead of irradiation (energy, J/m2). Models may deal with the whole world or be of regional impact. The grid cell is
ap-proximately 1 – 2 ‚. Daily values are usually offered. Time-series originate from 1960 approximately.
The SoDa server offers an access to the global daily irradiation derived from the outputs of the NCEP/NCAR re-analyses together with other meteo-rological parameters.
5 INTEGRATED INFORMATION SYSTEM An integrated information system is a database com-pleted by a software. Digital atlases have been re-cently created which are more relevant to the field of renewable energies. Presented on CD-ROMs or on-line through the web, they comprise a database (maps, time-series of ground measurements, synthet-ic reference years, geographsynthet-ical information...) and software to exploit it (user interface, data manage-ment, result presentation, import-export capabili-ties...). The software also includes models for the computation of parameters of higher level such as direct and diffuse components or spectral distribu-tion of irradiadistribu-tion or photosynthetically active radia-tion (PAR).
5.1 Meteonorm
Meteonorm (2000) is a digital solar atlas pre-sented on CD-ROM. It contains a database of ground stations measurements made by a combina-tion of several databases from different parts of the world (Swiss meteorological institute, GEBA, WMO …). The main period of the measurement is from 1961 to 1990. Other climatological data useful for renewable energy engineering are also available (temperature, humidity, wind speed, precipitation).
The software included in this atlas permits to re-trieve radiation data by a model of interpolation. It contains also algorithms to calculate radiation on in-clined surface. Radiation data provided by this tool are available in various units according the user need.
5.2 Satel-light
The European Union funded Satel-Light project offers a database of solar radiation data derived from
satellite images, which can be accessed through the world wide web and produces value-added informa-tion mostly for daylighting purposes (Fontoynont et al. 1998; Reise et al. 1999). The database covers the European continent for a period comprised between 1996 and 2000.
Though limited to the solar energy domain, these atlases and servers are excellent examples of what can be done to bring to users the information they require starting from basic meteorological measure-ments.
5.3 The European Solar Radiation Atlas (ESRA) This atlas is an instrument dedicated to providing knowledge and aiding exploitation of the solar re-sources across a wide sweep of Europe, from the Urals to the Azores and from Northern Africa to Po-lar Circle. The input data are based on the period 1981-1990.
This atlas provides a broad overview with sup-porting maps. It starts by describing the course of the Sun across the sky as it varies across the year with geographical location. Then the interactions of the solar radiation with the atmosphere and its com-ponents (haze, turbidity, clouds, etc.) and the separa-tion of the solar radiasepara-tion into the direct and diffuse parts are discussed. Sixteen colored maps provide data on the monthly mean global, beam, diffuse ir-radiation on horizontal surface and the clearness in-dex for March, June, September and December. The mapped values are averages over the 10-year period 1981-1990. Additionally there are the corresponding four annual maps, also a country-based relief map and a map of ground observing stations used. There are two special maps giving zones of similar irradia-tion and zones of similar biomass productivity.
The CD-ROM contains a database, which offers spatial (every 10 km approximately) and temporal climatic information for different time scales (from climatological means - more than 700 stations - to hourly values - 7 stations). It includes the solar re-sources: irradiation (global and its components), sunshine duration, as well as air temperatures, preci-pitation, water vapour pressure, air pressure for a number of stations. The CD-ROM also contains the software to exploit the database.
The software uses either a “map” or a “station” mode at user choice. In the first case, any geographi-cal site can be designated. In the second mode, only the available measuring stations can be selected. The software includes algorithms covering the following fields: solar geometry, optical properties of the at-mosphere, estimation of hourly irradiation on slope under cloudless skies, estimation of solar irradiation values (going from daily to hourly values, conver-sion from horizontal to tilted surfaces), spectral irra-diance, illuminance, daily mean profiles of tempera-ture and other statistical quantities (central moments, extremes, probability, cumulative probability and
utilisability curves). Graphics can be displayed in two or three dimensions. Applications in solar engi-neering can be handled. A few new algorithms were developed. Among them is a model for the assess-ment of the irradiance and irradiation under clear-sky conditions developed by Page (1995), which was proved to perform in checks by independent au-thors (Rigollier et al. 2000).
Maps are one attractive aspect of the ESRA. Spa-tial interpolation techniques do not lead to satisfacto-ry results for meteorological parameters. For a start, terrain height is so impactive. Hence, maps were constructed only for solar radiation, its components and the clearness index. An innovative method was developed, following the path shown by Zelenka (1994), and based on the fusion of ground-measured data and satellite-derived maps of radiation (Beyer et al. 1997).
The ESRA continues, at enlarged scale, the pre-vious work of the European Commission on solar radiation mapping (Commission of the European Communities, 1984a, b, 1997) and complements similar works in other European programmes, e.g., the European Wind Atlas (Troen, Petersen 1989), the Solar Radiation Atlas of Africa (Raschke et al. 1991). These atlases are on paper only. Compared to them, the ESRA benefits from the advances in in-formation technologies. Databases are available, dig-ital values can be exported, interactivity is every-where, complex computations can be performed. The elevation of any geographical location is em-bedded in the database. In addition, the ESRA offers map capabilities, which are presently unique in solar radiation atlases
The CD-ROM-based atlases have their advantag-es and limitations. Further progradvantag-essadvantag-es in the disse-mination of information on solar radiation and re-sources are expected due to the world wide web capabilities. This approach is already demonstrated by the co–operative information systems.
6 CO-OPERATIVE INFORMATION SYSTEM Such an information system is essentially based on the benefit of an interactivity between different web servers. Information-delivery system is co-operating with other servers that provide the necessary weather data. The two following examples presents clearly the advantages of such co-operation.
6.1 The RETScreen system
The RETScreen system calls upon data from the NASA Surface Solar Energy Data Set. The user is invited to copy outputs of the NASA server and paste them into the input table of the RETScreen software. The RETScreen International Photovoltaic Project Model (version 2000) can be used world-wide to easily evaluate the energy production,
life-cycle costs and greenhouse gas emissions reduction for three basic PV applications: on-grid, off-grid, and water pumping. For on-grid applications the model can be used to evaluate both central-grid and isolated-grid PV systems. For off-grid applications the model can be used to evaluate both stand-alone (PV-battery) and hybrid (PV-battery-genset) sys-tems. For water pumping applications the model can be used to evaluate PV-pump systems.
The RETScreen International Online Weather Database provides users access to weather data from more than 1,000 ground monitoring stations around the world. These data can be "pasted" to the perti-nent cells within the RETScreen software. The data-base is provided free-of-charge and it is accessed di-rectly through each of the 8 software models available for free download from this Website. As an alternative the user can use satellite data, particularly for the case when the project location is not close to a ground monitoring station. The NASA Surface Meteorology and Solar Energy Data Set provides RETScreen users access to satellite derived weather data for the entire surface of the planet. Via a direct Internet link to the NASA website, the user may simply "copy" this data from the NASA Website and then "paste" it into the RETScreen spreadsheets. 6.2 The SoDa web server
The project SoDa is based on the previous expe-rience gained in the realisation of the ESRA product and the servers Satel-Light, Avalanche and SWITCH, and uses it as a springboard to answer customer needs by an efficient use of advanced formation and communication technologies. An in-tegration of information sources of different natures within a smart network is realized (see online at http://www.sois.com). These sources include da-tabases containing solar radiation parameters and other relevant information. Several of these databas-es originate from an advanced procdatabas-essing of remote sensing images. Several were available separately and the SoDa Intelligent System builds smart Inter-net co-operation between sources. The information sources also include application-specific user-oriented numerical models and advanced algorithms. The system is being validated through users trials. The project SoDa focuses on several applications: energy-conscious building design, daylighting, vege-tation, environment, climate change, oceanography, health and industrial use of renewable energies.
7 CONCLUSION
In the most of cases, accuracy of solar radiation in-formation available is not that expected by users. Nevertheless, solar radiation data at the ground level are retrievable by a diversity of tools. Ground station measurements are far from being the only answer to
the user needs. Real efforts have been performed to provide irradiation values in various part of the world in a satisfactory way. Satellite-derived as-sessments represent an accurate solution for the mapping of the solar radiation on a wide geographi-cal area. Moreover, combining measured or assessed data and physical models permits a convenient access to the information. Co-operation between several sources of information provides fruitful re-sults. Efforts made in integrated information system and co-operative system have to be supported to overcome the technical limits of measurements by using the information and communication technolo-gies.
REFERENCES
Avalanche: http://www.ret-market.org
Australian Global Solar Radiation Archive: http://www.bom.gov.au
Beyer H.-G., Czeplak G., Terzenbach U., Wald L., 1997, As-sessment of the method used to construct clearness index maps for the new European Solar Radiation Atlas (ESRA).
Solar Energy, 61, 6, 389-397.
BSRN (Baseline Surface Radiation Network) http://bsrn.ethz.ch/
ESRA (European solar radiation atlas), 2000, includ. CD-ROM. Edited by J. Greif, K. Scharmer. Scientific advisors: R. Dogniaux, J. K. Page. Authors : L. Wald, M. Albuisson, G. Czeplak, B. Bourges, R. Aguiar, H. Lund, A. Joukoff, U. Terzenbach, H. G. Beyer, E. P. Borisenko. Published for the Commission of the European Communities by Presses de l'Ecole, Ecole des Mines de Paris, France.
Fontoynont M., Dumortier D., Heinemann D., Hammer A., Ol-seth J., Skartveit A., Ineichen P., Reise C., Page J., Roche L., Beyer H.G., Wald L., 1998, Satel-Light: a WWW server which provides high quality daylight and solar radiation da-ta for Western and Central Europe, In Proceedings of the
9th Conference on Satellite Meteorology and Oceanogra-phy. Published by Eumetsat, Darmstadt, Germany, EUM P
22, 434-435.
Hay J.E., 1981, The mesoscale distribution of solar radiation at the Earth’s surface and the ability of satellites to resolve it, In Proceedings of the First Workshop on Terrestrial Solar
Ressource Forecasting and on Use of Satellites for Terre-strial Solar Resource Assessment, Washington D.C.,
Febru-ary 2-5 1981.
Hay J.E., 1984, An assessment of the mesoscale variability of solar radiation at the Earth’s surface, Solar Energy, 32, 425-434.
Hay J.E., Hanson K.J., 1985, Evaluating the solar resource: a review of problems resulting from temporal, spatial and an-gular variations, Solar Energy, 34, 151-161.
Heidt F.D., Teichmann C., B†chler P., Schulze-Kegel D., 1998, Satellite-based solar radiation data go Internet, In
Proceed-ings of the second ISES-Europe Solar Congress,
Euro-Sun’98.
HelioServe: http://www.helioclim.net
ISCCP - International Satellite Cloud Climatology Project: http://isccp.giss.nasa.gov/
Meteonorm, 2000, Remund J., Kunz S., Lang R., Meteonorm version 4.0, Global meteorological database for solar ener-gy and applied climatoloener-gy, Nova Energie GmbH, Scha-chenallee 29, CH-5000 Aarau, Switzerland.
NASA - SRB. First WCRP Surface Radiation Budget Global Data Sets. Shortwave Radiation Parameters March 1985 – December 1988. CD-ROM, version 1.1, available at NASA Langley Distributed Active Archive Center, Hampton, Vir-ginia, USA.
NASA - Surface Solar Energy Data Set:
http://eosweb.larc.nasa.gov/sse/
NCEP/NCAR Reanalysis project:
http://wesley.wwb.noaa.gov/reanalysis.html
Page, J. K., 1995, The estimation of diffuse and beam irra-diance and diffuse and beam illuminance from daily global irradiation, a key process in the evolution of microcomputer packages for the new European Solar Radiation and Day-lighting Atlases. ESRA Project No. JOU2-CT-94-0305/P0603, Task II Coordinator's Technical Report No. 8 (prepared June 30th, 1995 and revised Aug. 6th, 1995), 37 pp. + 5 pp. of tables. Appendix 1 : Solar elevation functions for estimating cloudless day beam irradiance and daily beam irradiation on horizontal surfaces from the beam transmittance, 12 pp. + 5 pp. of tables. Unpublished note, available from Professor J. Page, University of Sheffield, England.
Perez R., Seals R., Zelenka A., 1997, Comparing satellite re-mote sensing and ground network measurements for the production of site/time specific irradiance data, Solar
Ener-gy, 60, 89-96.
Raschke E., Stuhlmann R., Palz W., Steemers T.C., 1991,
So-lar Radiation Atlas of Africa, A.A. Balkema Ed.,
Rotter-dam, Brookfield.
RETScreen: http://retscreen.gc.ca
Rigollier C., Bauer O., Wald L., 2000 a, On the clear sky mod-el of the 4th European Solar Radiation Atlas with respect to the Heliosat method, Solar Energy, 68 (1), 33-48.
Reise Ch., Fontoynont M., Dumortier D., Heinemann D., Hammer A., Olseth J., Skartveit A., Ineichen P., Page J., Roche L., Beyer H.G., Wald L., Santos A., 1999, SATEL-LIGHT: Einstrahlungsdaten f†r Europa im Internet Tagungsbericht 14. Symposium Photovoltaische
Solarener-gie, Staffelstein.
Satel-Light. http://www.satel-light.com/
SoDa (Integration and exploitation of networked Solar radia-tion Database for environnement monitoring) http://www.soda-is.com
Supit I., 1994, Global radiation. Agriculture series, EUR 15745, European Commission, Office for Official Publica-tions, Luxembourg, 194 p.
Supit I., 1998, A simple method to estimate global radiation,
Solar Energy, 63 (3), 147-160.
Troen, Peterson E.L., 1989, European Wind Atlas. Published for the Commission of the European Communities by Riso National Laboratory, Roskilde, Denmark, 656 pp.
WCRP – World Climate Research Programme: http://www.wmo.ch/web/wcrp/wcrp-home.html.
WMO - World Meteorological Organization: www.wmo.ch WRDC: wrdc.mgo.rssi.ru
Zelenka A., 1994, Combining Meteosat and surface network data: a data fusion approach for mapping solar irradiation.
In Proceedings of the 10th Meteosat Scientific Users’ Con-ference, Locarno Switzerland, 1994, published by
Eumet-sat, Darmstadt, Germany, 515-520.
Zelenka A., Czeplak G., d’Agostino V., Josefson W., Maxwell E., Perez R., 1992, Techniques for supplementing solar
rad-iation network data, Technical Report, International Energy
Agency, # IEA-SHCP-9D-1, Swiss Meteorological Insti-tute, Krahbuhlstrasse, 58, CH-8044 Zurich, Switzerland.