Université de Montréal
Three-dimensional flow structure, turbulence and bank erosion in a Y$00 meander loop
Par Mike Tiiston
Département de Géographie Faculté «Arts et Sciences
Mémoire présenté à la Faculté des études supérieures en vue de l’obtention du grade de M.Sc.
en Géographie
Avril, 2006
p n’, g
.
Université
rI{h
de Montréal
Dïrection des bibliothèques
AVIS
L’auteur a autorisé l’Université de Montréal à reproduire et diffuser, en totalité ou en partie, par quelque moyen que ce soit et sur quelque support que ce soit, et exclusivement à des fins non lucratives d’enseignement et de recherche, des copies de ce mémoire ou de cette thèse.
L’auteur et les coauteurs le cas échéant conservent la propriété du droit d’auteur et des droits moraux qui protègent ce document. Ni la thèse ou le mémoire, ni des extraits substantiels de ce document, ne doivent être imprimés ou autrement reproduits sans l’autorisation de l’auteur.
Afin de se conformer à la Loi canadienne sur la protection des renseignements personnels, quelques formulaires secondaires, coordonnées ou signatures intégrées au texte ont pu être enlevés de ce document. Bien que cela ait pu affecter la pagination, il n’y a aucun contenu manquant. NOTICE
The author of this thesis or dissertation has granted a nonexclusive license allowing Université de Montréal to reproduce and publish the document, in part or in whole, and in any format, solely for noncommercial educational and research purposes.
The author and co-authors if applicable retain copyright ownership and moral rights in this document. Neither the whole thesis or dissertation, nor substantial extracts from it, may be printed or otherwise reproduced without the author’s permission.
In compliance with the Canadian Privacy Act some supporting forms, contact information or signatures may have been removed from the document. While this may affect the document page count, t does flot represent any loss of content from the document.
Université de Montréal Faculté des études supérieures
Cet mémoire intitulé:
Three-dimensional flow structure, turbulence and bank erosion in a 1800meander loop
Présenté par: Mike Tiiston
A été évalué pal-unjury composé des persornes suivantes:
André G. Roy Pascale M. Biron Thomas Buffin-Bélanger
Somniaire
Les boucles de méandre sont des composantes très dynamiques des systèmes fluviaux, et elles peuvent potentiellement éroder les terres agricoles et aussi détruire certaines infrastructures durant leur migration. C’est pourquoi plusieurs techniques de stabilisation des berges ont été développées, de l’utilisation de grosses pierres (“rip rap”) à des mesures plus naturelles se servant de la végétation. Les objectifs de cette étude sont 1) d’investiguer la structure tri-dimensiorninelle de l’écoulement et les caractéristiques turbulentes d’une boucle de méandre de 180 degrés; 2) d’examiner les liens entre la turbulence, la contrainte de cisaillement et le décrochement des berges ; et 3) d’évaluer le succès de mesures de protection des berges utilisées le long d’une boucle de méandre. Des mesures tri-dirnensionnelles de vitesse ont été recueillies à neuf reprises, six d’entre elLes à l’aide d’un courantornètre acoustic Doppler (ADV), et trois grâce à un profileur acoustic Doppler (PC-ADP). Puisque le PC-ADP est un appareil relativement récent, un test de comparaison avec l’ADV a été effectué. Les résultats indiquent que les données moyennes de vitesse d’écoulement étaient semblables, mais que les statistiques turbulentes des deux appareils sont assez différentes en raison du plus grand volume d’échantilllonnage et de la plus faible fréquence d’enregistrement des données du PC-ADP. L’écoulement est caractérisé par des structures turbulentes à grande échelle dans la composante longitudinale de vitesse, qui semblent produire des mouvements cohérents semblables dans les plans latéral et vertical. La zone de vitesse plus élevée à l’amont du méandre décélère en prenant une expansion latérale, et engendre une cellule de recirculation principale ainsi qu’une faible cellule secondaire de rotation opposée près de la berge externe entre l’entrée et la sortie du méandre. La
localisation des zones d’intensité turbulente maximales varie en fonction du débit, avec des valeurs maximales à l’entrée et à la sortie du méandre pour des débits faibles et élevés, respectivement. Différentes méthodes d’estimé des contraintes de cisaillement ont été comparées et, en se basant sur les observations visuelles de transport de sédiments, il a été établi que la méthode d’énergie cinétique turbulente (basée sur les trois composantes de l’écoulement) était la plus adéquate. Des zones d’érosion des berges ont été détectées à l’entrée et à la sortie du méandre, ce qui correspond aux zones de plus fortes contraintes de cisaillement. Durant cette étude, la berge externe de la rivière a été stabilisée en réduisant sa pente et en utilisant de la végétation pour retenir le sol. L’année suivant ces travaux, l’ajustement du cours d’eau s’est effectué par un dépôt massif de sédiments le long de la berge interne. L’entrée et la sortie du méandre ont encore subi des événements de décrochement depuis que les mesures de stabilisation ont été mises en place, mais un suivi à plus long terme est requis pour réellement évaluer le succès de ces mesures.
Mots-clés t méandre, structure de l’écoulement, contrainte de cisaillement, érosion des
berges, stabilisation des berges.
Abstract
Meander loops are one of the more dynamic feature in fluvial systems, and have the potential to erode cropland and destroy infrastructure through their migration. As such, various techniques have been developed to stabilize river banks, ranging from rip rap to vegetative based approaches. The objectives of this study are to: 1) investigate the three-dimensional flow structure and turbulence characteristics of a 1 $0 degree meander loop, 2) examine the link between turbulence, shear stress and bank failure, and 3) gauge the success of bank protection measures taken along the smdy bend. In stream three-dimensional velocity measurements were taken on nine separate suiweying dates, six of which were performed using an acoustic Doppler velocimeter (ADV) and three with a pulse coherence acoustic Doppler profiler (PC-ADP). Since the PC-ADP is a relativelynew sampling device, a test was conducted to evaluate its performance against the ADV. Results indicate that while they produce sirnilar mean flow measurements, their turbulence statistics are quite different, which is the result of the PC-ADP’s larger sampling volume and lower sampling frequency. Flow is characterized by large-scale coherent flow structures in the downstream plane which appear to produce sirnilar coherent motions in the lateral and vertical planes. The flow’s high velocity core upstrearn from the bend decelerates as it expands laterally, develops a main circulation cell and a weaker counter-rotating celI adjacent to the outer bank between the bend entrance and exit. Locations of highest turbulence intensities are stage-dependent, with maximum values at the bend entrance and bend exit for low and high discharges, respectively. Different bed shear stress estimation methods were cornpared, and based on field observations of sediment transport, it was deterrnined that the most accurate
estimates were obtained using the three-dimensional turbulent kinetic energy technique.
Bank erosion itself was localized at the entrance and exit of the bend, which match the locations of maximum shear stress. During the course of this study, the outer bank ofthe chairne] was stabilized by lowering the bank siope and using vegetation to anchor the sou. Over the following year, the chaimel reacted to these measures through a massive sediment deposition event along the inner bank. Whule it appears that the bend entrance and exit have experienced bank failure events since stabilization measures were irnplernented, fiirther monitoring is required to fully gauge its success.
Keywords: Meander loop, flow structure, turbulence, bed shear stress, bank erosion, bank stabilization
A ckizowledgements
I would like to take this opportunity to thank Dr. P. M. Biron, flot only for the chance to study this topic, but also ail tlie guidance slie lias given me while collecting and analyzing the data, and for lier patience witli me and lier lielp in tlie writing of this tliesis. I would also like to tliank tlie government of Quebec, specifically FCAR, for providing me witli the funding to perform this researci. I deeply appreciate the lielp of lim Haltigin, Lara H., Ivan Dolinsek, Bruno Vallée, Tracy LeBlanc, Lisa LeBlanc and anyone else wlio I may have omitted for aiding in the long process of data collection. Finally, I would like to tliank Claire Lemieux of Nature-Action for lier help in finding an appropriate site to perform this tliesis. Tliank-you ail so very much.
Table of Contents
SOMMAIRE III
ABSTRACT V
ACKNOWLEDGEMENTS VII
LIST 0f FiGURES X
LIST 0F TABLES XIV
1. Introduction 1
1.1. Background and Objectives 1
1.2. Thesis Structure 3
2. Literatttre Review 4
2.1. Bank Erosion —Causes, Types and Mechanics of Failure 8
2.2. Dynarnics of Meanders 11
2.2.1. Bed Shear Stress Pattems in River Bends il
2.2.2. Secondaiy Circulation 22
2.3. Bed Shear Stress Estimation 30
2.3.1. Mean FJow Techniques 31
2.3.2. Turbulent Flow Techniques 34
3. MethodoÏogy 41
3.l.StudySite 41
3.2. Data Collection 45
3.2.1. Bed and Bank Topography 45
3.2.2. Bed and Bank Sediments 46
3.2.3. Flow Velocity 48
3.3. Data Processing 54
3.3.1. Instrument Location 54
3.3.2. Velocity Rotation 56
3.3.3. Signal Treatment 59
3.4. Analysis and Presentation 61
4. Restdts 63
4.1 Instrument Evaluation 63
4.1.1 Comparison ofMean f low Measurements 63
4.1.2 Comparison of Turbulence Statistics 67
4.2 Turbulence Dynarnics Across Vertical Shear Layers 69 4.2.1 Large Scale Coherent Flow Structures (PC-ADP) 69
4.2.2 Burst-Sweep Properties (PC-ADP) 76
4.3 Bend Scale Flow Properties 85
4.3.1 Mean Flow Properties (PC-ADP) $6
4.3.2 Turbulent Flow Properties 90
4.4 Bend Evolution 98
4.4.1 Chronology ofChannel Change 99
4.4.2 Evaluation of Techniques to Estimate Bed Shear Stress 103
4.4.3. Bed Shear Stress Distributions in River Bends (ADV) 107
5. Discussion 113
5.1 Instrument Evaluation 113
5.2 Turbulence dynamics Across a Vertical Shear Layer 116
5.2.1 Large Scale Coherent Flow Structures 116
5.2.2 Burst-Sweep Properties 121
5.3 Bend Scale Flow Properties 125
5.3.1 Mean Flow Properties (PC-ADP) 125
5.3.2 Turbulent Flow Properties (ADV) 122
5.4 Bend Evolution 130
5.4.1 Evaluation of Techniques to Estimate Bed Shear Stress 130
5.4.2 Chronology ofChannel Change 132
6. Conclusion 136
List of figures
f igure 1: Plan geometly prior to (a) and following (b) a river straightening project ofthe
Sud-Ouest river (neat St. Césaire) 4
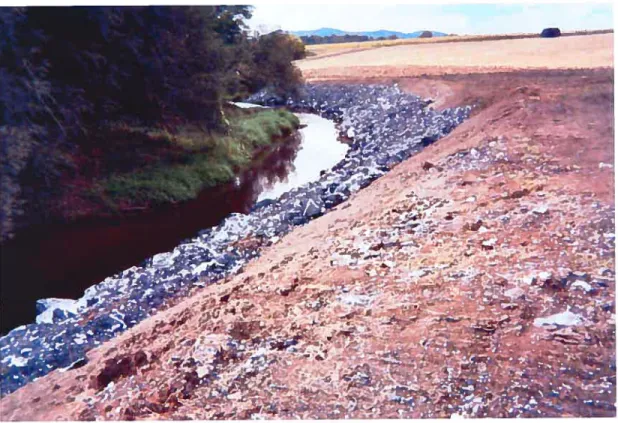
f igure 2: Hard-engineering stabilization technique trip-rap) used in the Petite Barbue
River downstream ofthe study reach 5
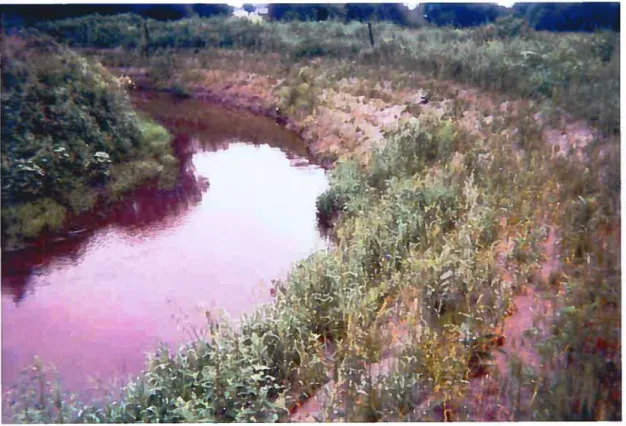
f igure 3: Soft-engineering stabilization technique (using vegetati on) implemented in
June 2003 in the study reach 6
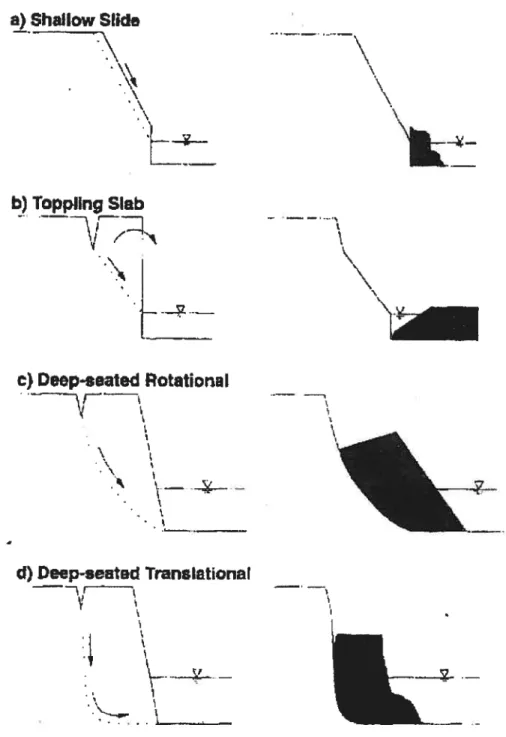
Figure 4: Different modes ofbank failure (Abernethy and Rutherfiird, 1998) 9 Figure 5: Causes and effects ofbank failure (modified from Darby and Thome, 1996). 10 figure 6: Boundaiy shear stress distribution through a meandering river (Knighton,
1998) 12
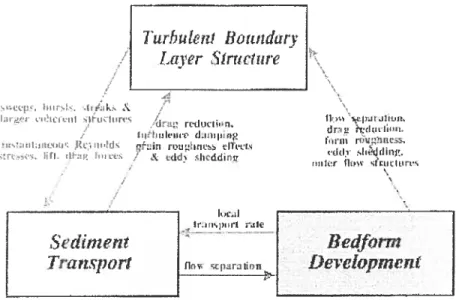
figure 7: Feedbacks between the turbulent boundary layer, bedform developrnent and
sedirnent transport (Best, 1993) 15
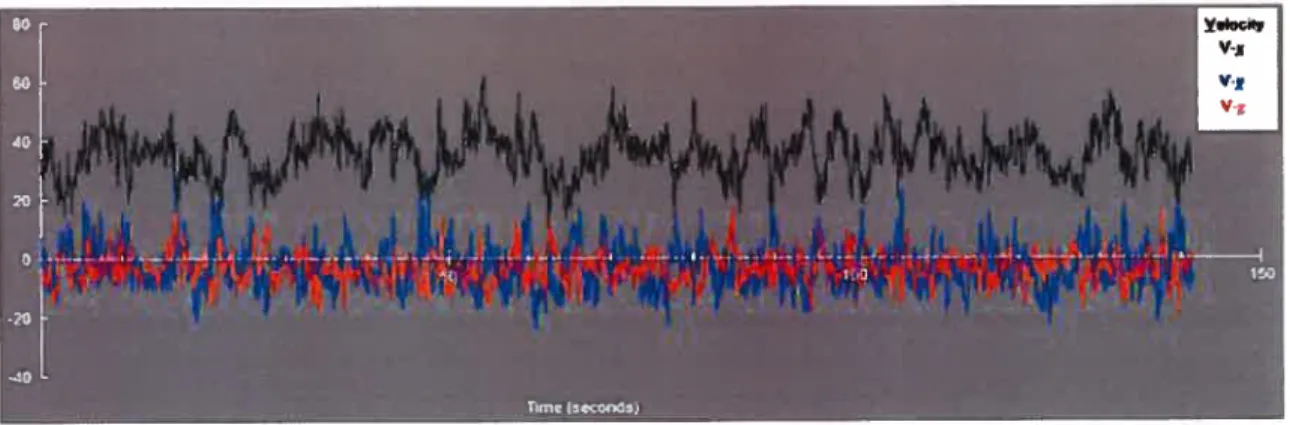
figure 8: Velocity signal ofa turbulent flow where Vx = downstream, Vy lateral and
Vz = vertical flow velocities 16
Figure 9: Burst cycle (Yalin, 1992) 17
f igure 10: (1) Evidence ofrecirculation (negative velocity) zone in dune trough (Beirnett
and Best, 1995). (2) Velocity profiles (circles) over a fixed dune (a) upstream of crest, (b) just downstream of crest une, (c) within center of flow separation, (d) just downstream of reattachment point, (e) rnid-face of subsequent dune and
(f)
just upstream of subsequent dune crest une (Beirnett and Best, 1995) 19f igure 11: Alternating region of high and low speed fluid (Buffin-Bélanger et al.,
2000b) 20
figure 12: Instantaneous (black une) and average (dashed une) velocity profiles (Kim et
al., 1971) 22
f igure 13: Secondary culTents in river bends from Knighton (1 998) 24
Figure 14: Flow recirculation in river bends (Ferguson et al., 2003) 25 figure 15: Effects of upstream geometry on extent of flow separation along the outer
bank (Hodskinson and f erguson, 1998) 30
Figure 16: Quadrant description in a eularian frame ofreference (Roy et al., 1996) 36
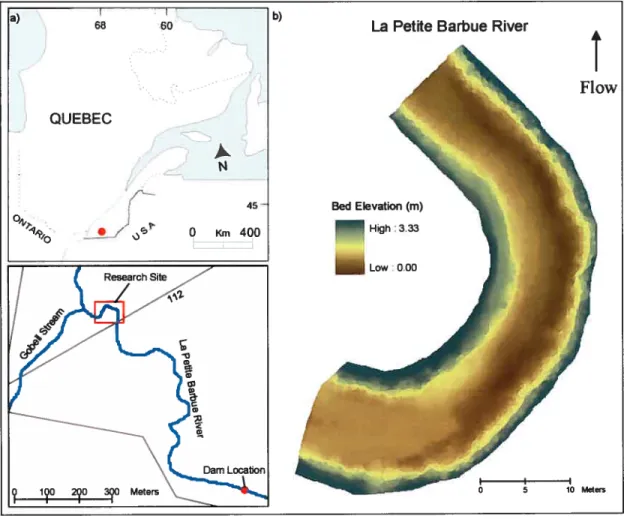
Figure 17: a) Location of study bend, b) Bed topography ofthe study reach 42 figure 18: Examples ofairnual variations in flow stage ta) and discharge (b), based on a
rating curve, at the study bend 43
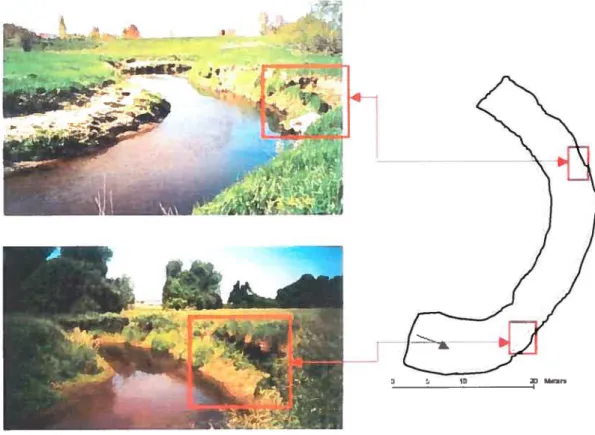
figure 19: Location ofrecent bank failure events 44
figure 20: Leica total station 45
Figure 21: Location of sediment samples 47
F igure 22: a) Sontek acoustic Doppler velocimeter (ADV), b) Sontek pulse-coherent
acoustic Doppler profiler (PC-ADP) 48
figure 23: Frequency shift between emitted and reflected signal (from Sontek manual). 49 F igure 24: Sampling volumes ofADV (a) and PC-ADP (b) 50
Figure 25: Mounting system ofADV and PC-ADP 51
Figure 26: Top view of mounting device (Lane et al. 1998) 52
f igure 27: Location of(a) ADV and (b) PC-ADP samples 53
figure 2$: Flow stages ofADV ta) and PC-ADP (b) surveys 53 figure 29: Location of ADV witb respect to the surveying prisms (Lane et al. 1998) 55 figure 30: Rotation of velocity components into the local co-ordinate system (Lane et
al., 1998) 57
figure 31: Effect of applying Chebyshev (type 1) filter on ta) velocity signal and (b)
power spectrum. Red represents the original signal and blue is the filtered one 60 Figure 32: Locations for evaluating shear stress estimation techniques 62 Figure 33: Three-dimensional velocity profiles obtained with the ADV and PC-ADP in
the areas of main (a) and separated (b) flow 64
Figure 34: Three-dimensional turbulence statistics obtained witb the ADV and PC-ADP
Figure 35: Downstream flow structures identified (via u-level detection technique) using different standard deviations in the areas of main (a) and separated (b) flow
(BÏue=Fast, Red=Slow) 71
figure 36: Laterally oriented flow structures identified (via u-level detection tecimique) using different standard deviations in the areas ofmain(a) and separated (b) flow
(Blue= Outer Bank, Red= limer Bank) 73
figure 37: Vertically oriented flow structures identified (via u-level detection
technique) using different standard deviationsin the areas ofmain ta) and separated
(b) flow (Blue Surface, Red= Bed) 75
Figure 38: Coherent quadrant structures identified in the downstream-vertical plane using different hole sizes in the areas of main (a) and separated (b) flow (Ql=green,
Q2=red, Q3=orange, Q4=bÏue) 77
Figure 39: Quadrant location for downstream-lateral plane 79 Figure 40: Coherent quadrant structures identified in the downstream-lateral plane using
different hole sizes in the areas of main ta) and separated (b) flow (QI =green.
Q2=red, Q3 =orange, Q4=blue) $0
f igure 41: Quadrant location for lateral-vertical plane $2 Figure 42: Coherent quadrant structures identified in the lateral-vertical plane using
different hole sizes in the areas of main (a) and separated (b) flow (Q1=green,
Q2=red, Q3=orange, Q4=blue) 83
Figure 43: Three-dimensional fiow structure at entrance (a) and apex (b) ofthe bend. ..87 Figure 44: Three-dimensional flow structure at entrance (a), apex (b) and exit (e) ofthe
bend $7
Figure 45: Three-dimensional flow structure at entrance (a), apex (b) and exit (c) ofthe
bend 88
Figure 46: Low flow downstream, cross-stream and vertical turbulence intensity distributions in near-surface (a, b and e) and near-bed (d, e and
f)
regions for August 3,2001(1) and July 24, 2002 (2) respectively (interpolation cropped atupstream section due to lack of data) 93
Figure 47: Medium flow downstream, cross-stream and vertical turbulence intensity distributions in near-surface ta, b and e) and near-bed (d, e and f’) regions for May
27, 2003 (1) and July 19, 2002 (2) respectively 95
Figure 48: High flow downstrearn, cross-strearn and vertical turbulence intensity distributions in near-surface ta, b and c) and near-bed (d, e and f) regions for May
15, 2003 (1) and June 19, 2002 (2) respectively 97
Figure 49: Locations of significant topographic change prior to implementing
stabilization measures (July 4, 2002 to May 15, 2003) 100 Figure 50: Locations of significant topographic change resulting from the
implernentation of stabilization measures (May 15, 2003 to June25, 2003). It should be noted that the significant changes along the outer bank are a direct resuit ofthe grade reduction associated with stabilization rather than direct fluvial
erosion 101
Figure 51: Locations of significant topographic change over a 1 year period following the implementation of stabilization measures (June 25, 2003 to May 10, 2004)...102 Figure 52: Comparison of shear stress estirnates at location 1 with ADV ta) andPC
ADP (b) datain the bottom two points ofthe velocity profile. The horizontal fine is the critical stress required to initiate sedirnent transport (0.656 N/rn2) 104 Figure 53: Comparison ofshear stress estirnates at location 2 with ADV data in the
bottom twopoints ofthe velocity profile. The horizontal line is the critical stress required to initiate sediment transport (0.656 N/rn2) 107 Figure 54: Topograpliy (a), velocity (b) and bed shear stress (c) distributions at low flow
(August 3, 2001 (1) and July 24, 2002 (2)) 109
Figure 55: Topography (a), velocity (b) and bed shear stress (c) distributions at medium
flow (July 19, 2002 (1) and May 27, 2002 (2)) 110
Figure 56: Topography ta), velocity (b) and bed shear stress (c) distributions at high
flow (May 15, 2003 (1) and June 19, 2002 (2)) 111
Figure 57: Pairing of downstream flow structures (Fast= Blue, Black outline, Slow Red, Yellow outline) with events in the lateral (Blue = Outer Bank, Red limer Bank) and vertical (Blue= Surface, Red =Bed) planes in the areas of main (a) and
separated (b) flow 120
List of Tables
Table I: General flow characteristics ofADV datasets 54
Table II: Linear regression of mean and turbulent flow properties of PC-ADP versus
ADV data 66
Table III: Surnrnary of average durations and periods for coherent flow structures (identified via u-level detection technique) in the areas of main and separated flow.
72 Table IV: Summary of average durations, periods and intensities for coherent quadrant
structures in the areas of main and separated flow for Vx-Vz 78 Table V: Summaiy of average durations, periods and intensities for coherent quadrant
structures in the areas of main and separated flow for Vx-Vy 81 Table VI: Surnmary of average durations, periods and intensities for coherent quadrant
structures in the areas of main and separated flow for Vy-Vz 84 Table VII: Average near-surface and near-bed turbulence statistics for each dataset 91 Table VIII: Channel areas and volumes prior to (July 4, 2002), irnmediately before
(May 15, 2003), immediately after (June 25, 2003) and 1 year after (May 10. 2004)
the implementation of stabilization measures 103
Table IX: Summary of shear stress values (in N/m2) obtained using various techniques with the ADV and PC-ADP in the region of main (location 1) and separated
(location 2) flow 105
Table X: Effects oftwo methods of temporal averaging on the calculation of turbulence
statistics from ADV data 116
1. Introdttction
1.1. BackgrottndandObjectives
River bends are inberently highly dynamic systems that continuously erode sediments from one bank and deposit them along the other. It is necessary to study meanders since reaches are rarely straight for more that a few tirnes the rivers width. There are many research questions left unanswered due to a lack of consensus as to their dominant ftow structure (Rhoads and WeÏford, 1991), turbulence pattems (Shiono and Muto, 1998; Blanckaert and Graf, 2001), scour distributions (Whiting and Dietrich,
1993a) and hence their evolution.
Although bank retreat in meandering rivers is a natural process, it has become a serious problem throughout North America. It bas been estirnated that of the 3.5 million miles of rivers within the United States, roughly 575,000 miles of their banks are retreating (Biedenham et aÏ., 1997). Since it resuits in the loss of vast amounts of private and public land, a reduction in water quality and sedimentation of rivers, which
can impede the transportation of goods through waterways and degrade wildlife habitat, bank erosion bas severe econornical and environrnental impacts (Piegay et aÏ., 1997).
In order to effectively deal with this environrnental problem, a variety of studies have been perfonned to identify the factors involved in assessing bank instability (Darby and Thome, 1996; Allen et al., 1999; Simon and Collison, 2001). Yet, these studies tended to focus on the mechanics of bank failure itself rather than on the interaction of flow dynamics and bank erosion. A number of empirical models bave been developed and applied to numerical simulators, which have been validated through the use of historical datasets (Jia and Wang, 1999; Wu et aI., 2000). However, these simulations
have been applied to watershed scale situations rather than individual bends. Those which have been applied to reach scale projects have not been validated (Mosselman et al., 2000) or have greatly oversirnplified the process, leading to some questionable resuits (Darby and De]bono, 2002; Darby et aï., 2002). This should corne as no surprise
since the majority of field studies have centered on monitoring erosion rates through the
use of erosion pins (Couper et aÏ., 2002) or historical datasets of aerial photographs
(Gilvear et aï., 2000; Sirnon et aI., 2002) rather than focusing of the hydraulic forces
acting on the chairnel boundaries.
While the aforementioned field techniques are appropriate for watershed scale studies, they are not suitable for studies involving a single meander loop where bank characteristics are relatively homogeneous. Moreover, there bas been a proliferation in
various types of Doppler based technologies in recent years for sampling three dirnensional flow structures, yet there is no consensus arnongst the scientific cornmunity
as to which instruments are appropriate for sampling the mean properties, versus the
turbulence characteristics of a flow. Therefore, the objectives of this study are to: I) Asses the perfonnance of a pulse-coherent acoustic Doppler profiler (PC-ADP) against an acoustic Doppler velocimeter (ADV); 2) Investigate the three-dirnensional ftow dynarnics of a meander loop; 3) Examine the link between turbulence, shear stress and bank failure. This will be accomplished through analyzing a serïes of in-stream three-dimensional velocity datasets and comparing shear stress values with topographie surveys of the river bed and banks.
1.2. Thesis Structure
This thesis has been organized in the following manner: CItapter 2 is an overview of previous studies relating to the three-dirnensional flow structure and bank erosion in river bends. The section begins by identifying the rnechanics of failure and reviewing different rnethods of stabilizing river banks. This is followed by an appraisal of the various steady flow and turbulence based approaches of estirnating bed shear stress. Chapter 3 outiines the mamier in which the data were collected, treated and analysed for this project. It begins by describing the study site and the sampling tecirnique used to collect sediment samples, topography measurements of the channel bed and river banks and three-dimensional ve]ocity. The procedure for evaluating the estimates of bed shear stress obtained by the different calculation techniques is also described. Chapter 4 presents the resuits of the study, which are subsequently discussed in Chapter 5. Finally, Chapter 6 presents the conclusions ofthe swdy.
2. Literature Review
Due to the negative economical and environmental impacts of bank erosion associated with the lateral migration of meandering rivers, and to the ubiquity of these rivers throughout the world, large arnounts of money have been invested into preventing their migration, particularly in North America. Historically, this has been accomplished by dredging the river to create a linear canal (Figure 1). Yet, it is well accepted that
Figure 1: Plan geometry prior to (a) and following (b) a river straightening project of the Sud-Ouest river (neat St. Césaire).
these straightening projects are expensive, resuit in the degradation of riverine ecosystems, and require a significant degree of maintenance to prevent the canal fiom re-meandering (Rhoads and Welford, 1991). As such, engineers cu;ientÏy use less intrusive approaches that are applied locally to prevent chaimel migration. In general, these techniques serve to do one oftwo things: 1) divert the flow away from the banks, or 2) reinforce the chaimel boundaiies.
As the name implies, the aim of diversion approaches is to redirect the high velocity core of the flow away from the banks, thereby displacing the zone ofmaximum
bed scour from the bank toe towards the center of the channel. Traditionally, this is
accomplished by installing hydraulic structures such as dykes and retards along the near bank region of the bed. By contrast, reinforcement approaches serve to reduce erosion rates by armouring the channel boundaries rather than modifying their flow fields. While a variety of materials can be used to create an armour layer, this is normally achieved by placing graded stones, more commonly known as rip-rap, on the bed and banks of the river (Figure 2). Here, larger boulders serve to resist the shear forces of the flow, and are anchored in place by filling their interstitial spaces with smaller cobbles.
Figure 2: Hard-engineering stabilization technique (rip-rap) used in the Petite Barbue River downstream of the study reach.
Yet, much like the case of river straightening proj ects, the hydrologic, ecologic and
aesthetic impacts of these stabilization techniques have caused another fundamental shift towards more environmentally fiiendly solutions (Rinaldi andJohnson, 1997).
Currently, pilot projects are underway in Quebec to determine if the more environmentally friendly approaches of preventing bank erosion do indeed provide a
viable alternative to the more traditional stabilization techniques. Contraiy to the aforementioned “hard-engineering” methods, “soft-engineering” solutions rely on the foot systems ofwater tolerant woody vegetation for reinforcement after the bank siope is reduced rather than rip-rap (figure 3). This is occasionally accompanied by inserting
Figure 3: Soft-engineering stabilization technique (using vegetation) implemented in June 2003 in the study reach.
thick branches into the banks below the water une to slow flow velocity, thereby reducing the shear forces acting at the toe ofthe bank.
Evidently, long-term monitoring projects are required to evaluate the effectiveness of “soft-engineering” techniques against their “hard-engineering” counterparts. However, previous research indicates that vegetative approaches are indeed effective at reducing the frequency of bank erosion events. As noted by Abernethy and Rutherfurd (199$), previous studies indicate bank sediments that are reinforced with foots are up to 20,000 times more resistant to erosion.
While stiil in its infancy relative to liard-engineering approaches, vegetative stabulization metliods are becoming increasingly favoured for a variety of reasons (Lee et aÏ., 1997). Aside from being more aesthetically pleasing, tliey are far less harmful to the ecology of tlie stream and tliey have a minimal influence on ground water flow pattems in tlie surrounding regions, which is especially important for the case of agriculmral areas. Moreover, tlie cost of this method lias been greatly reduced over the past few years from $1 00/m2 to $1 01m2. In Québec, the govemment covers 75% of the cost. Despite these improvements, stabilization projects are stili expensive. Because the migration rate of an unstable reach will vaiy between bends and even within a single meander, tlie elevated costs can be partially rnitigated tlirougli stabilizing only the most dynarnic sections of the river.
Aithougli river bank failure bas recently becorne the focus of intense modelling researci with vaiying degrees of success (Mosselman et aÏ., 2000; Nagata et aÏ.,2000; Duan et al., 2001; Darby and Delbono, 2002; Darby et al., 2002; Lancaster and Bras, 2002; Riciardson, 2002, Olsen, 2003), in situ studies dealing witli tliis process are sparse. Those which focused on determining bank retreat have done so by reconstructing the history of the river througli aerial photography (Gilvear et al., 2000; Sirnon et al., 2002), exarnining a single cross-section over various bends within a reaci, or bave used an aiay of pins to measure retreat directly (Couper et al., 2002). Using these field tecirniques, predictions of bank stability can be made by extrapolating the historical trends of channel migration. Yet, historic sets of aerial photograplis are often incomplete or non-existent for rural areas, and they are rarely at a scale which can be used for this purpose. Additionally, the time constraints of engineering projects prevent
monitoring the river over a period of years. As such, practical stabilization schemes require that predictions of bank erosion pattems are improved by the use of a Newtonian framework that quantifies the forces exerted on the banks by a three-dimensional flow field.
2.1. Bank Erosion — (‘anses, Types and Mechanics offaiture
It is well known that unregulated Canadian rivers are characterized by high flow stages in the spring, moderate levels in the fall and low discharges during the summer and winter months. As suci, regime theoiy dictates that they are constantly evolving in order to strike a balance between chairnel geometry and bed sediments with flow conditions (Chang, 2002). Although this is typically achieved through bed scour in rivers with cohesive bank sediments, this situation is slightly different for the case of regulated rivers. Here, upstream dams prevent the influx of coarse bed sediments, and therefore bank erosion is the primary mechanism by which they react to excessive hydraulic forces. At the reach scale, the increase in sinuosity associated with bank failure reduces the charne1 slope, which decreases the speed and hence the hydraulic forces of the ftow. At the bend scale, failure events increase the cross-sectional area of the chairnel, and the principle of continuity dictates that water velocity, and therefore the shear stress exerted by the flow, must decrease.
In their study of the Latrobe River in south-east river Australia, Abernethy and Rutherfiird (1998) obseiwed that bank erosion is characterized by four types of sporadic, large scale failure events: shallow siides, toppling slabs, deep-seated rotational and deep seated trauslational failures (Figure 4). Shallow slides were rnost common on steep
a) Shalbw SIide b) Toppllng SIab \
I
d) Deep-seated Transiationar Y H -e) Deep-seated Rotational V•.\
\
j
2-.—Figure 4: Different modes of bank failure (Abernethy and Rutherfurd, 1998).
bank faces (>400) where die vegetation’s root system did flot penetrate deeply into die sou. Although they were less common than shallow siides, deep-seated rotational and
translation failures were also common with these bank characteristics, whereas toppling slabs was the dominant mode of failure on low bank sections with steep faces.
However, bank erosion is a complicated process where die frequency of failure events is governed by the planform geometiy (Hodskinson and Ferguson, 199$), flow conditions and sediments ofthe stream (Petit, 1990), as well as local climatic conditions (Simon et aI., 2002). Moreover, bank properties also affect the frequency of failure events since stability is related to the response angle, vegetative coverage and pore water pressure of the bank, as well as the cohesiveness of their sediments and the presence of tension cracks (Darby and Thorne, 1996; Duan et aÏ., 2001; Simon and Collison., 2001). Yet agricultural sites tend to display uniform moisture levels and sedirnent properties along the banks, thereby greatly reducing the number of bank variables involved in the failure process. As such, bank angle is the primary variable affecting stability, which is controlled by the hydraulic forces ofthe flow.
The ]ateral migration rate of river bends is controlled primarily by the extent of scour at the bank toe (Darby and Delbono, 2002) (Figure 5), which is govemed by the balance between bed shear stress and the critical threshold required for sediment entrainment (Petit, 1990). While modelling this phenomenon, Nagata et aÏ. (2000) were
Figure5: Causes and effects of bank failure (moditïed from Darby and Thorne, 1996).
able to identify four key steps in the bank erosion process. First, high shear stresses progressively scour the bed at the toe of the outer bank, which increases the bank angle; then the instability that occurs once a critical bank angle is surpassed causes fallure. The collapsed bank material is then deposited at the front of the bank and transported away from the site of failure. Similar descriptive models have been successfully applied in many other numerical sirnulators (Darby and Delbono, 2002; Darby et al., 2002). Therefore, the shear stress distribution along the bed of a meander loop must be deterrnined as well as the bank angles to predict the pattem of chaimel migration.
2.2. DynamicsofMeanders
2.2.1. Bed Shear Stress Patterns bi River Rends
A fundamental aspect of applied fluvial geomorphology is to predict channel evolution by analyzing the spatial distribution of the resistive and erosive forces within the reach. Although the flow structure and resistive forces along natural rivers can vary greatÏy over the course of a year, a decommissioned upstream dam will flot oniy maintain a relatively constant base-ftow level, but it will also regulate the size of the channel bed sediments. As such, tractive forces and critical shear stresses tend to rernain fairly stable under these circumstances, thereby simplifying the process driving chairnel evolution. Yet even relatively benign variations in discharge can alter the flow dynamics of a reach (Chang, 2002). Given that boundaiy shear stress provides a means of lnking flow dynarnics with sediment transport rates, quanti’ing this variable and examining its distribution along river bends has been the subject of intense research (Dietrich and Smith, 1984; Dietrich and ‘Whiting, 1989: Petit, 1990).
2.2.1.1. Mean Shear Stress
As can be scen in Figure 6, shear stress distributions vaiy both Ïaterally and longimdinally along a river bend. Meanders are characterized by a cross-strearn stress gradient where the highest stress values are found at the toe of the outer bank and
water surface elevation
steadily decrease towards the iirner haif of the chairnel. Furthermore, the values of shear stress in the outer haif of the channel begin to increase upon entering the meander
loop and continue to rise until reaching their maximum value downstream of the bend apex. From their study of a sand bedded meander loop, Dietrici and Srnith (1984)
associated the shift in zones of maximum shear stress to the deflection of the high flow velocity core towards the outer bank. Bedoad transport also shifted following the same trajectoiy as bed shear stress.
The obvious implication of the aforementioned longitudinal pattem of bed shear stress is that river bends must migrate downstream rather than expanding laterally along its axis. While regular trends of migration have been repoiled in numerical simulations of meander evo]ution (Jia and Wang, 1999; Nagata et aï., 2000; Olsen, 2003), natural
Break j bed siope
rivers are unlikely to display such trends due to non-uniforrn bank stability and inegular stress patterns.
In contrast to flume studies and numerical simulation of meander developrnent, the critical failure angle of nafliral riverbanks will vary throughout a reach since their spatially non-uniform sediment composition will affect their stability. Furtbermore, previous research bas acknowledged that shear stress distributions can deviate from those of conceptual models even under simple conditions (Whiting and Dietrich, 1993a; Ferguson et aÏ., 2003).
While analyzing bed development of meanders in a laboratory setting, Whiting and Dietrich (1993a) found that multiple pools tend to develop along the outer banks of large amplitude river bends. Surprisingly, the deepest of these pools was the first one to develop at the entrance of the bend. Running against the work of Leeder and Bridge (1975) who found that maximum velocity and bank erosion rates occmTed in the distal haif of a bend, indicating that this is the site of maximum shear stress, these resuits suggest that the highest shear stress values are located at the bend entrance. W1ile authors postulated that the centrifugal forces created by their bend were flot strong enough to completely dampen the sinuous high flow velocity core as seen in straight reaches (Whiting and Dietrich, 1 993b), similar trends of maximum velocity and bank
erosion occumng upstream of the apex bave been observed in tight bends (ferguson et
al., 2003) and in the upstream loop of a compound meander (frothingharn and Rhoads, 2003). Moreover, multiple pools have been observed in similar flume experirnents with tighter bends (Blanckaert and Graf 2001).
The situation in natural rivers is complicated flirther by the effects of variable discliarge levels on the flow pattern in a channel. Previous studies have clearly demonstrated that part of the reason why the core of high velocity is deflected towards the outer bank of river bends can be attributed to topographic steering effects caused by the point bar (Whiting and Dietrich, 1991). It bas also been established that the degree to which bedforms distort flow structure is directly proportional to their height with respect to water depth (Buffin-Bélanger et aï., 2000a), and similar findings have been noted in studies on the impact of relative step height in river confluences (De Serres et al., 1999). Therefore, flow deflection by point bars should be stronger at low discharge levels, thereby shifting the zone of maximum shear stress towards the bend entrance. foliowing this logic, accurate shear stress measurements must be obtained over a range of flow conditions in order to implernent localized bank protection measures along river bends.
AÏthough many approaches have been developed to calculate bed shear stress, some of these may give unrealistic estimates in complex flow fields. As such, identifying a suitable technique to quantify hydraulic forces in river bends is of great importance.
2.2.1.2. Turbulent Shear Stress
It is now well accepted that turbulence production is an organized and intennittent process that is inherent to ail flows, even in the absence of bed forms and sediments (ex: Kiine et aï., 1967). While point values of turbulence intensity scale directly with flow speed and sedirnent size (Grass, 1971), frequency, intensity and spatial distributions of strong events do not necessarily follow the same trend. Although
several studies have verified the existence of organized and intermittent processes in fluids, there is a large degree of scatter in their resuits on various turbulent properties, such as burst period (Luchik and Tiederman, 1987; Lapointe, 1992). Nonetheless, resuits from laboratory experiments suggest that this process plays a critical role in a range of fluvial processes, especially in terms of bedforrn development and sediment
transport (Jackson, 1976; Williams et aï., 1989; Lapointe, 1992; Best, 1993; Nelson et
aÏ., 1995) (Figure 7).
r
I’urhuien! Btundar Luer iIrueture r- ic I1ï rcd!Kin. I n n..inc Incu LflntJ ny.IIflIi I Ih1 rIill ft
/
& cci hcddini rli/
N
r
—Bedftnrn
——— T;aTPoî
[
dormentFigure 7: Feedbacks between the turbulent boundary layer, bedform developnient and sediment transport (Best, 1993).
While the mean flow techniques of estimating shear stress may be appropriate in designing stable chamels, the aforementioned studies suggest that their ability to assess sediment transport in natural river bends is questionable, especially while under near
equilibrium conditions. In their visualization study along a straight reach, Drakeet al.
(1988) noted that sediment transport ocdulTed in patches that were randomly distributed
being just below the criticai threshold. Given the intermittent nature of sediment transport, Drake et aÏ. (1988) concluded that it was being driven by turbulent structures. Considering that decommissioned dams serve to limit variations in flow stage and sediment characteristics, reaches whose dynamics are controlled by upstream dams are, inherently, under near-equilibrium conditions for the mai ority of the year. Therefore, even slight increases in flow speeds can cause a significant amount of sediment transport; hence it is reasonable to assume that turbulent velocity fluctuations must play a fundamental foie in their evolution.
Conceptually, the instantaneous velocity fluctuations that characterize turbulent flow signais affect sediment mobility since they cause temporal variations in stress levels (Figure 8). Moreover, research on turbulence over the past forty years has
ciearly demonstrated that it is not a chaotic process; rather, it ïs an organized phenomenon consisting of coherent structures operating on different spatial and temporal scales (Robinson, 1991). Through a combination of flow visualization techniques and instantaneous veiocity measurements in a flume study, Falco (1977) demonstrated that turbulent structures can be envisioned as operating on two distinct Figure 8: Velocity signal of a turbulent flowwhereVx=downstream, Vy=lateral and Vz=vertical
flow velocities.
scales: large scale motion of either high or low speed velocity and smaller “typical” eddies superimposed within them. More recently, the presence of these large coherent structures bas been confirmed in natural rivers (Buffin-Bélangeret aï., 2000b; Roy et al., 2004). The characterization of these eddies was of particular importance to the cuiTent understanding of turbulent flows as they make large contributions to the Reynolds stress through the bursting cycle (Kiine et al., 1967; Kim et al., 1970; falco, 1977).
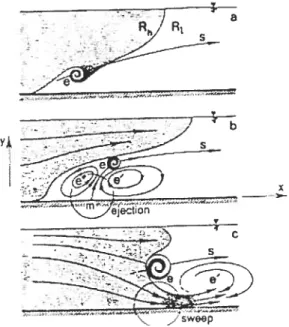
As described by previous researchers (e.g.: Kline et al., 1967; Kim et al,1970) bursting is initiated in regions containing a steep velocity gradient. This imposes a shear force on a volume of ftuid, which generates a Kelvin-Helrnholtz instability, thereby forming an eddy (Yalin, 1992). As the eddy grows, it is ejected towards the overlying higli speed fluid and convected downstream at a rate siower than the mean velocity (Figure 9). As this slow moving eddy travels towards the water surface and decays into progressively smaller vorticities, a high speed sweep of fluid travelling towards the bed enters the region which the ejected fluid once occupied, which completes the cycle.
-, ._wop
Moreover, it has been proposed that bedforms can intensify these large turbulent structures; this was perhaps first proposed by Matthes (1947) after observations on relationship between dunes and bous, which are believed to be the surface manifestation of intense bursting events. As water travels over a dune, it is accelerated up the dune face and the flow becomes separated at the crest and then reattaches downstream of the dune (Bridge and Best, 1988). This pattem is characterized by an intense shear layer separating the overlying high-speed fluid and the underlying separated recirculation cell (Bennett and Best, 1995) (Figure 10(1)), thereby providing the steep velocity gradient required to initiate bursting. As such, this typical flow pattem produces a characteristic turbulence distribution. Bennett and Best (1995) found maximum downstream turbulence intensities at and just beyond the point of flow reattachrnent, and to a lesser
extent within the flow separation celi; by contrast, maximum vertical velocity fluctuations are located in and above the shear layer, and in the region that advects and diffuses downstream (Figure 10(2)). The Reynolds stress was also maximised in the shear layer, which is dominated by intense shedding activity, whereas the point of ftow re-attachrnent and the dune crest contained strong and frequent high speed, bed oriented structures. Similar flow structure and turbulence Reynolds stress distributions have also been noted over dunes by other researchers (Bridge and Best, 1988; Best, 1993), as well as in a flurne study over a backwards step (Nelson et aÏ., 1995), indicating that such frends are flot unique to dunes, but rather tend to occur in regions with rapid changes in downstrearn bed topography that induce flow separation.
1) 2) 0.010 E 0) 0) > o 0.001 .0 0.100 C, .0) t 0.010 0.001
Downstceom velocity (n e_1)
Figure 10: (1) Evidence of recirculation (negative velocity) zone in dune tmugh (Bennett and Bcst, 1995). (2) Velocity profiles (circles) over a fixed dune (a) upstream of crest, (b) just downstream of crest une, (c) withm center of flow separation, (d) just downstream of reaftachment point, (e) mid face of subsequent dune and (t) just upstream of subsequent dune crest lime (Bcnnett and Best, 1995).
While the structure of topographically induced turbulence is controlled by the
formation, magnitude and downstream extent of the flow separation zone (Bennett and Best, 1995), it has been postulated that the shear layer displays a flapping motion (Lapointe, 1992), indicating that the spatial distribution of flow separation changes over
0.00
)
000) o O o o o û û û û 8 û û û o o o Q b C 8 8 0 ûO 80 80 80 80 80I
I
d 0 0.2 0.4 0.6 e 0 0.2 0.4 OU f 0 0.2 0.4 0.6time. A possible explanation for this trend is that natural flows display oscillations in their velocity about their mean value (e.g.: Lapointe, 1992; Best, 1993). Research using an array of electro-magnetic cunent meters in a gravel bedded river has provided valuable insight into the macro-turbulent structure of natural flows (Kirkbride and Fergusen, 1995; Buffin-Bélanger et aï., 2000b; Roy et aÏ., 2004). Yhey confirmed the presence of distinct, alteniating zones of high and low speed fluid that was observed by Falco’s (1977) ftow visualization smdy (Figure 1 1); these macro-turbulent structures are coherent throughout the entire flow depth, and could explain the presence of a flapping shear layer over dunes; sirnilar structures have been observed in gravel bed rivers (Buffin-Bélanger et aï., 2000b; Roy et aï., 2004). From these
t V - -______ -- - -— Cl — -V V 50 40 20 15 0 Ç—
Figure 11: Alternating region ofhigh and Iow speed fluid (Buffin-Bélanger et al., 2000b).
observations, Buffin-Bélanger et aï. (2000b) postulated that “typical” eddies, which make the Ïargest contributions to the Reynolds stress, were generated at the interface of these zones of high and low speed fluid where velocity gradients are the highest, thereby
10.5
11
40 :0 20 10
II
Tme s)
initiating the bursting cycle. Yet the angle of this interface was variable, which raises the question on the effects of vertical velocity gradients on turbulence distributions.
It appears as though vertical velocity distributions play a fiindamental role in turbulence generation. In their study of turbulence in a straight flume with a smooth bed and walls, Song and Chiew (2001) found that turbulence intensities were highest in the downstrearn direction, followed by the transverse and vertical components. The Root Mean Square (RM$) of the downstream and vertical components of velocity, as well as the Reynolds shear stress, will decrease from their maximum value at the bed where velocity gradients are the largest, to their minimum value at the water surface in a linear manner. The spanwise component followed a similar trend, but started to decrease in the near-bed region. Other flume (Song and GraE 1994) and in situ (Sukhodolov et aï., 1998) studies revealed similar trends for the RMS of velocity fluctuations, altliough the latter displayed far more scatter, presumably due to the influence of complex bed topography. Moreover, Reynolds shear stress pattems were quite different under complicated topography, with some studies suggesting that maximum turbulence production occurring at 0.1 of the flow depth and others showing a maximum value at 0.5 of the flow depth (Sukhodolov et al., 1998). This could arise from the flow undergoing local acceleration or deceleration, which can serve to decrease or increase point values of Reynolds shear stress (Song and Chiew, 2001), or the ftow being deflected in the vertical direction, which would modify its vertical distribution. An alternative possibility for these inconsistencies is that “typical” eddies can be formed in areas other than the near-bed region since strong velocity gradients can exist at heights up to haif ofthe flow depth (cx: Kim et al., 1971) (figure 12). However, in the absence
of the vertical flow component, it is difficuit to ascertain whether these gradients are a precursor to eddie generation or simply a velocity signature of the busting cycle.
Uq:t)
Figure 12: Instantaneous (black une) and average (dashed fine) velocity profiles (Kim et al., 1971).
2.2.2. Secondary Circulation
Secondary circulation ceils are features that have been obseiwed in straight (Sukhodolov et aï., 199$; Rodriguez at aÏ., 2002), braided (Richardson and Thorne, 1998), meandering chairnels (ex: Rhoads and Welford, 1991) and at river confluences (Rhoads and Kenworthy, 1998), althougli the mechanisms that drive them are quite different. While those in the two former cases are driven primarily by turbulence (Sukhodolov et aÏ., 1998), secondary cunents in river bends are driven by centrifiigal force, and are therefore relatively strong (Rhoads and Welford, 1991). Considering that Demuren (1991) found the strength of secondary currents to range between 10% and 40% of the downstream component, it suggests that the lateral component of shear stress should display a sirnilar variability.
2.2.2.1. Meat, VeÏocity
Under the simplest of conditions, secondary currents develop along river bends as the flow is progressively deflected towards the outer bank through a combination of
C O O O O O O O
O t1
centrifugal force (Rhoads and Welford, 1991) and topographic steering (Whiting and Dietrich, 1991). While the strength oflateral forces is deterrnined by the plan geometiy and stage of the channel, any amount of deflection will affect the flow structure in two distinct ways. Firstly, it dispiaces the high velocity core towards the outer bank (Dietrich and Whiting, 1989). Secondly, it causes the river to develop a transverse siope along the water surface (Chang, 2002), thereby creating an inwardly directed pressure gradient. As such, the magnitude and orientation of cross-stream flow is govemed by the balance between the outwardÏy directed centrifugal force and the inwardly directed pressure gradient. Centripetal acceleration is proportional to water velocity whereas pressure force at a point is determined by the depth of the overlying water. Therefore, centrifugal forces dominate the upper portion of the profile, resulting in an outward motion wliose intensity increases towards the surface, while the lower portion is dominated by pressure forces and the inward motion strengthens towards the bed. By virtue of the relationship between flow velocity and bed shear stress, the outer haif of river bends are preferentially eroded and the bed sediments are transported towards the inner bank (Dietrich and Smith, 1984). This creates the typical deep concave scour pool next to the outer bank and shallow convex point bars next to the inner bank seen in meander loops (Figure 13).
Indeed, previous research bas implied that secondaiy currents can make a significant contribution to the overail magnitude of bed shear stress. While smdying sediment transport along a sand bedded meander, Dietrich and Whiting (1989) noted that its sedirnents were mobile, yet estimates of shear stress were below the threshold value. This discrepancy was attributed to the contribution of the cross-stream component to the
tNNER
BANK
REGION
MID-CHANN EL
REGION
OUTER
BANK
REGION
overail magnitude of stress levels, which was omitted from their calculations as it was treated as a second order terni
Moreover, there can be a great deal of variation in the structure of secondary cuirents in river bends. Both fleld (Frothingharn and Rhoads, 2003) and modelling studies (Ferguson et aÏ., 2003) have dernonstrated that the lateral extent of circulation celis will va;y along a single meander loop, and they occasionally decay completely. Furthernore, researchers have sornetimes detected the presence of an additional weaker celi along the outer bank circulating in the opposite direction (Blankaert and Graf, 200 1). In the context of bank stability analysis, this bas important implications as the second celi dispiaces the high velocity core, bence the zone of maximum bed scour, towards the center of the channel. Therefore, these additional celis reduce the lateral migration rate of a river.
Figure 13: Secondary currents in river bends from Knighton (1998).
It has been noted that flow can also become constricted in sharply curved bends due to the development of large recirculation eddies downstream of the point bar (Ferguson et aÏ., 2003) (figure 14). Acting as a flow obstruction, the lateral extent of these recirculation zones will flot only modify the pattem of secondaiy currents, but can also intensify bed shear stress by concentrating flow along the outer portion of the channel.
2.2.2.2. Turbulence Distribution
While there are no in situ studies examining turbulence distributions in river bends, a great deal of research has focused on identifying the various sources of turbulence and their distributions along straight reaches. Based on this and the
b)
II1
- _,_- —- -— -—-— -Near Surface I VeIociLy magnitude(m/s) 0.70 — 0.60 — 0.50 — 0.40 — 0.30 — 0.20I
0.10 0.00 EL
10mcharacteristic flow patterns in river bends, it is possible to make inferences on the spatial distribution of turbulence intensities along meander loops.
The region upstrearn of the bend entrance is characterized by high flow velocities with respect to that observed in poois. These riffle regions typically contain symmetrical cross-sections cornpared to pools, and therefore one would expect a linear decrease in turbulence intensities towards the water surface like that observed by Song and Graf (1994). Yet natural flows are likely to exhibit slightly different pattems due to increased roughness. Previous studies have illustrated that intensities increase with the presence ofroughness elements (Grass, 1971); moreover, riffle sections in sand bedded reaches often contain bedforrns, which further increase turbulence driven events (Sukhodolov et aï., 1998; Rodriguez et al., 2002). Therefore one would expect the downstrearn values of turbulence intensities to be higlier than those seen in flumes. Moreover the vertical turbulence distribution may take the form of an exponential decrease (Sukhodolov et aï., 199$; Blanckaert and Graf, 2001) rather that the linear trend reported by Song and Graf (1994). Additionally, this decrease in turbulence associated with bed distance may only be valid for the central region of the channel. Since turbulence intensities are proportional to local velocity gradient, which is related to boundary distance, near bank vertical distributions may be characterized as uniforrn or even display an increase towards the surface as the bank becomes the dominant boundaiy affecting flow. Cross-stream and vertical components of turbulence are generally weak compared to downstream values in these regions (Sukhodolov et aï., 1998).
Unlike the case of straight reacies, the ftow in river bends display strong secondary culTents as well as large accelerations and decelerations due to rapid changes in bed topograpliy. Given that both of these factors influence turbulence, turbulence distributions in meander loops will resemble distorted versions of those seen along straight reaches.
As the flow travels througli the bend, a separation zone may form at the pool entrance similar to that observed over a backward step by Nelson et aÏ. (1995) and beyond dune crests (Bennett and Best, 1995). Upon entering the pool, the flow will decelerate due to an increasing cross-sectional area; recent researci lias highliglited tliat flow deceleration is associated witli increased turbulence activity (Song and Chiew, 2001; Tliompson, 2004). Conversely, tlie pool exit is likely to be tlie site of lower turbulence activity due to flow acceleration as well as intense sweep events like that observed on dune faces by Bennett and Best (1995). Whule this describes topographically induced turbulence distributions for single pooi river bends, laborato;y studies suggest tliat meander loops can contain multiple points of flow separation. In their flume study of bed deveÏopment in meanders, Wbiting and Dietrich (1993a) found that multiple pools tend to develop along tlie outer bank under large amplitude bend configurations, which would result in multiple sliear layers. Whule numerical simulations using their data were unable to reproduce the observed bed topography (Wu et aÏ., 2000), other flurne (Blanckaert and Graf 2001) as well as in situ studies (Whiting and Dietrici, 1991) have observed multi-pool development in muci tighter bends.
Moreover, cross-stream and vertical turbulence pattems are further cornplicated by the presence of strong secondaiy currents. Circulation ceils are characterized by
outward!y directed near-surface culTents and inwardly direct near-bed currents witli regions of downwelling and upwelling next to the outer and inner banks, but littie researcli lias focused on cross-sectional distributions of turbulence in river bends; those that have show a far more comptex pattem than in straight reaches. In their meander experiment involving a flume, also with srnooth boundaries, Shiono and Muto (1998) found similar trends in turbulence intensities as those of Song and Chiew (2001). However, Blanckaert and Graf (2001) sliowed that tlie turbulence intensities vary with bank distance — cross-stream fluctuations were stronger in the center of the charme!
wliereas tlie converse is true towards the banks. The literature also reveals that while there are no shortage of studies indicating that bed shear stress increases towards the outer bank (Song and Chiew. 2001), there are also instances where the opposite is tnie (Shiono and Muto, 199$; Blanckaert and Graf, 2001). This pattem cannot have resulted from flow separation along the outer bank as both of these studies were performed in flumes with smooth plexi-glass banks, but neither set of authors propose an explanation for suci a trend.
Furtlier complexities to turbulence pattems are introduced by the presence of obstructions and planform geometry of the reach since both of these factors can drastically rnodify the systems flow dynarnics. Researciers have noted that densely vegetated banks (Thorne and Furbisli, 1995) and large woody debris (LWD) (Daniels and Rhoads, 2003; Daniels and Rhoads, 2004) tend to inhibit circulation ce!ls, which wi!l modify cross-stream and vertical components of turbulence so as to resemble that of
a straight reach. Moreover, LWD along river banks tend to redirect the flow towards the
center of the channel (Daniels and Rhoads, 2003) muci like the case of flow over fences
(Lee and Kim, 1999) and flow deflectors (Biron et aï., 2004a); this creates vertical shear layers, which are the sites of intense turbulence activity. Sirnilar vertically oriented regions of flow separation can be produced in tight river bends (Andrle, 1994; Ferguson et aÏ., 2003), yet the strength of this shear layer is highly dependent on upstream geornet;y. Numerical simulations have demonstrated that the extent of flow separation is increased if the upstream reach is curved opposite to the river bend and reduced if curved in the same mamer as the bend compared to a straigbt upstream section (Hodskinson and Ferguson, 1998) (Figure 15). Similar recirculation zones have been observed downstream of the point bar along sharpÏy curved meander ioops in the absence ofan upstream bend (Ferguson et aï., 2003).
Turbulent processes have clear theoretical implications for meander evolution in a sand bedded river, but research into this subject bas been completely confined to laboratory settings, with most studies involving a trapezoidal chairnel. Due to variable bed topography, flow structure, planform geometiy and obstructions, turbulence pattems in natural rivers are inherently far more complicated than those observed in flume experiments. Yet, considering the strong link between turbulent structures and sediment transport, ail studies attempting to predict channel evolution should not neglect this phenomenon
Near surface ftow Datterns
Near
bed f[a.’ jafterns
PIan[orm
confïgu:ations
f
I
r
1 m.n
p’
2.3. Bed Shear Stress Estimation
Despite the fundamental role of bed shear stress in fluvial processes, obtaining accurate estirnates of this variable innatural rivers with fully developed ftow bas proven difficuit even in straight reaches. Ibis can be attributed to either the Iack of consensus
on the proper technique to calculate this variable, different measuring devices used in
field studies, or to the 1ack of an adequate theoiy in non-uniform flows.
‘H] ri
t—
f
j
j
<
/1the outer bank Figure 15: Effects of upstream geometry on extent of flow separation along
(llodskinson and Ferguson, 1998).
River engineering projects have traditionally quantified this variable using various techniques that assume the flow is uniform, steady and one-dirnensional (Chang, 2002). In spite of their success, the aim of such projects is often to maintain a stable channel under bank full or ftood conditions. Hence, their bed shear stress estimates are padded by a safety factor to ensure channel stability, which is inappropriate when attempting to evaluate patterns of bed scour by comparing the hydraulic forces of the flow against the critical value needed to initiate sediment transport.
While Dietrich and Whiting (1989) and Biron et aï. (2004b) have assessed the relative accuracy of the various methods in field and laboratory studies respectively, fiirther investigation is required to resolve under which conditions each method can be applied. In generaf, it appears as though the appropriate calculation technique depends on both the scale ofthe project at hand and the channel flow conditions.
2.3.1. Meaîi f!ow Techniques
The most widely applied approach in determining boundaiy shear stress is the reach-averaged stress method (Dietrich and Whiting, 1989, Petit, 1990), where:
T0 =,RS, (1)
where r0 is bed shear stress, p is mass density of water, gis acceleration due to
gravity, Ris hydraulic radius and is the energy siope. WhiÏe this method is well suited for studies focusing on shear stress distributions at the reach or watershed scales where obtaining a detailed velocity dataset is problematic, it masks the spatial differences in stress pattems required for projects operating at the bend scale.
The next most common approach to deriving shear stress is based on the assumption that the vertical velocity distribution wiIl follow a logarithmic profile (Prandtl, 1935). Here, the equation is:
(2)
where u is velocity at a given heigbt above the bed, i is Von Karman’s constant (-M.4), and z0 is the characteristic roughness length. Whule this method bas been used often in smaller scale studies (Petit, 1990; Whiting and Dietrich, 1991; Biron et aÏ., 1998; Kim et aÏ., 2000; Biron et al., 2004b), Kabir and Torfs (1992) highlighted the difficulty in deriving the correct value of z0 over mobile beds. Moreover, obtaining velocity profiles at many locations is impractical for many field smdies since time is a major constraint.
While flume experirnents have indeed validated the Iog-law assumption (eg: Song and Chiew, 2001), there is ample evidence that natural bed topography acts as a source of profile distortion. Both laboratoiy and field studies over gravel (Roy and Buffin-Bélanger, 2001) and sand (Bridge and Best, 1988; Beimett and Best, 1995) have detected zones of recirculation (figure lOi). Furthermore, Blanckaert and Graf (2001) found that the high speed core of the flow became submerged along river bends, and therefore the assumption ofa logarithmic velocity profile is flot valid.
More importantly, studies of chaimel migration pose unique difficulties as they inherently require estirnates of bed shear stress at the toe of a bank to evaluate their stability. However, velocity profiles are even more like]y to deviate from their expected pattern in these areas since the log-law theoiy incorporates the bed contribution to flow
resistance, but not the bank component. In their study of the flow structure within a straight reach of a sand-bedded river, Sukhodolov et al. (1998) found that the logarithmic assumption is only valid for profiles in the central portion of the channel; measurernents in region beyond 0.3 to 0.7 of the flow depth and those where bank proxirnity is under 0.3 ofthe channel width deviate greatly from their expected values.
For theoretical estimations the drag coefficient method is often used, which relatesthe boundary shear stress to the square ofwater velocity (U). It is defined as:
r0 =
CDU
(3)
where CD is the drag coefficient. While this method is advantageous in that it requires a single velocity measurement, obtaining accurate resuits is problematic due to the variability of and the difficulties of estimating CD throughout the reach.
A final approach involvingmean velocity is to modify equation 2 so it requires a single velocity measurement at any above the bed, which can be done tbrough an argument for boundaiy roughness. Here, z0 can be estimated through the equation:
-— X (4)
0
- f(R)
where A is an empirical constant, Dis a length scale of grains controlling resistance where x is the percent finer than that size fraction, and R is the Reynolds roughness number (Dietrich and Whiting, 1989), which can be reduced to:
z0 0.1D84 (5)
In spite of these equations having been applied in a range of fluvial research, previous studies on the va;ying shape of velocity profiles, the contribution of secondaiy cunents and impacts of turbulent processes on stress levels bring the validity of these techniques into question.
2.3.2. Tttrbtdent fÏow Techitiqties
Previous studies have assessed the differences between mean flow and turbulence based approaches to estirnate bed shear stress (Dietrich and Whiting, 1989; Kabir and Torfs, 1992; Kim et aÏ., 2000; Huthnance et aL, 2002; Biron et al., 2004b). Afthough a universal method remains elusive, the resuits of the turbulence based techniques are veiy promising. Considering the implications of perfecting the Iink between turbulence and shear stress on our current models of sediment transport and channel evolution, this should be the focus of intensive research. Therefore it is sornewhat disconcerting to note that despite the availability of higli frequency velocity sampling devices, this topic has neyer been investigated along natural rivers. Although an experiment was performed in a straight flume tank to evaluate the different turbulence based techniques (Biron et al., 2004b), the authors cautioned that the findings of similar field studies may be inconsistent with theirs due to irregularities in the structure of the flow in rivers. Yet, since no sucb comparative studies exist, this issue clearly merits further attention.
To analyse a turbulent signal the downstream (ii), cross-stream (y) and vertical (w) components of velocity at time t must be broken down into their tirne averaged values and their instantaneous deviations. They can be written as:
= ii+u’(t) (6)
vQ) = i3 +v’(t) (7)
wQ)= W+w’Q) (8)
where the overbar denotes the tirne averaged quantity and the prime, the instantaneous deviation (Clifford and French, 1993).
Using turbulence data, there ai-e three general techniques available to obtain shear stress. The first approach is the Reynolds shear stress technique, whose equation in the downstream-vertical plane (r) is defined as:
= —pu’w’ (9)
where u’W is the time averaged product of the instantaneous deviations of velocity in the downstream-vertical plane (Clifford and French, 1993). This method has been widely applied in both flurne studies (ex: Shiono and Muto, 1998; Shiono et aÏ., 1999; Blankaert and Graf 2001; Song and Chiew, 2001) and natural river studies (cx: Roy et al., 1996; Sukhodolov et aï., 199$; Buffin-Bélanger et al., 2000b).
Fluctuations of velocity that contribute positively to Reynolds shear stress are located in quadrants 2 and 4 (Roy et aL. 1996) (Figure 16), which are refened to as ejection (quadrant 2) and sweep (quadrant 4) events. By contrast, events Iying within quadrants one and three lower the local shear stress value. Previous studies in the boundaiy layer flow involving quadrant ana]ysis have shown that bursts and sweeps make a larger contribution than quadrants 1 and 3 events (cx: Bogard and Tiederman,
1986).
Despite its prevalence, it has been suggested that equation 9 does not include ail the sources of stress (Cousin, 1957) and that the Reynolds shear stress should acmally take the forrn of: