HAL Id: hal-01518759
https://hal.archives-ouvertes.fr/hal-01518759
Submitted on 5 May 2017HAL is a multi-disciplinary open access archive for the deposit and dissemination of sci-entific research documents, whether they are pub-lished or not. The documents may come from teaching and research institutions in France or abroad, or from public or private research centers.
L’archive ouverte pluridisciplinaire HAL, est destinée au dépôt et à la diffusion de documents scientifiques de niveau recherche, publiés ou non, émanant des établissements d’enseignement et de recherche français ou étrangers, des laboratoires publics ou privés.
Method for orthorectification of terrestrial radar maps
Marion Jaud, Raphaël Rouveure, Patrice Faure, Laure Moiroux-Arvis,
Marie-Odile Monod
To cite this version:
Marion Jaud, Raphaël Rouveure, Patrice Faure, Laure Moiroux-Arvis, Marie-Odile Monod. Method for orthorectification of terrestrial radar maps. ISPRS Journal of Photogrammetry and Remote Sens-ing, Elsevier, 2014, 97, pp.185-194. �10.1016/j.isprsjprs.2014.09.001�. �hal-01518759�
Method for orthorectification of terrestrial radar maps
1
Marion Jaud*, Raphaël Rouveure*, Patrice Faure, Laure Moiroux-Arvis, Marie-Odile Monod
2
3
Affiliation: Irstea, UR TSCF, 24 avenue des Landais – BP 50085, F-63172 Aubière, France.
4
* Corresponding authors: [email protected] (+33 473440711); [email protected] (+33
5
473440685)
6
Abstract
7
The vehicle-based PELICAN radar system is used in the context of mobile mapping. The R-SLAM
8
algorithm allows simultaneous retrieval of the vehicle trajectory and of the map of the environment.
9
As the purpose of PELICAN is to provide a means for gathering spatial information, the impact of
10
distortion caused by the topography is not negligible. This article proposes an orthorectification
11
process to correct panoramic radar images and the consequent R-SLAM trajectory and radar map.
12
The a priori knowledge of the area topography is provided by a digital elevation model. By applying
13
the method to the data obtained from a path with large variations in altitude it is shown that the
14
corrected panoramic radar images are contracted by the orthorectification process. The efficiency of
15
the orthorectification process is assessed firstly by comparing R-SLAM trajectories to a GPS trajectory
16
and secondly by comparing the position of Ground Control Points on the radar map with their GPS
17
position. The RMS positioning error moves from 5.56 m for the raw radar map to 0.75 m for the
18
orthorectified radar map.
19
Keywords
20
FMCW radar; orthorectification; radar cartography; DEM
21
1. Introduction
22
Usually a map translates a three-dimensional environment into a two-dimensional picture. The
23
aim of geocoding is to reconstruct the correct imaging geometry so that each image pixel is
24
associated with its position on the earth. In general, remote-sensing data are affected by internal
25
distortions due to the sensor or the platform (Richards and Jia, 2006). They are also affected by
26
distortions due to topographic effects. Today the increasingly fine resolution (sub-meter level)
27
requires the impact of distortions to be taken into account, particularly when the aim is to provide a
28
basis for gathering spatial information. Moreover, as mentioned by Liu et al. (2004), the presence of
29
geometric distortions inhibits the alignment and co-registration of topographic data with other
geo-30
spatial data layers. “Ortho-rectification” is a procedure that removes distortions from the image,
31
creating an “ortho-image” with features positioned as they would be in a planimetric map (Novak,
32
1992). Without orthorectification, scale is not constant in the image and accurate measurements of
33
distance are impossible. Generally speaking, an ortho-image refers to aerial photographs or satellite
34
images. Nevertheless, the concept of orthorectification can be extended to any 2D remote sensing
35
data in a 3D environment.
Many papers address the questions of distortion and terrain corrections for radar images.
1
Naraghi et al. (1981) presented a method to create geometrically rectified radar imagery by matching
2
SAR data with a digital terrain model. Domik et al. (1984) proposed a method to orthorectify satellite
3
or aerial radar images using topographic height information derived from stereo-radar. More recent
4
studies also relate mainly to satellite or aerial data (Liu et al., 2004; Loew and Mauser, 2007; Saur et
5
al., 2007; Zhang et al., 2012).
6
This study focuses on data provided by PELICAN radar (Rouveure et al., 2008). The PELICAN radar is
7
a terrestrial radar system, which can be mounted on top of a vehicle. This scientific prototype
8
developed by Irstea lab (French National Research Institute of Science and Technology for
9
Environment and Agriculture) is not commercially available. Thanks to its rotating antenna, the
10
system provides maps of the surrounding environment. For each point of the surface, the
radar-11
target distance is measured; this is the slant range distance. The corresponding true horizontal
12
distance (called ground range distance or planimetric distance) must be calculated. In this case, the
13
situation is greatly different from correcting SAR images. Indeed, in the case of a radar system
14
mounted upon a vehicle, since it is approximately situated at ground level, the radar scans the
15
environment in the horizontal plane. Thus the effects caused by the land topography are different
16
from those found on satellite or aerial SAR images. After a brief description of the PELICAN radar
17
system and of the radar map construction process, the article shows how the topography can affect
18
the geometry of radar datasets. A method is proposed to correct these effects in order to
19
“orthorectify” the datasets.
20
2. Radar acquisition and type of data
21
The PELICAN radar system uses the Frequency Modulated Continuous Wave (FMCW) principle as
22
described in details in (Rouveure et al., 2009) and (Monod, 1995). Waves are emitted through an
23
antenna (aperture angle 20° vertical, 5° horizontal) which rotates in a horizontal plane, so that a strip
24
of ground perpendicular to the vehicle displacement plane is illuminated. A portion of the emitted
25
wave is reflected back towards the radar antenna. Following FMCW radar theory, the radar target
26
distance is computed from the beat frequency resulting from the interference between the emitted
27
wave and the reflected wave (Skolnik, 1980). The PELICAN radar carries out a complete scan in one
28
second. An image is built up from the successive angular scans recorded during the antenna rotation.
29
The main technical characteristics of the PELICAN radar are detailed in Table 1. Thanks to its small size
30
(30 x 30 x 30 cm) the PELICAN radar can be easily loaded onto different mobile platforms (Fig. 1).
31
Table 1. Main characteristics of PELICAN radar
32
Transmitted power 50 mW
Antenna gain 20 dB
Carrier frequency 24 GHz
Range 100 m
Angular / Distance resolution a 5° / 1 m Accuracy (on canonical target) 2 cm
Size / Weight 27 x 24 x 30 cm / 10 kg
a
On a panoramic radar image.
1
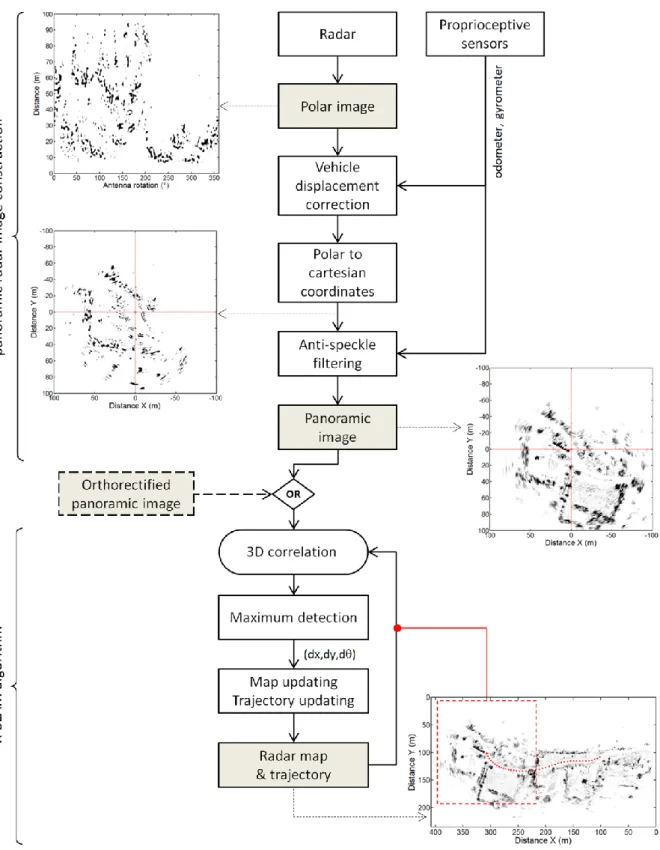
The radar map is built gradually, as described step by step in Fig. 2 (Rouveure et al., 2009).
2
The first stage is the construction of a “panoramic radar image”. A 360° radar scan in the
3
horizontal plane leads to a polar image (Fig. 2) built up from radar-target distances measured by FFT
4
techniques at each degree of antenna rotation in the horizontal plane. The distance and the angular
5
resolution in the polar image are respectively about 1 m and 5°. At the end of a complete antenna
6
scan, the intra-scan distortions due to vehicle motion during antenna rotation are corrected and the
7
speckle is filtered. The 1025 x 1025 pixel image computed is called “panoramic radar image” (Fig. 3a).
8
The second stage consists in radar map and trajectory construction through the “R-SLAM”
9
algorithm. The radar map is computed independently of the platform dynamics and of the radar
10
position on the vehicle. For the nth panoramic radar image, this approach includes the following steps
11
(Fig. 2):
12
i) 3D cross-correlation (two translations and one rotation) between the nth radar scan and
13
the previously constructed map.
14
ii) The maximum of the correlation matrix gives an estimate of the radar inter-scan
15
displacement and rotation (dx,dy,dθ).
16
iii) Map updating merging the nth panoramic radar image with the previously recorded map
17
and trajectory updating utilizing successive inter-scan displacements and rotations.
18
The final radar map is a gray-scale raster, with a spatial resolution of 20 cm. The relative radar
19
trajectory computed simultaneously is called “R-SLAM trajectory”.
20
The 2D map is finally georeferenced either by taking advantage of GPS recording or by manual or
21
automatic matching to an orthophotograph, as described in Jaud et al. (2013).
22
23
Fig. 1: The PELICAN radar system loaded on an all-terrain vehicle with a trihedral reflector in the foreground.
1
1
3. Effects of the topography on radar data
2
Due to the scale of the study (from a few hundred meters to a few kilometers), the curved
3
geometry of Earth’s surface is not taken into account. Furthermore, the internal distortions due to
4
the sensor characteristics are not considered.
5
As mentioned in Meier et al. (1993) and Loew and Mauser (2007), the relief effects can be
6
divided in two main categories: i) radiometric effects, and ii) geometric effects. As reported by Loew
7
and Mauser (2007), rugged terrain changes the recorded brightness values due to changes in the
8
local scattering area and changing scattering mechanisms due to different incident angles. In this
9
paper, we focus on mapping applications without quantitative radiometric analysis. Radiometric
10
terrain effects will not therefore be further detailed.
11
As for satellite SAR images (Curlander and McDonough, 1991; Meier et al., 1993; Magnard et al.,
12
2010), precise terrain geocoding requires an a priori knowledge of the surrounding land topography
13
and additional information about the displacement of the vehicle. In the case of PELICAN radar,
14
geometric terrain effects have two main consequences on radar data:
15
i) change in the radar ground coverage;
16
ii) distortion of the map due to the difference between slant distance and the planimetric
17
distance or ground range distance.
18
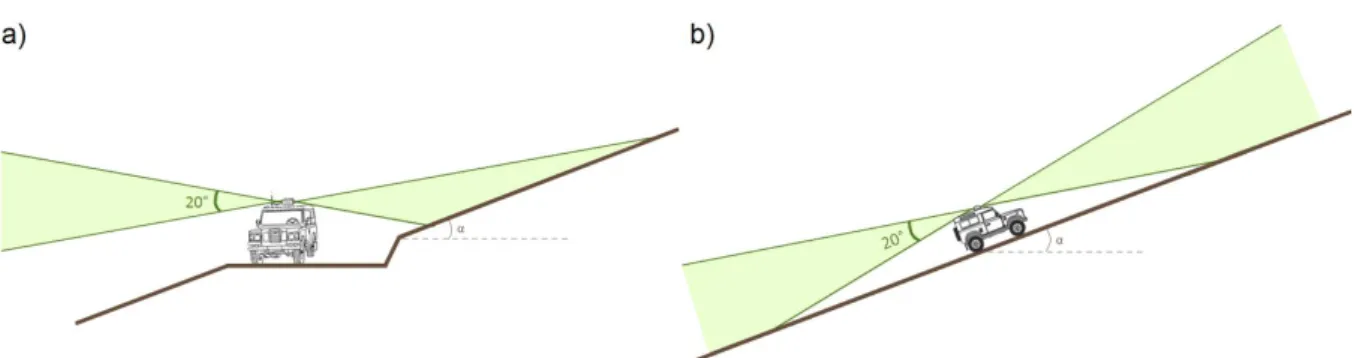
With regard to ground coverage, the change is particularly appreciable when the acquisition
19
plane remains horizontal while the surrounding environment is sloped. In this configuration, the
20
distance of the intersection of the radar beam with the ground is increased on the downhill side and
21
decreased on the uphill side (Fig. 4a). The incidence angle is also modified. However, when the
22
acquisition plane is parallel to the terrain slope, the ground coverage and the angle of incidence are
23
quasi-similar to an acquisition on a flat area (Fig. 4b). Therefore, according to the path, different
24
terrain configurations can appear at the same time depending on the observation direction.
25
Fig. 3: (a) Example of a “panoramic radar image” centered on the radar position and (b) the
1
4. Orthorectification process
2
The required inputs for the orthorectification process are: i) panoramic radar images and their
3
orientation relative to North, and ii) a Digital Elevation Model (DEM) of the area, assumed to be
4
available. Each panoramic radar image is initially acquired as a slant range image, that is to say each
5
target is located relatively to the radar position. It is observed that the topographical variations affect
6
the distance with which targets in a specified direction are displayed on a radar scan. On sloped
7
ground, the slant range image is also affected by geometric distortions. When combining the
8
panoramic images in order to build the radar map, these deviations are compounded and are then
9
very difficult to quantify. Indeed, as the vehicle moves forward, the line of sight of a given feature
10
varies from one panoramic image to another. Therefore, each radar panoramic image must be
11
individually corrected in order to create an “orthorectified panoramic image”. The orthorectified
12
panoramic images are then fed back into the R-SLAM algorithm (Fig. 2) so as to build an
13
orthorectified radar map and an orthorectified trajectory.
14
The land topography leads to an overvaluation of the measured slant range distance D in
15
comparison with the ground range planimetric distance ρ (Fig. 5a).
16
17
From Fig. 5b, it can be seen that the planimetric distance ρ is provided by:
18
𝜌 = √𝐷2 − ∆𝑍2 (1)
19
Fig. 4: Illustration of relief effects on the ground coverage of the radar beam.
where D refers to the slant range distance separating the radar from a point in the environment. ΔZ
1
is the elevation difference between the points of the scanned environment and the radar.
2
Orthorectifying the panoramic radar images involves matching each radar echo with the
3
corresponding cell of the DEM. As D is overestimated, ΔZ cannot be directly retrieved from the DEM.
4
The orthorectification process, summarized in Fig.6, takes place in the following steps:
5
i) North-orienting the radar panoramic image, initially centered on the radar position. The
6
rotation angle Az of the first panoramic image is deduced from the azimuth of the
7
mobile platform. This heading parameter is computed from the trajectory measured by
8
the GPS receiver. The following panoramic images are oriented using the onboard
9
gyrometer. Knowing the radar position R(XR,YR,ZR) measured with a centimetric GPS and
10
the panoramic image resolution, each pixel of the raw panoramic image can then be
11
expressed in the same coordinates system as the DEM.
12
ii) Finding out the elevation difference ΔZ. The cell (xD,yD) is the position in the raw
13
panoramic image. The corresponding altitude ZDEM(xD,yD) is retrieved from the DEM. The
14
elevation ZR of the radar is measured with the GPS.
15
From Fig. 5b, it can be seen that:
16
𝜌 𝐷=
∆𝑍 𝑍𝐷𝐸𝑀(𝑥𝐷,𝑦𝐷)− 𝑍𝑅 (2)17
ΔZ can then be expressed as a function of ρ by:
18
∆𝑍 =
𝜌 [𝑍𝐷𝐸𝑀(𝑥𝐷,𝑦𝐷)− 𝑍𝑅]𝐷
(3)
19
iii) Computing the planimetric distance ρ combining (1) and (3):
20
𝜌 =
𝐷√1+ [(𝑍𝐷𝐸𝑀(𝑥𝐷,𝑦𝐷)− 𝑍𝑅) 𝐷⁄ ]2
(4)
21
A shift |D – ρ| below the radar map resolution (20 cm) does not affect the radar map geometry.
22
The minimum elevation difference ΔZ affecting the radar map geometry at a slant range distance D
23
can be deduced from (1):
24
∆𝑍 ≥ ± 0.2 √10𝐷 − 1 (5)
25
The height of the radar relative to the ground, H = 2.80 m, is taken into account in the
26
orthorectification process. This height H may increase the ground elevation difference on the
27
downhill side (and respectively reduce the ground elevation difference on the uphill side). Near the
28
sensor the shift due to H may predominate over purely topographical effects.
1
5. Ground-truth validation
2
5.1-Experimental implementation
3
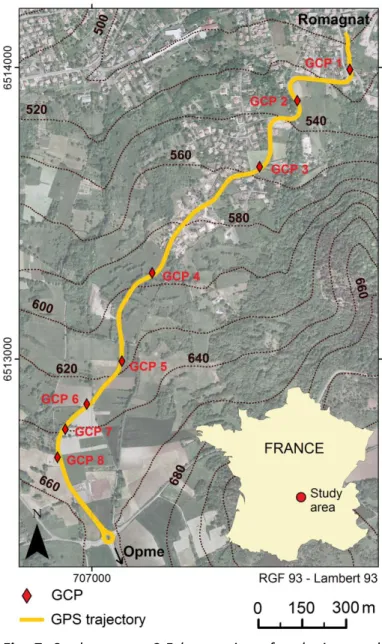
This correcting method was tested on a dataset collected between Opme (670 m) and Romagnat
4
(510 m) in Auvergne, France (Fig. 7). The path is a 2.5 km section of a sloping road with a difference
5
in altitude of 160 m. The radar equipment was mounted on the top of an all-terrain vehicle, 2.80 m
6
above the ground (Fig. 1). During data collection the speed of the vehicle did not exceed 30 km/h.
7
The PELICAN radar collected 730 panoramic radar images. A GNNS antenna was set up beside the
8
radar and connected to a ProFlex® 500 GNSS receiver. As the lever arm between the radar and the
9
GNSS antenna is low (about 50 cm), it was neglected. Throughout the acquisition session the radar
10
position was measured at the rate of one position per second. Four reference stations of the French
11
GNSS permanent network (RGP) are situated within a radius of 12 km. After post-processing, the
12
positioning accuracy obtained is 1 cm in the horizontal plane and 1 cm in the vertical plane.
13
1
In order to assess the efficiency of the orthorectification process, Ground Control Points (GCP)
2
have been created. Metallic trihedral radar reflectors (Fig. 1 and Fig. 7) have been erected on the
3
study area. These reflectors have been georeferenced using a ProFlex® 500 GNSS receiver and
post-4
processing. The accuracy on their position is 1 cm. As the highly reflective metallic trihedra appear as
5
black spots on the radar map (Fig. 3a), they can be accurately identified on the radar dataset.
6
The presented results have been georeferenced in RGF 93 - Lambert 93, the French official
7
coordinate system, based on GRS 80 ellipsoid. The DEM related to the study area is a 1700 m x 2180
8
m extract from the BD Alti®, an altimetric database provided by IGN (French National Geographic
9
Institute). On the study area, this database is computed by means of photogrammetric restitution. As
10
the spatial resolution is only 25 m, the BD Alti® extract has been beforehand interpolated on an
11
oversampled grid of 1 m resolution.
12
5.2- Results of the orthorectification process
13
Fig. 7: Study area: a 2.5 km section of a sloping road,
between Opme and Romagnat (Auvergne, France). The total difference in altitude is about 160 m. Eight reflectors (GCP) are distributed along the path.
Fig. 8 depicts the effects of orthorectification on a panoramic radar image. Fig. 8c is the
1
differential between the raw panoramic radar image (Fig. 8a) and the orthorectified panoramic radar
2
image (Fig. 8b). The blue areas correspond to areas where radar echoes were deleted during the
3
orthorectification process, while the red areas correspond to the areas where these echoes
4
appeared. It can be seen that the orthorectification process tends to contract the panoramic images,
5
whether data collection is performed uphill or downhill. This shift can amount to a displacement of
6
up to several pixels in azimuth direction. The areas of the panoramic radar image which are not
7
affected by orthorectification correspond to areas where the height differences are low and induce
8
negligible distortions.
9
10
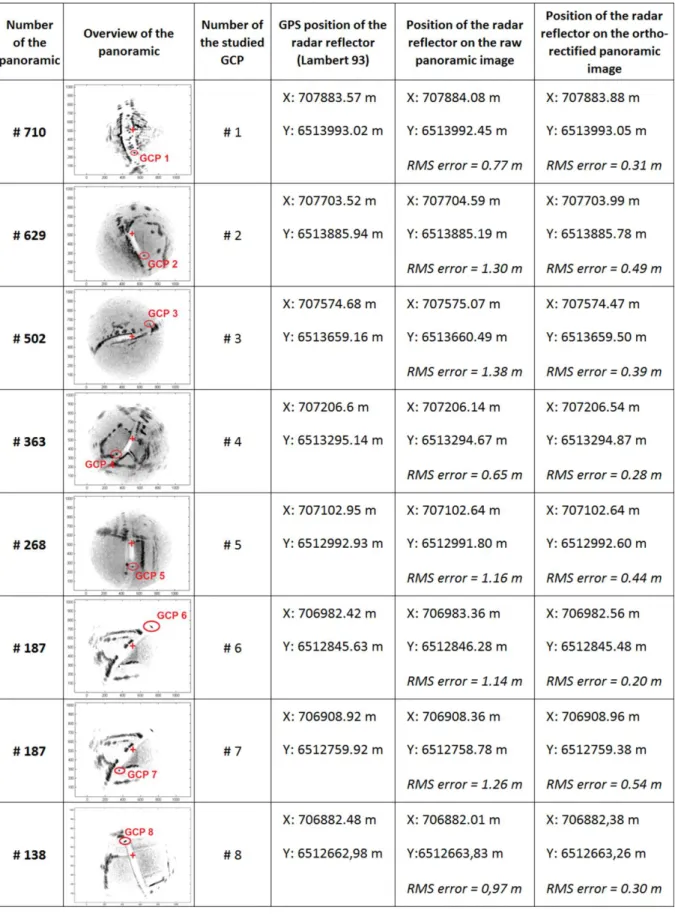
The effects of orthorectification on a panoramic image are quantified by using a georeferenced
11
radar reflector. In the example depicted in Fig. 8, the radar reflector echo is shifted by 0.68 m. To
12
ensure that orthorectification improves the image geocoding, the reflector’s positions computed
13
from panoramic images are compared with the position measured by GPS. As each GCP is clearly
14
identifiable on about 40 panoramic images, this comparison can be made for more than 300 images.
15
Table 2 shows the results of this comparison for only one panoramic radar image per GCP. In each
16
case, the positioning RMS error is lower on the orthorectified panoramic radar image. Observing the
17
position of the GCP on raw and orthorectified panoramic images, it can be noticed that the decrease
18
of the error is due to the contraction of the panoramic images by the orthorectification process.
19
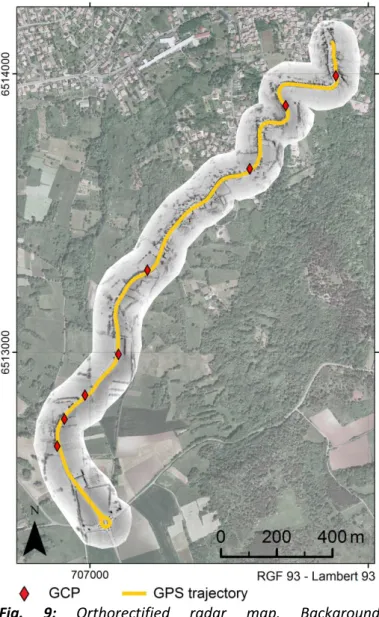
Once all the panoramic radar images have been orthorectified, they are associated by the R-SLAM
20
algorithm so as to compute the orthorectified radar map (Fig. 9) and simultaneously the R-SLAM
21
trajectory.
22
Fig. 8: Comparison of (a) the raw panoramic radar image #138 and (b) the orthorectified panoramic
radar image. (c) The differential between (b) and (a). Blue areas appear where radar echoes have been deleted after the orthorectification process. Red areas are those where these echoes have appeared.
Table 2. Quantification of the orthorectification process effects on the GCP (example given on few
1
panoramic radar images).
2
1
As detailed in section 2, the final radar map is a gray-scale raster with a spatial resolution of 20
2
cm. As the panoramic radar images have been contracted by slope effects, the radar map and the
R-3
SLAM trajectory (see section 2) are also contracted by the orthorectification process. At this point,
4
the “raw R-SLAM trajectory” and the “raw radar map” (computed from non-orthorectified panoramic
5
images) must be distinguished from the “orthorectified R-SLAM trajectory” and the “orthorectified
6
radar map” (computed from orthorectified panoramic images).
7
At the scale of the radar map, the effects of the orthorectification process can be assessed in two
8
different ways:
9
i) by comparing respectively the raw and orthorectified R-SLAM trajectories with the GPS
10
trajectory;
11
ii) by comparing the position of GCP respectively on the raw and on the orthorectified
12
radar map with the GPS position of the GCP.
13
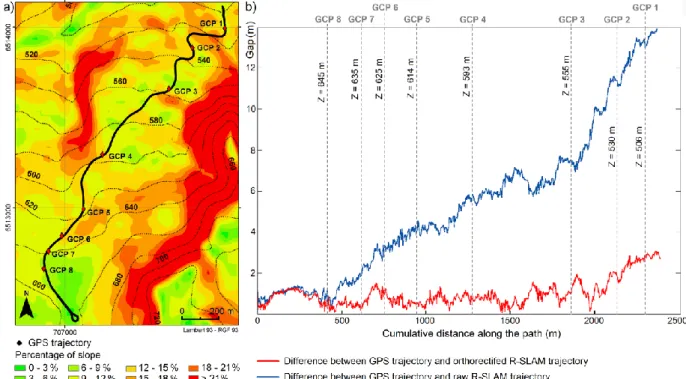
Fig. 10a is a map of slope (in percentage) of the study area. It should be noted that the survey
14
was performed downhill, from south to north. Fig. 10b depicts on the one hand the difference
15
Fig. 9: Orthorectified radar map. Background
orthophotograph is extracted from BD ORTHO® (©IGN – Paris – 2008).
between GPS and raw R-SLAM trajectories (blue curve) and on the other hand the difference
1
between GPS and orthorectified R-SLAM trajectories (red curve). The RMS errors are respectively 6.1
2
m and 1.0 m. For the displacement up to 500 m, it can be seen on Fig. 10a that the ground slope is
3
low (approximately 3 %). As a result the two curves are similar and the error is almost constant. From
4
the distance of 500 m to 1900 m the average slope is 6.5 %. The difference between GPS and raw
R-5
SLAM trajectories (blue curve) increases steadily since errors due to topographical distortions
6
accumulate. From 1900 m to the end of the path the ground slope is around 11 %. The slope of the
7
blue curve rises dramatically because of the distortions due to relief effects. The gap between GPS
8
and raw R-SLAM trajectories is thus correlated to the topographic gradient.
9
On the other hand, thanks to the orthorectification process, the difference between GPS and
10
orthorectified R-SLAM trajectory (Fig. 10b - red curve) remains almost stable throughout the path.
11
This difference corresponds to the georeferencing error of the orthorectified radar map.
12
13
Table 3 summarizes the position of the GCP i) measured by GPS, ii) retrieved from georeferenced
14
raw radar map, and iii) computed from orthorectified radar map. For each GCP, the distance
15
between the position on the radar map and the GPS position is computed. On the orthorectified
16
radar map, the gap barely changes. The total RMS error on the eight GCPs is 0.75 m. On the raw
17
radar map, the RMS error is about 5.56 m. The gap with GPS position increases in the northern part
18
of the study area, at the end of the path. This increase is consistent with the results in Fig. 10 and is
19
due to the cumulative topographical distortion effects.
20
One limitation of this method lies in the fact that a DEM of the area has to be available. Zhang et
21
al. (2012) mention the impact of DEM errors on SAR geolocation. In the case of PELICAN radar data,
22
the accuracy of the orthorectification process is also highly dependant on the quality of the available
23
DEM. Elevation accuracy of the DEM generally decreases in the steeper slopes (Toutin, 2002), leading
24
Fig. 10: (a) Map of slope percentage. (b) Difference of the raw R-SLAM trajectory (blue curve),
to errors in the orthorectification process. Indeed, a low resolution tends to smooth the relief
1
variations and erases small-scale features. Moreover, if the resolution of the DEM is too low
2
compared to the radar dataset resolution, the panoramic radar image is not linearly corrected, and
3
shifts are computed on small patches. In such a case, the orthorectified panoramic radar images may
4
present artifacts. Furthermore, depending on whether the available DEM represents the Earth’s
5
surface including all objects on it (Digital Surface Model: DSM) or the bare ground surface (Digital
6
Terrain Model: DTM), the result of the orthorectification process may be different.
7
Taking into account the lever arm between the radar phase center and the GNSS antenna would
8
certainly improve the accuracy of georeferencing.
9
Table 3. Quantification of the orthorectification effects on the radar map
10
GCP ID GPS Position (Lambert 93 coordinates)Position on raw radar map (Lambert 93 coordinates)
Position on orthorectified radar map (Lambert 93 coordinates)
RMS error RMS error 1 X: 707883.57 m X: 707883.53 m 9.39 m X: 707882.61 m 1.12 m Y: 6513993.02 m Y: 6514002.41 m Y: 6513993.60 m 2 X: 707703.52 m X: 707703.04 m 7.98 m X: 707703.21 m 0.64 m Y: 6513885.94 m Y: 6513893.91 m Y: 6513886.50 m 3 X: 707574.68 m X: 707574.69 m 7.20 m X: 707575.15 m 0.85 m Y: 6513659.16 m Y: 6513666.36 m Y: 6513659.87 m 4 X: 707206.60 m X: 707205.76 m 4.44 m X: 707206.60 m 0.52 m Y: 6513295.14 m Y: 6513299.50 m Y: 6513295.66 m 5 X: 707102.95 m X: 707101.68 m 4.17 m X: 707101.96 m 1.08 m Y: 6512992.93 m Y: 6512996.90 m Y: 6512993.37 m 6 X: 706982.42 m X: 706981.98 m 2.00 m X: 706982.35 m 0.60 m Y: 6512845.63 m Y: 6512847.58 m Y: 6512846.23 m 7 X: 706908.92 m X: 706908.77 m 1.45 m X: 706909.30 m 0.38 m Y: 6512759.92 m Y: 6512761.36 m Y: 6512759.96 m 8 X: 706882.48 m X: 706882.03 m 0.82 m X: 706882.54 m 0.36 m Y: 6512662.98 m Y: 6512663.67 m Y: 6512663.33 m 6. Conclusion
11
When using terrestrial radar, topographical variations induce a difference between the measured
12
slant range distance and the planimetric distance. This results in a distortion of panoramic radar
13
images. On the radar map, as the road is sloping, the errors accumulate along the path, the
14
difference between GPS and raw R-SLAM trajectories being correlated to the topographic gradient. In
15
cartographic applications, these topographical effects must be corrected.
16
To compute planimetric distances, an orthorectification process is proposed. It retrieves from a DEM
17
the difference of altitude between the radar position and every point of the environment scanned
18
during the rotation of the antenna. Panoramic radar images are thus orthorectified. An orthorectified
19
radar map and an orthorectified R-SLAM trajectory can be computed. This orthorectification process
improves the georeferencing accuracy of the radar map and the accuracy of the R-SLAM trajectory.
1
Comparing the raw R-SLAM trajectory, respectively the orthorectified trajectory, to the GPS
2
trajectory, the RMS error is 6.1 m, respectively 1.0 m. The gap between GPS and raw R-SLAM
3
trajectories appears to be correlated to the topographic gradient. Comparing the position of GCPs on
4
the radar map with their GPS position, it appears that the RMS positioning error moves from 5.56 m
5
for the raw radar map to 0.75 m for the orthorectified radar map.
6
This orthorectification process has to be applied only when the topographic variations are
7
significant enough to affect the quality of panoramic radar images. In addition to these geometric
8
corrections, radiometric corrections of radar datasets should be considered. Finally, the impact of
9
DEM quality could be quantified, by comparing the results of the orthorectification process with a
10
DEM from a national or regional database and with a DEM of the study area computed specifically by
11
mobile laser scanning.
12
Acknowledgements
13
This work is part of PELICAN Project No. ANR-2010-EMMA-033 supported by the Agence Nationale
14
de la Recherche. The Project was labelled by ViaMeca French pole of competitiveness.
15
References
16
Curlander, J.C., McDonough, R., 1991. Synthetic aperture radar: Systems and signal processing. Wiley
17
Series in Remote Sensing and Image Processing – vol. 5, Wiley, New York.
18
Domik, G., Raggam, J., Leberl, F., 1984. Rectification of radar images using stereo-derived height
19
models and simulations. International Archives of Photogrammetry, Remote Sensing and Spatial
20
Information Sciences 25 (Part A3), 109-116.
21
Jaud, M., Rouveure, R., Faure, P., Monod, M.O., 2013. Methods for FMCW radar map georeferencing.
22
ISPRS Journal of Photogrammetry and Remote Sensing 84, 33-42. doi:
23
10.1016/j.isprsjprs.2013.07.002
24
Liu, H., Zhao, Z., Jezek, K.C., 2004. Correction of positional errors and geometric distortions in
25
topographic maps and DEMs using rigorous SAR simulation technique. Photogrammetric
26
engineering and remote sensing 70 (9), 1031–1042.
27
Loew, A., Mauser, W., 2007. Generation of geometrically and radiometrically terrain corrected SAR
28
image products. Remote Sensing of Environment 106 (3), 337-349. doi:
29
10.1016/j.rse.2006.09.002
30
Magnard, C., Frioud, M., Meier, E., 2010. Processing, geocoding and mosaicking of MiSAR data. Proc.
31
Dreiländertagung DGPF - OVG – SGPF, Vienna, Austria, 1-3 July, pp. 524-531.
32
Meier, E., Frei, U., Nüesch, D., 1993. Precise terrain corrected geocoded images. In: G. Schreier (Ed.),
33
SAR Geocoding – Data and Systems, Karlsruhe, pp. 173-185.
34
Monod, M.O., 1995. Frequency modulated radar: a new sensor for natural environment and mobile
35
robotics. Ph.D. Thesis, Paris VI University, France.
Naraghi, M., Stromberg, W., Daily, M., 1983. Geometric Rectification of Radar imagery using Digital
1
Elevation Model. Photogrammetric engineering and Remote Sensing 49 (2), 195-199.
2
Novak, K., 1992. Rectification of digital imagery. Photogrammetric engineering and remote sensing
3
58 (3), 339-344.
4
Richards, J.A., Jia, X., 2006. Remote Sensing Digital Image Analysis, fourth ed. Springer, Berlin.
5
Rouveure, R., Monod, M.O., Faure, P., 2008. Mapping of the environment with a high resolution
6
ground-based radar imager. Proc. 14th IEEE Mediterranean Electrotechnical Conference
7
MELECON 2008, Ajaccio, France, 5-7 May, pp. 801-807.
8
Rouveure, R., Faure, P., Monod, M.O., 2009. Radar Imager for Perception and Mapping in Outdoor
9
Environments. Proc. 11th International Conference of Advanced Concepts for Intelligent Vision
10
Systems ACIVS 2009, Bordeaux, France, 28 September - 2 October, pp. 618-628.
11
Saur, G., Heinze, N., Krüger, W., Edrich, M., 2007. Video-like MiSAR image sequence processing. Proc.
12
Dreiländertagung DGPF - OVG – SGPF, Basel, Switzerland, 17-21 June, pp. 111-118.
13
Skolnik, M.I., 1980. Introduction to radar systems. Electrical Engineering Series, McGraw-Hill
14
International Editions, New-York.
15
Toutin, T., 2002. Impact of terrain slope and aspect on radargrammetric DEM accuracy. ISPRS Journal
16
of Photogrammetry and Remote Sensing 57 (3), 228-240. doi: 10.1016/j.isprsjprs.2012.02.004
17
Zhang, L., Balz, T., Liao, M., 2012. Satellite SAR geocoding with refined RPC model. ISPRS Journal of
18
Photogrammetry and Remote Sensing 69, 37-49. doi: 10.1016/j.isprsjprs.2012.02.004