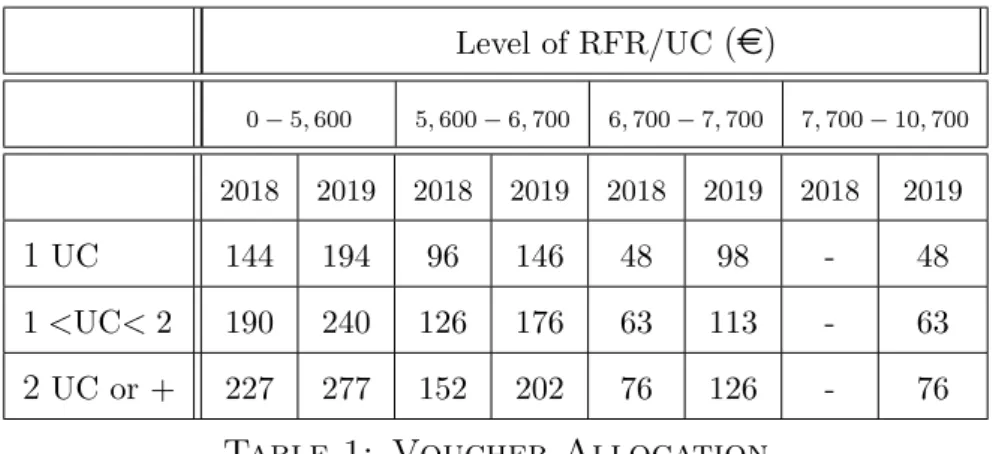
The Price Impact of Energy Vouchers
Texte intégral
Figure

Documents relatifs
Dakle, Bijela knjiga sadrži preporuke o tome kako da se poveća demokratičnost u postupanju i zakonitost u radu institucija, dok je sama politika zaštite potrošača u Europskoj
Summary. — The evolution from 2000 to 2050 of the needs in concrete, steel, aluminium and copper to build the infrastructure of electricity generation is mod- elled for the scenarios
Its application can help to promote international trade, especially food exports from the developing to the developed world and it can result in better public
The mean annual temperature has a positive significant effect on the housing price for owner- occupiers: a rise of 1 °C entails an increase in housing prices of 5.9 6.2% (according
The mean annual temperature has a positive significant effect on the housing price for owner- occupiers: a rise of 1 °C entails an increase in housing prices of 5.9–6.2% (according
Summary. — The evolution from 2000 to 2050 of the needs in concrete, steel, aluminium and copper to build the infrastructure of electricity generation is mod- elled for the scenarios
When we add the temporal preference term, the Hourly Proportional billing becomes much more advantageous than the Daily Proportional mechanism in terms of social cost and in terms
In order to establish a theoretical reading of the impact of C&V programmes on the logistics strategy of aid agencies, this part is segmented in four
