1st CMEMS INSTAC Plenary
Meeting
Context
Give more
Visibility
Requirements
[REQ-GEN- 10]: unique communication contact point
C. Troupin
Requirements
[REQ-GEN- 11]: at the start of Q2 and Q4 each year 1 × High resolution image
1 × animation
Temperature anomalies, long time series,
drifter trajectories, . . .
Requirements
[REQ-GEN- 12]: 1 × per year:"Written Use case Rationale"
Requirements
[REQ-GEN- 13]: use-case attracting media attention: Rationale delivered < 3 days after the request
Requirements
[REQ-GEN- 14]: compliance with the communication rules
From document 3.CMEMS Working Relations.pptx
I High-level scripts languages Python
I High-resolution 300 dpi
I Image format tiff & png
Requirements
[REQ-GEN- 15]: specific requirements:I veracity of the data
I written rationale: scientific expertise + understandable for non-scientists
Requirements
[REQ-GEN- 16]: material meeting the Credits & Graphic requirements stated in the CMS Communication Plan.
Meeting with Mercator
Communication Team
Webex July 17th
Participants: Cécile, Alice (Mercator-Océan), Sylvie (Ifremer), Joaquín, Charles (SOCIB)
Objectives:
—• Initial contact
—• Specification of requirements —• Example of possible contributions
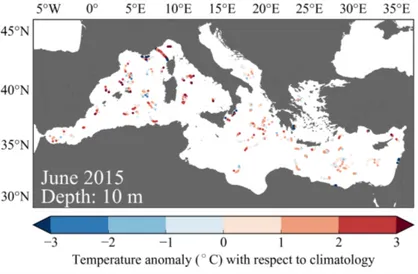
Figure 1: temperature anomalies
from in situ data
I World Ocean Atlas (or SeaDataNet) climatology interpolated at the locations
I Anomalies computed at different depths and months
I Program flexible enough to generate similar figures for different platforms, regions, . . .
Figure 1: temperature anomalies
from in situ data
I World Ocean Atlas (or SeaDataNet) climatology interpolated at the locations
I Anomalies computed at different depths and months
I Program flexible enough to generate similar figures for different platforms, regions, . . .
Figure 1: temperature anomalies
from in situ data
I World Ocean Atlas (or SeaDataNet) climatology interpolated at the locations
I Anomalies computed at different depths and months
I Program flexible enough to generate similar figures for different platforms, regions, . . .
Figure 1: temperature anomalies
from in situ data
I World Ocean Atlas (or SeaDataNet) climatology interpolated at the locations
I Anomalies computed at different depths and months
I Program flexible enough to generate similar figures for different platforms, regions, . . .
Figure 1: temperature anomalies
from in situ data
I World Ocean Atlas (or SeaDataNet) climatology interpolated at the locations
I Anomalies computed at different depths and months
I Program flexible enough to generate similar figures for different platforms, regions, . . .
Figure 2:
time series from mooring
I 2015 monthly values compared to mean, min. and max. values
Figure 2:
time series from mooring
Animation 1:
drifter in an eddy
Material for Q4
I Sent on August 21st, 2015
I No reply
I Sent again on August 31st, 2015
Material for Q4
I Sent on August 21st, 2015
I No reply
I Sent again on August 31st, 2015
Material for Q4
I Sent on August 21st, 2015
I No reply
I Sent again on August 31st, 2015
Material for Q4
I Sent on August 21st, 2015
I No reply
I Sent again on August 31st, 2015
Downstream Use Case 1:
SeaBoard Sorrento
I Sent on September 4th
Downstream Use Case 1:
SeaBoard Sorrento
I Sent on September 4th
Downstream Use Case 1:
SeaBoard Sorrento
I Sent on September 4th
What’s next?
— 1 Contacts for material for Q4 and next Tanguy, . . .
— 2 Focus on other regions no Western MedSea
What’s next?
— 1 Contacts for material for Q4 and next Tanguy, . . .
— 2 Focus on other regions no Western MedSea
What’s next?
— 1 Contacts for material for Q4 and next Tanguy, . . .
— 2 Focus on other regions no Western MedSea