Université du Québec
Institut National de la Recherche Scientifique Center INRS-Institut Armand-Frappier
Assessing Compound Self-aggregation in Drug Discovery and Development
By Marwa Dlim
Thesis submitted in partial fulfillment of the requirement of the degree of Master (M.Sc.) in Experimental Health Sciences
Evaluation Committee
President of the jury and Pr Charles Calmettes
Internal examinator INRS-Institut Armand-Frappier
External examinator Pr Guillaume Lamoureux, Ph.D.
Department of Chemistry and Biochemistry Concordia University, Montreal, QC
Research director Pr Steven LaPlante, Ph.D
ACKNOWLEDGEMENTS
First and foremost, I would like to thank GOD Almighty for the wisdom, strength, peace of my mind and good health he bestowed upon me so that I could finish this research.
l would like to express my gratitude to my family for their constant encouragement, which helped me with the completion of this research. My brother, Anas, was always by my side when l needed him most. I send special thanks to my father, mother and sisters for motivating me to complete my graduate studies and for their enduring encouragement and support.
I would also like to thank my supervisor Prof. Steven LaPlante for welcoming me into his laboratory and for his support throughout my studies.
I also thank my advisor, Prof. Patric Labonte of the Virology and Immunology Department at Armand-Frappier INRS, and his Ph.D. student, Marwa Alkaber.
I would like to thank Jessy Tremblay in for his help, advice and invaluable information for all
Confocal Microscopy experiments.
I also thank my friends who are always by my side, cheering me on. I especially thank Fatma Shahout for her help with this project especially in difficult times.
Lastly, I wish to express my gratitude to the Ministry of Education of Libya for financial support during my stay in Canada, and to NMX for their support.
Abstract
When drug-like compounds are placed in aqueous media, it is commonly understood that they can solubilize and disperse into solution as lone-tumbling molecules and/or exist as solid precipitate. However, this simplistic biphasic view is no longer valid. Instead, a triphasic model better describes compound solution behavior where compounds can also adopt an intermediate phase where compound molecules self-associate into a range of assemblies that can resemble clusters, fibers, micelles and many other forms. Although the physicochemical parameters that dictate the features of these assemblies are not yet understood, it is clear that the nature of the triphasic equilibria profoundly affects a compound’s properties, especially from the pharmaceutical perspective. We refer to these amazing assemblies as “nano-entities” and provide an introduction (Chapter 1).
This thesis aims to attract attention to these nano-entities which have, for the most part, gone undetected because they are invisible to the naked eye and detection strategies are seriously underdeveloped. We do so by first exploiting the nuclear magnetic resonance (NMR) aggregation assay that involves monitoring the solution behavior of a series of small-molecule dyes at various concentrations (see Chapter 2). This dilution-based assay demonstrates that some dyes can exist as single-molecule entities whereas others can adopt aggregates of distinct sizes. Interestingly, dyes with highly related chemical structures can adopt largely different sized aggregates - demonstrating the existence of structure-nanoentity relationships – which suggests that they can assume and/or be designed to have distinct properties. One property was evaluated where the drug Quetiapine (Seroquel) was added to the dye Congo red which resulted in the absorption of the drug into the dye nano-entity. This showed a direct drug-dye interaction, and it demonstrated that dye aggregates can have influence on drug solution behaviors. In summary, our studies demonstrate that the NMR aggregation assay can serve as a practical and valuable tool to monitor nano-entities and to better understand their associated properties (e.g. toxicity, off-target activity) and potential utility (e.g. drug encapsulation, drug delivery systems).
Chapter 3 further explores complementary strategies for detecting nano-entities. The goal was to develop, as much as possible, a combination of methods that could then be employed for correlating a compound’s properties with its physicochemical and nano-entity behavior in solution. We use several anticancer drugs (Sorafenib, Lapatinib, Gefitinib and Fulvestrant) and an antileprosy drug (Clofazimine) as model systems to better understand their physicochemical behavior and self-association properties, and to explore various techniques for probing their three-state equilibria. Their behaviors in buffers, media and cells were monitored by a combination of NMR, dynamic light scattering (DLS), transmission electron microscopy (TEM), and confocal microscopy. These drugs were found to self-associate into relatively large nano-entities having distinct types and sizes that depend on the media. Furthermore, these compounds were capable of entering cells. Noteworthy advantages and “blind spots” were observed for the various detection techniques employed. It was concluded that a combination of methods is necessary to expose these drugs’ elusive solution equilibria.
Our conclusion from the above work is that we have stumbled upon a great opportunity. Small molecules can form many types of nano-entities that depends on the media and conditions. These entities have properties – some undesired and others favorable. Our strategies can help the detection of the entities. The field is now open for exploitation purposes. For example, nano-entities could be used as drug encapsulation and drug delivery systems. This field is wide open and awaiting developments.
Key words: aggregation, promiscuity,
TABLE OF CONTENTS
ACKNOWLEDGEMENTS ii
Abstract iii
Table of Content v
List of Figures vii
List of Abbreviations viii
CHAPTER 1: BRIEF INTRODUCTION 9
1.1 Introduction to the Concept of Compound Aggregates and their Properties 10
1.2 Detection Methods of Compound Aggregation 13
1.3 Hypotheses 14
1.4 Objectives 14
1.4.1 Develop Effective Techniques for Detecting the Full Range of Nano-entities 14 1.4.2 Demonstrate the Ability of Small-Molecule Aggregation to Penetrate Cell
Membrane and Investigate their Effect on Cell Proliferation 15
CHAPTER 2: SCIENTIFIC ARTICLE (PUBLISHED) 16
2.1 Presentation of Scientific Article 17
2.2 Contributions of the Authors 17
2.3 Supporting Information 25
CHAPTER 3: SCIENTIFIC ARTICLE (TO BE SUBMITTED) 27
3.1 Contributions of the Authors 28
3.2 Revealing Drug Nano-entities 29
3.3 Supporting Information 44
CHAPTER 4: RÉSUMÉ EN FRANÇAIS (French Summary) 61
4.1 Introduction 62
4.2 Méthodes de Détection de l'agrégation de Composés 65
4.3 Hypothèse 67
4.4 Objectifs 67
4.4.1 Développer des Techniques Efficaces Pour Détecter l’ensemble des
nano-entités 67
4.4.2 Démontrer la Capacité de l'agrégation de petites molécules à pénétrer dans la membrane cellulaire et étudier leur effet sur la prolifération cellulaire 67
REFRENCES 69
LIST OF FIGURES
Figure 1. Compounds adopting a three-phase equilibrium 11
Figure 2. Proposed mechanism of inhibition and other properties of compound aggregates 12
Figure 3. Examples of the application of the “detergent effect” Tween 80. 14
LIST OF ABBREVIATIONS
Abbreviation Full Designation
CAC Critical Aggregation Concentration CPMG Carr- Purcell-Meiboom-Gill
CLSM Confocal Laser Scanning Microscopy DLS Dynamic Light Scattering
FBS Fetal Bovine Serum
HTS High-throughput Screening MST Magnetic Secure Transmission NMR Nuclear Magnetic Resonance PBS Phosphate Buffer Saline SAR Structure Activity Relationship SEM Scanning electron microscopy SPR Surface Plasma Resonance
TEM Transmission Electron Micrograph. TPSA Total Polar Surface Area
USEM Ultra-Thin Section Electron Microscopy
9
10
1.1 Introduction to the concept of compound aggregates and their properties
This thesis aims to alter the common biphasic view of the solution behavior of compounds to a more triphasic view that includes an intermediate aggregate phase. Figure 1 shows a triphasic view which features an intermediate state of soluble aggregates, keeping in mind that each compound has its own distinct equilibrium between the three states (LaPlante et al., 2013). Aggregates can form spontaneously and reversibly in aqueous buffer through critical aggregation concentration (CAC) (Duan et al., 2015; Irwin et al., 2015). Each compound assumes its own fingerprint pattern within this triphasic model, which depends on solvent, media, concentration, temperature, pH, and many other factors. The existence of soluble aggregates, their variation of sizes and types, and their properties has long eluded detection and attention. Aggregation of small molecules can form at micromolar and even sub micromolar concentrations in aqueous media, while ranging from 50 to over 800 nm (Owen et al.,2012). Moreover, aggregation is stable in the biological system media such as gastrointestinal tract and intestine as well as media with serum albumin (Tóth et al., 2017) (Lu et al., 2011). The previous work has often been rationalized based on the observations that typical drug compounds are highly serum-bound in vivo (Lu et al., 2011). Because of this, the majority of a compound would be expected to be bound to serum proteins such as albumin, leaving compounds mostly unavailable to self-associate. This assumption is unfounded, in a previous study, involving an NMR aggregation test, it clearly shown that aggregating compounds remained self-associated in a range of pharmacology buffers, plasma and blood. This would suggest that there is a significant affinity for self-association for some compounds (LaPlante et al., 2013).
11
Figure. 1. Compounds adopting a three-phase equilibrium when placed in aqueous media. At the
bottom are 1H NMR spectra (600 MHz) of various compounds in a buffer (50 mM sodium
phosphate pH 7.4) at nominal concentrations of 200 µM, (LaPlante et al., 2013).
Aggregates can have peculiar properties which act on a non-targeted spot and can change the results. One of these properties is false positive result which could be related to chemical reactivity, high molecular flexibility, and the hydrophobicity of the compound. (Feng et al., 2005). In addition, structural activity relationship (SAR) could also contribute to this phenomenon. For instance, some dyes with highly related structure can adopt a very different sized aggregate (Murugesan et al., 2018). The previous research also reported that aggregation can cause false positive results through promiscuous inhibition (Irwin et al., 2015). Other research on the topic suggests that aggregates have properties that can have serious impacts along the drug discovery pathway. For example, a systematic study showed that 95% of the hits from a high-throughput screen were eliminated as false-positives due to compound aggregates (Feng et al., 2007). However, studies thus far have just begun to correlate the existence of nano-entities with this promiscuity such as drug toxicity, and hyper-bioavailability. They can lead to nonspecific interactions with various proteins, and influence structurally and functionally unrelated proteins leading to unreliable false positive screening assays. In fact, some drug-like molecules inhibit many different enzymes. However, studies were performed on these mechanisms and there is still a population of nonspecific enzyme inhibitors which are poorly understood. It was previously discovered that unrelated promiscuous molecules share several unusual properties, such as
time-12
dependent behavior, steep inhibition curves, sensitivity to enzyme concentration and ionic strength. To account for this behavior, it has been suggested that these compounds share the capability of forming aggregates at micromolar concentrations in aqueous solution, and that the inhibiting of various enzymes is caused by these aggregate species (Seidler et al., 2003), leading to false positive “hits” in biochemical assays. Nonetheless, precisely how aggregates cause non-specific inhibition remains poorly understood. Possible mechanisms of action which elucidate aggregate-based inhibition are shown in (Figure 2).
Figure. 2. Proposed mechanism of inhibition and other properties of compound aggregates (Coan et al., 2009).
13
1.2 Detection methods of compound aggregation
Several computational methods and biophysical tests are currently used to detect small molecule aggregates in aqueous solution. One of the most common methods is enzyme-based inhibition assays such as lactate dehydrogenase, β-lactamase and chymotrypsin (Chan et al., 2009) that are widely used to identify aggregation by measuring the absorbance of enzymatic reaction products based on colorimetric change in solution. With the existence of aggregation and nonspecific protein inhibition, there could be alteration in the enzymatic reaction ratio and in reaction kinetics. In addition, the colorimetric changes give direct observation and readouts of enzymatic activity. However, the absorbance of small molecules can influence the absorbance output signal without respect for their potential aggregation. Other common methods including dynamic light scattering (DLS), a comparatively straightforward detection method currently used to evaluate the size of compound aggregates suspended in a solution by determining the time-dependent temporal fluctuations and scattering intensity (Chan et al., 2009). DLS could be sensitive to large aggregates but is less ideal for determining small entities, and some researchers believe that differentiating aggregates from precipitant using this assay is really difficult. Surface plasmon resonance (SPR) is another aggregate detection method has been recently used on an optical biosensor surface, SPR is more reliable compared with enzymatic inhibition or DLS methods due to its direct affinity measurement of the molecules observed.
Very recently, compound self-aggregations in aqueous media have been detected by using 1H
NMR-based assay through various dilution experiments. By using this assay, eliminating self-aggregate molecules from fragment screening libraries would be more straightforward. A high number of small molecules are affected by aggregation which exist more likely at high concentrations (LaPlante et al., 2013). As previously described, when a compound in aqueous media, it is assumed to adapt equilibria between three various phases including solid forms, soluble single molecules and soluble aggregate entities. Each individual phase of these three states can be
significantly identified by 1H NMR. It is noted that several compounds display normal 1H NMR
spectra, whereas others display unusual spectra. Moreover, NMR resonances could be either sharp or broad according to the tumbling aggregate behaviors of each state. A sharp NMR resonance is expected to be observed for soluble single molecules due to their fast-tumbling behaviors. On the other hand, solid forms that behave slow tumbling abilities can be also detected using NMR
14
spectrum but requires breaking the aggregates into smaller entities using detergents for detection purposes, (see Figure 3) (LaPlante et al., 2013).
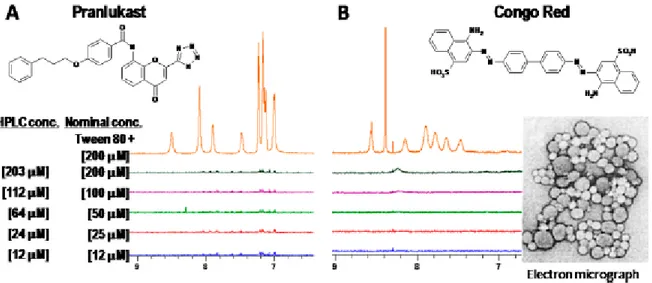
Figure 3 Examples of the application of the “detergent effect” Tween 80. Shown 1H NMR spectra
of two compounds Pranlukast and Congo Red in aqueous solution at various concentrations. The buffer employed for these studies was 50 mM sodium phosphate pH 7.4 in 100% D2O solvent, (LaPlante et al., 2013).
1.3 Hypothesis
The hypothesis of this study is that many types of drug nano-entities exist and are detectable. Also, several different types of drug and dye molecules undergo the aggregation process and have the ability to penetrate cells.
1.4 Objectives
1.4.1 Develop effective techniques for detecting the full range of nano-entities
We first develop a series of accessible and complementary aggregation assays and strategies. To do so, scientific tools must be systematically evaluated, with the goal of enabling the detection of the full range of nano-entity types and sizes. Because each technique has its strengths and “blind spots”, we intend to acquire data on a training set of compounds that are known to be either aggregators or non-aggregators. Furthermore, in order to properly observe and characterize the small-to-intermediate-sized aggregates, a variety of NMR tools have been explored (1H NMR
aggregation assays) that are amenable to high-throughput screening. Although not ideal, very large
15
addition of detergents. Other alternatives for directly observing large aggregates include dynamic light scattering techniques (DLS), which can report the sizes of large aggregates but are impractical for aggregate mixtures and small aggregates. Thus, because electron microscopy can provide detailed visual information on large aggregates (sizes and types), this approach has been employed for selected compounds.
1.4.2 Demonstrate the ability of small-molecule aggregation to penetrate cell membrane and investigate their effect on cell proliferation
Little is known of how aggregates enter the cell, although some hypotheses have been proposed. We run experiments to gain insight into how aggregates exist inside cells, the results of which should then shed light on their mechanism of action. This objective evaluated the impact of aggregates entering cells and nuclei or permeating membranes and affecting organelles. Toxicity response properties were also evaluated. Confocal microscopy was conducted to detect the fluorescent compounds aggregates. By applying this approach, we could see the aggregation inside cells, nuclei and cytoplasm.
16
17
2.1 Presentation of scientific article
The results in this research study illustrate that some dyes can exist as single molecules, whereas others can adopt aggregates in different sizes. In addition, dyes with highly related structures exhibit differently-sized aggregates, also show drug-dye interaction and how dye aggregates can affect drug solution behaviour. The results are presented in the form of a scientific article published in the February 21, 2018, edition of The Journal of Dyes and Pigments (volume 153, Pages 300-306, DOI.ORG/10.1016/j.dyepig), a periodical with an impact factor of 3.767.
2.2 Contributions of the authors
The research work presented in this scientific article was conducted by Jayadeepa R. Murugesan, Fatma Shahout and Marwa Dlim, which are students in Steven LaPlante's lab. Marwa Dlim was involved in several of the scientific and intellectual steps of the work. The first drafts of the Abstract, Introduction, and Materials and Methods sections were written by Marwa Dlim, who also contributed in prepared the figures, and participated in the electron micrograph (TEM) testing stage, NMR samples preparation and data acquisition. Dr. Pat Forgione of Concordia University participated in the preparation of this manuscript, reviewing most of the writing sections. Dr. Steven LaPlante supervised the work and contributed to the NMR analysis, the interpretation of the data, and the design of the figures.
Contents lists available atScienceDirect
Dyes and Pigments
journal homepage:www.elsevier.com/locate/dyepig
Revealing dye and dye-drug aggregation into nano-entities using NMR
Jayadeepa R. Murugesana, Fatma Shahouta, Marwa Dlima, M. Michele Langellab, Ernesto Cuadra-Foyb, Pat Forgioneb,∗∗, Steven R. LaPlantea,∗
aUniversité du Québec, INRS-Institut Armand-Frappier, 531, Boulevard des Prairies, Laval, Québec H7V 1B7, Canada bConcordia University, Department of Chemistry and Biochemistry, 7141 rue Sherbrooke O., Montreal, Québec H4B 1R6, Canada
A R T I C L E I N F O Keywords: Dye Drug Aggregation NMR Nano-entities Colloids SNR A B S T R A C T
It is becoming increasingly apparent that small molecules can self-assemble into a wide-range of nano-entities in solution that have intriguing properties. The recently introduced NMR aggregation assay is playing an important role in revealing these nano-entities. Here, we employ the NMR aggregation assay to expose the self-aggregation tendencies of dyes in solution. This dilution-based assay demonstrates that some dyes can exist as single-mo-lecule entities whereas others can adopt aggregates of distinct sizes. Interestingly, dyes with highly related chemical structures can adopt largely different sized aggregates - demonstrating the existence of structure-na-noentity relationships (SNR)– which suggests that they can assume and/or be designed to have distinct prop-erties. One property was evaluated where the drug Quetiapine (Seroquel) was added to the dye Congo red which resulted in the absorption of the drug into the dye nano-entity. This showed a direct drug-dye interaction, and it demonstrated that dye aggregates can have influences on drug solution behaviors. The NMR method described in this study provides a practical and valuable tool to monitor dye aggregates and to better understand their associated properties (e.g. toxicity, off-target activity) and potential utility (e.g. drug encapsulation, drug de-livery systems).
1. Introduction
Small molecules can assume a wide range of behaviors in solution that can be considered within the context of a tri-phasic equilibrium [1,2]. That is, when a compound is placed in aqueous solution it can equilibrate between at least three states (Fig. 1). Some of the molecules can exist as soluble, fast-tumbling lone molecules that are completely diffuse, whereas others can form solid precipitate(s), and others can self-associate and adopt intermediate soluble aggregates or nano-enti-ties. Notably, each compound likely has its own unique equilibrium signature and relative population among these states, and there is a critical dependence on many other factors such as buffer, co-solutes, etc.
The detection and quantification of a compound's signature equili-brium remains elusive to this day [2]. Whereas the solid precipitate phase is detected visually (or via a microsope forfibrils), the distinc-tions between the soluble lone-molecules and aggregate phases are not apparent. This is in part due to the limited detection methods available such as dynamic light scattering (DLS) [3]. DLS is a practical technique that can reveal the existence of large, micelle-like aggregates that are homogeneous. However, we recently introduced an NMR aggregation
assay that exposed a wide range of nano-entity sizes that can exist [1,2] especially small multimers, which are often undetectable by DLS.Fig. 1
shows how NMR is sensitive to compound tumbling rates and behavior for all three phases. That is, fast tumbling molecules exhibit sharp re-sonances (Fig. 1A), and solid precipitates result in extremely broad and unobservable resonances by solution NMR (Fig. 1D). Aggregates give rise to intermediate resonance attributes such as broad resonances and/ or unusual features such as those shown inFig. 1B and C. Thus, we chose to employ NMR in this study to explore the behavior of dyes in solution, which could then be a valuable tool to begin correlating with their properties. Here, we demonstrate that the NMR aggregation assay is a feasible method to explore the behavior of dyes in solution, which can then be a practical tool for correlating nano-entity properties. 2. Materials and methods
2.1. Compounds - dyes
The dyes and drug used in this study were all obtained from com-mercial vendors. The dyes and their CAS numbers are as follows: Azo Rubine (3567-69-9), Acid Blue 9 (3844-45-9), Erythrosin B
(16423-68-https://doi.org/10.1016/j.dyepig.2018.02.026
Received 11 August 2017; Received in revised form 11 February 2018; Accepted 16 February 2018
∗Corresponding author. ∗∗Corresponding author.
E-mail addresses:[email protected](P. Forgione),[email protected](S.R. LaPlante).
Dyes and Pigments 153 (2018) 300–306
Available online 21 February 2018
0143-7208/ © 2018 Elsevier Ltd. All rights reserved.
0), Allura Red (25956-17-6), Fast Green (2353-45-9), Erochrome Blue Black B (3564-14-5), Napthol Yellow (846-70-8), Sudan II (3118-97-6), Acid Violet (1694-09-3), Indigo carmine (860-22-0), Methylene blue (61-73-4), Tartrazine (1934-21-0), Solvent Orange 2 (2646-17-5), 4,4'-(9-Fluorenylidene)dianiline (15499-84-0), 4-((4-hydroxy-1-naphtha-lenyl)azo)benzenesulfonicacid, monosodiumsalt (523-44-4), Fast Green (2353-45-9), Quetiapine fumarate (111974-72-2). All were purchased from TCI whereas Acid Green (3087-16-9) and Patent Blue (3536-49-0) were purchased from Chem-Imp.
2.2. NMR sample preparation
Powder dyes were weighed and appropriate amounts placed in Eppendorf tubes followed by the addition of deuterated DMSO to form 20 mM dye stock solutions, as described inFig. 2. The buffer used for preparing the NMR samples was 50 mM sodium phosphate pH 7.4 in
100% D2O. When preparing the aggregation buffer, note that a pH of
7.8 corresponds to a pH of 7.4. Tween 80 stock (10% vol/vol in above buffer) was added to samples as defined in the procedure provided below. Further details on how samples were prepared are provided in
Fig. 2.
2.3. NMR experiments
The pulse programs for the NMR aggregation assay are the standard one-dimensional 1H NMR experiments available on all commercial spectrometers. There are several optional parameters that can be modified if desired. Given that the buffer consists of 100% D2O, one can
choose to use a standard1H NMR pulse program or one that includes solvent suppression. The latter may be desirable if large H2O resonance
peaks exist due to the hygroscopic property of deuterium oxide. The experiments shown here were run on a 600 MHz Bruker AV III NMR Fig. 1. Compounds can adopt a three-phase equilibrium when placed in aqueous media. On the bottom are1H NMR spectra (600 MHz) of various compounds in buffer (50 mM sodium
phosphate pH 7.4) at nominal concentrations of 200μM.
Fig. 2. Detailed procedure for preparing samples for the NMR aggregation assay [1,2].
J.R. Murugesan et al. Dyes and Pigments 153 (2018) 300–306
equipped with a sample changer. The number of scans was typically 256 scans, with a relaxation delay plus acquisition time of 2s, which ensured that all samples for each compound could be, acquired over-night using a sample changer. Data visualization and interpretation are also simple. For the work described here, Bruker's TOPSPIN software allows for the facile superposition of 1D NMR spectra along with zooming capabilities. Other software from ACD and other vendors also allow for spectral superpositions. Instant JChem for Office Version 18.3.0 was used for chemical structure handling, data analyzing, vi-sualizing and reporting capabilities within the Microsoft Office en-vironment Chemaxon (https://www.chemaxon.com) [4].
2.4. Electron microscopy
Congo red was diluted in DMSO with 50 mM sodium phosphate pH 7.4 in 100% D2O, and was prepared at 600μM. Briefly, 100 μL of the
sample was transferred into a 240μL Airfuge tube. A carbon coated copper grid was inserted into the bottom of Airfuge tube with fine tweezers and centrifuged for 5 min at 20 psi. With tweezers, the carbon grid was gently removed and washed with distilled water for 1 min. The carbon grid was then negatively stained with 3% of phosphotungstic acid (PTA-3) for 1 min. The grid was then removed and blotted to dry with a bibulous paper and examined with a transmission electron mi-croscope (Hitachi H-7100). The photographs were processed with the digital camera AMT version 600.147.
3. Results and discussion
3.1. Detection of aggregation using1H NMR spectra as a function of dye
concentration
The NMR aggregation assay involves the acquisition and monitoring of1H NMR spectra as a function of compound concentration. For single
molecules that do not aggregate, each dye molecule is distal to one another, tumbles freely and is not affected by dilution. Sharp re-sonances are expected at all concentrations and do not shift left or right. Also, there should be no changes in the number and shape of the re-sonances (Fig. 3). The only changes expected are the resonance in-tensities as a function of concentration. For dyes that aggregate the molecules self-associate at higher concentrations, upon dilution they become more distal and tumble more freely. As a result, unusual NMR features and changes are expected due to changes in local environments (Fig. 3).
3.2. NMR assay on structurally different dyes
Fig. 4displays the1H NMR spectra as a function of concentration for Tartrazine, Methylene blue and Congo red. An overview of the spectra for Tartrazine suggests that the data is consistent with the pre-dominance of the non-aggregating phase consisting of lone-molecules tumbling rapidly in solution. A single set of resonances exist which are sharp at all concentrations and are well-aligned (no shift left nor right). Furthermore, the addition of Tween 80 had no effect on the resonances intensities, which is expected in the absence of large, micellular ag-gregates. Electron microscopy also shows no signs of aggregates (Fig. 4).
Alternatively, Methylene blue and Congo red exhibit unusual spectral trends that are consistent with the observation of aggregates. Upon increasing the concentration of Methylene blue, the resonances shift significantly indicating changes in local environments upon self-association. These nano-entities are relatively small given the fact that resonances are observed, likely multimeric forms. This is in stark con-trast to the observations made for Congo red. No sharp resonances are readily observed at all concentrations, despite exhibiting full solubility (clear solution, precipitate-free). Thus, Congo red self-assembles into very large nano-entities that result in extremely broad, unobservable
resonances. A closer look at the 200μM concentration shows very broad peaks (vide infra), which become much sharper but nonetheless rela-tively broad upon addition of Tween-80. This latter observation sug-gests that Tween 80 partially breaks apart the Congo red aggregates into smaller entities that are finally observable as shown in Fig. 4. Congo red was also reported [5–7] to form large aggregates and here we show this by scanning electron microscopy (see electron micrograph on the top right ofFig. 4).
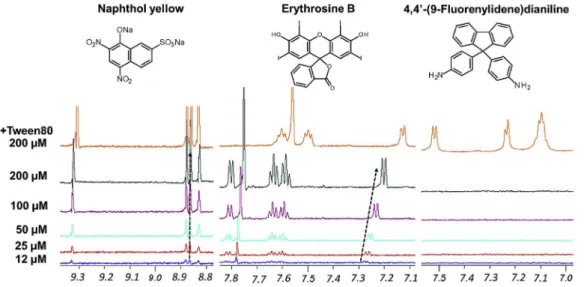
The scope of the current study was expanded to other classes of dyes, naphthol yellow S hydrate, Erythrosine B and 4, 4 ’-(9-fluor-enylidene) dianiline (Fig. 5). Naphthol yellow S (hydrate) exhibited sharp resonances with no shift changes upon increasing the con-centration, which is consistent with this dye behaving predominantly as a non-aggregator. For Erythrosine B and 4,4’-(9-fluorenylidene) diani-line, unusual features were observed in1H spectra of the NMR assay that were consistent with self-assemblies.1H NMR signals shifted right
at higher concentrations of Erythrosine B, and resonances of 4,4’-(9-fluorenylidene)dianiline were only notable upon addition of Tween 80. Other types of dyes were also evaluated (see Supporting Information,Figs. S1–S2). For example,Fig. S1shows that Acid blue 9, Evans blue, and Indigo carmine also form distinct types of nano-enti-ties. In the spectra of Acid blue 9, the1H NMR signals appear as
ex-pected for a non-aggregator, except that additional small resonances appear at higher concentrations. More apparent and unusual features are noted in the spectra of Evans blue and Indigo carmine.
3.3. NMR assay on structurally similar dyes - Triarymethane class We next explored the aggregation tendencies of a series of similar compounds. Overall, it was noted that dyes of the same class with subtle structural differences can show completely different aggregation ten-dencies. This is exemplified in Fig. 6 for three triarylmethane dyes (Patent blue, Light green SF yellowish and Acid violet 49). On one hand, the spectra of the Patent blue appears such that no aggregation is observed since no changes in the resonance number, shape and che-mical shift occurs at the various concentrations. However, the spectra of Light green SF yellowish and Acid violet 49 display notable unusual trends. The resonances of Light green SF Yellowish exhibit shifts and the presence of two sets of peaks, which is indicative of the presence of more than one type of aggregate species. Broad resonances are observed for Acid Violet 49. Thesefindings are consistent with the literature of cyanine dyes that are reported to adopt J and the H aggregates (bath-ochromic shift and hyps(bath-ochromic shift in the absorption spectra, re-spectively) [8].
Perhaps the latter two dyes tend to aggregate as a result ofπ-π stacking interactions of the planar solvophobic aromatic rings [9], whereas Patent blue has the tetrahedral sulfonate groups in both the ortho and para positions of a phenyl ring that could prevent suchπ-π interactions. For Light green SF yellowish and Acid violet 49, the sub-stituents are far away from the aromatic system (para) which may minimize steric influences and allow self-assembly.
3.4. NMR assay on structurally similar dyes - Azo dyes with one phenyl and one naphthyl and bis-naphthyl group
The aggregation tendencies of another series of structurally related dyes was explored to see if the above observations were specific to one series or general.Fig. 7displays the NMR data for three structurally-related azo dyes (Sunset yellow, Allura red and Orange II). In this case, all three compounds have unusual1H NMR spectral tendencies. The resonances of Sunset yellow are sharp but shift as a function of higher concentration– which is consistent with the existence of small nano-entities and literature reports using other spectroscopic studies [10–12]. For Allura red, the spectra contain both sharp and broad re-sonances indicating the presence of a mix of multiple aggregate types. On the other hand, the spectra for Orange II are consistent with the
J.R. Murugesan et al. Dyes and Pigments 153 (2018) 300–306
presence of very large nano-entities given that resonances only become apparent upon the addition of detergent. Clearly, these results suggest that structure-aggregate relationships exist and that the sulfonate an-ions play a more complex role beyond the simple expectation of en-hancement of solubility [13].
The structure-aggregation relationships exposed above was then expanded to the structurally similar bis-naphthyl azo dyes that also have a different number of sulfonate anions.Fig. 8reports the1H NMR
spectra of Acid red 18, Amaranth and Eriochrome blue black B. A single set of resonances of Acid red 18 are observed and sharp throughout the concentration range, although there are some notable resonance shifts at higher concentrations. More dramatic shifts are found for Amaranth that is a regioisomer of Acid red 18. Perhaps the less pronounced
aggregate behavior is notable for Acid red 18 due to a suppression of π-π stacking interactions given the proximity of the sulfonate groups to both naphthyl rings, as compared to Amaranth where the sulfonate anions lie at the periphery of the rings. The spectra of Eriochrome blue black B have truly unusual features with many sharp resonances that are inconsistent with a single species.
3.5. Dye-drug interactions
Dyes are used in a wide range of applications, including foods, drinks, cosmetics, tooth paste, medications. etc., Thus, a question worth addressing is whether dyes can interact directly with medical drugs that are also highly prescribed in our society. If so, there may be a potential Fig. 3. Overview of the expected observations of NMR spectra and resonances upon dilution for dyes that aggregate versus those that do not in solution.
Fig. 4. NMR aggergation assay showing1H
NMR spectra of three structurally different dyes obtained by dilution from 200μM to 12μM. Data displayed for Tartrazine (left), Methylene blue (middle) and Congo red (right). The insets on the top-right and left are electron micrographs of Congo red and Tartrazine in solution, respectively. (For in-terpretation of the references to color in this figure legend, the reader is referred to the Web version of this article.)
J.R. Murugesan et al. Dyes and Pigments 153 (2018) 300–306
that dyes can compromise the intended medical use of certain drugs. Unfortunately, there have been few reports on drugs and other che-micals interacting with dyes to produce undesired effects [14], and as a result a detailed molecular view is lacking.
To illustrate how potential interactions can be studied using NMR, Congo red was added to Quetiapine and the NMR spectrum observed. Quetiapine is an antipsychotic drug used for the treatment of schizo-phrenia and bipolar disorder. The NMR spectrum of Quetiapine alone in
Fig. 9shows sharp resonances that are consistent with a non-aggregator behavior in solution. Congo red, which was used in the cellulose in-dustry before it was banned for toxicity reasons, exhibits very broad resonances inFig. 9that is consistent with a behavior as an aggregator in solution. When mixed together, the broad resonances of Congo red remain whereas the resonances of Quetiapine become significantly broad. Based on this, it is apparent that Quetiapine interacts with Congo red and adopts its slow tumbling behavior as an aggregate. It also shows the potential impact that aggregates can have on other small molecules. Moreover, this provides a new tool for studying drug-dye or drug-drug interactions.
3.6. Discussion on dyes, solution behavior and properties
Dyes play an important role in our society, and are used in many products. They are produced in extremely large quantities world-wide for applications in various industries. For example, the clothing in-dustry employs dyes to enhance marketability of their products. Also, the food industry employs color to enhance the attractiveness of their products. As a result, consumers are heavily exposed to small-molecule dyes that are worn and ingested, despite the fact that relatively little is known about their in vivo behavior, properties and toxicity. The impact on the environment is also significant. Effluents from the dye industry are eventually discharged into the environment as pollutants. Some can be readily degraded, but others, such as azo dyes are persistent as a result of their lipophilic nature. When the latter is degraded, azo dyes are well known to be susceptible to anaerobic reduction, releasing amines and hydrazine that can be carcinogenic [15]. Thus, dyes are highly prevalent in our society and their properties need to be in-vestigated with appropriate tools.
Here, we introduce an NMR aggregation assay and found that some dyes tend to behave as lone single molecules in solution whereas others adopt nano-entity features. It is interesting that we also demonstrated Fig. 5. NMR aggergation assay showing1H
NMR spectra of three structurally different dyes obtained by dilution from 200μM to 12μM. Data displayed for Naphthol yellow (left), Erythrosine B (middle) and 4,4’-(9-fluorenylidene)dianiline (right). (For inter-pretation of the references to color in this figure legend, the reader is referred to the Web version of this article.)
Fig. 6. NMR aggergation assay showing1H NMR spectra of three structurally similar triarylmethane dyes obtained by dilution from 200μM to 12 μM. Patent blue (left), Light green SF
yellowish (middle) and Acid violet 49 (right). (For interpretation of the references to color in thisfigure legend, the reader is referred to the Web version of this article.)
J.R. Murugesan et al. Dyes and Pigments 153 (2018) 300–306
that minor chemical changes can result in major differences in solution behavior. Our previous work [2], suggested that these solution beha-viors can have a serious impact on properties (e.g. toxicity) so it is reasonable that dyes having different behaviors can also have distinct properties. This NMR assay now provides a new tool for monitoring the behavior of dyes in solution, and can begin to explore potential
correlations with relevant properties.
Correlating nano-entities to specific dye properties will certainly prove to be difficult or even impossible. However, it is tempting to hypothesize that aggregate-property relationships can exist. For ex-ample, the aggregation property of an HIV drug has been directly at-tributed to its high and favorable oral bioavailability [16]. Also, Fig. 7. NMR aggergation assay showing1H NMR spectra of three structurally similar azo dyes obtained by dilution from 200μM to 12 μM. Sunset yellow (left), Allura red (middle) and
Orange II (right). (For interpretation of the references to color in thisfigure legend, the reader is referred to the Web version of this article.)
Fig. 8. NMR aggergation assay showing1H NMR spectra of three structurally similar bis-napthyl azo dyes obtained by dilution from 200μM to 12 μM. Acid red 18 (left), Amaranth
(middle), and Eriochrome blue black B (right). (For interpretation of the references to color in thisfigure legend, the reader is referred to the Web version of this article.) Fig. 9. Shown are NMR spectra of the drug Quetiapine and the dye Congo red.1H NMR spectrum of Quetiapine alone (purple above) at
200μM.1H NMR spectrum of 50/50 mixture of Quetiapine and
Congo red at 200μM each (red spectrum, middle) and1H NMR of
Congo red alone at 200μM (Blue, bottom spectrum). Note that the broad peaks observed here for free Congo red are less notable in the spectrum of free Congo red inFig. 3because the vertical scale is much lower. Samples were prepared in 50 mM sodium phosphate buffer pH 7.4 in 100% D2O solvent. (For interpretation of the
re-ferences to color in thisfigure legend, the reader is referred to the Web version of this article.)
J.R. Murugesan et al. Dyes and Pigments 153 (2018) 300–306
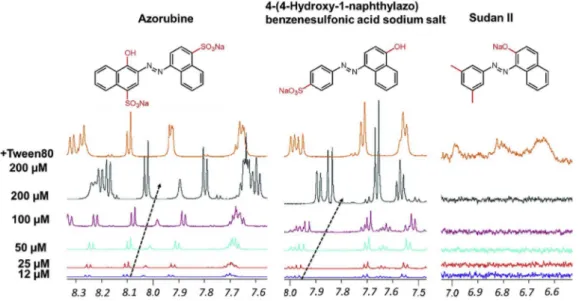
aggregates have been associated with affecting the efficacy of cancer drugs [17,18]. In a 2007 conference in Southampton UK, the use of six dyes (Tartrazine, Sunset Yellow, Allura Red, Acid Red 18, Azorubine and Quinoline Yellow WS) was questioned because they were suspected of causing food intolerance and exasperating attention deficit hyper-activity disorder (ADHD) in children [19]. Interestingly, this study showed that four of the six dyes exhibit nano-entity properties. For example, Azorubine clearly aggregates in our assay as shown inFig. 10. Other potential properties of dyes are beginning to become evident. For example, some artificial coloring agents appear to aggravate attention deficit hyperactivity disorder (ADHD), and it has been established that erythrosine-based food coloring can cause thyroid tumors in rats. Al-though little is known about the precise mechanism of toxicity of some dyes, many have been banned (e.g. 42 benzidine and 70 azo dyes) [20]. 4. Conclusion
Here we introduced the NMR aggregation assay as a new tool for monitoring the behavior of dyes in solution. One potential utility of this tool is to explore potential correlations with relevant properties. On one hand, we know that dyes have a variety of properties where some are benign and others are toxic and have been banned from human con-sumption. On the other hand, we also now know that some dyes can have a variety of aggregate behaviors, and aggregates have been shown to exhibit promiscuous properties and even toxicity. Although focused studies will be needed to properly establish behavior-property corre-lations, the NMR methods shown here may be a good method to pro-vide new insights.
Funding
The authors declare no competingfinancial interest. Acknowledgments
The authors wish to acknowledge Anne-Laure Larroque and Sanjoy Kumar-Das of the McGill University Health Centre (MUHC) for kindly providing 600 MHz NMR time. They also thank Norman Aubry and Rebekah Carson for helpful discussions and insight. Technical support was provided by Sagar Saran and Paul Oguadinma.
Appendix A. Supplementary data
Supplementary data related to this article can be found athttp://dx. doi.org/10.1016/j.dyepig.2018.02.026.
References
[1] LaPlante SR, Aubry N, Bolger G, Bonneau P, Carson R, Coulombe R, et al. Monitoring drug self-aggregation and potential for promiscuity in off-target in vitro pharmacology screens by a practical nmr strategy. J Med Chem 2013;56:7073–83.
http://dx.doi.org/10.1021/jm4008714.
[2] LaPlante SR, Carson R, Gillard J, Aubry N, Coulombe R, Bordeleau S, et al. Compound aggregation in drug discovery: implementing a practical NMR assay for medicinal chemists. J Med Chem 2013;56:5142–50.http://dx.doi.org/10.1021/ jm400535b.
[3] Coan KED, Shoichet BK. Stoichiometry and physical chemistry of promiscuous ag-gregate-based inhibitors. J Am Chem Soc 2008;130:9606–12.http://dx.doi.org/10. 1021/ja802977h.
[4] https://chemaxon.com/.
[5] McGovern SL, Caselli E, Grigorieff N, Shoichet BK. A common mechanism under-lying promiscuous inhibitors from virtual and high-throughput screening. J Med Chem 2002;45:1712–22.http://dx.doi.org/10.1021/jm010533y.
[6] Heger D, Jirkovský J, Klán P. Aggregation of methylene blue in frozen aqueous solutions studied by absorption spectroscopy. J Phys Chem A 2005;109:6702–9.
http://dx.doi.org/10.1021/jp050439j.
[7] Al-Thabaiti SA, Aazam ES, Khan Z, Bashir O. Aggregation of Congo red with sur-factants and Ag-nanoparticles in an aqueous solution. Spectrochim Acta Part A Mol Biomol Spectrosc 2016;156:28–35.http://dx.doi.org/10.1016/j.saa.2015.11.015. [8] Zhang Y, Xiang J, Tang Y, Xu G, Yan W. Aggregation behaviour of two
thiacarbo-cyanine dyes in aqueous solution. Dyes Pigments 2008;76:88–93.
[9] Zhegalova NG, He S, Zhou H, Kim DM, Berezin MY. Minimization of self-quenching fluorescence on dyes conjugated to biomolecules with multiple labeling sites via asymmetrically charged NIRfluorophores. Contrast Media Mol Imaging 2014;9:355–62.http://dx.doi.org/10.1002/cmmi.1585.
[10] Horowitz VR, Janowitz LA, Modic AL, Heiney PA, Collings PJ. Aggregation beha-vior and chromonic liquid crystal properties of an anionic monoazo dye. Phys Rev E - Stat Nonlinear Soft Matter Phys 2005;72.http://dx.doi.org/10.1103/PhysRevE. 72.041710.
[11] Edwards DJ, Jones JW, Lozman O, Ormerod AP, Sintyureva M, Tiddy GJT. Chromonic liquid crystal formation by edicol sunset yellow. J Phys Chem B 2008;112:14628–36.http://dx.doi.org/10.1021/jp802758m.
[12] Chami F, Wilson MR. Molecular order in a chromonic liquid crystal: a molecular simulation study of the anionic azo dye sunset yellow. J Am Chem Soc 2010;132:7794–802.http://dx.doi.org/10.1021/ja102468g.
[13] Ishiyama M, Shiga M, Sasamoto K, Mizoguchi M, He P. A new sulfonated tetra-zolium salt that produces a highly water-soluble formazan dye. Chem Pharm Bull (Tokyo) 1993;41:1118–22.http://dx.doi.org/10.1248/cpb.41.1118.
[14] Swerlick RA, Campbell CF. Medication dyes as a source of drug allergy. J Drugs Dermatol 2013;12:99–102.
[15] https://www.epa.gov/assessing-and-managing-chemicals-under-tsca/pigment-violet-29-anthra219-def6510-defdiisoquinoline-0.
[16] Boutajangout AM, Sigurdsson EK, Krishnamurthy P. Tau as a therapeutic target for Alzheimer's disease. Curr Alzheimer Res 2011;8:666–77.http://dx.doi.org/10. 2174/156720511796717195.
[17] Frenkel YV, Clark AD, Das K, Wang YH, Lewi PJ, Janssen PAJ, et al. Concentration and pH dependent aggregation of hydrophobic drug molecules and relevance to oral bioavailability. J Med Chem 2005;48:1974–83.http://dx.doi.org/10.1021/ jm049439i.
[18] Owen SC, Doak AK, Wassam P, Shoichet MS, Shoichet BK. Colloidal aggregation affects the efficacy of anticancer drugs in cell culture. ACS Chem Biol 2012;7:1429–35.http://dx.doi.org/10.1021/cb300189b.
[19] https://www.food.gov.uk/science/additives/foodcolours. [20] https://www.ncbi.nlm.nih.gov/books/NBK304402/.
Fig. 10. Portions of the superimposed1H
NMR spectra of three structurally similar azo dyes obtained by dilution from 200μM to 12μM. Azorubine (left), 4-(4-hydroxy-1-naphthylazo)benzenesulfonic acid sodium salt (middle) and Sudan II (right),1-(2,4-di-methylphenylazo)-2-naphthol. Broken ar-rows indicate changes in chemical shift (δ ppm) with concentration. NMR samples were prepared in 50 mM sodium phosphate buffer pH 7.4 in 100% D2O solvent.
J.R. Murugesan et al. Dyes and Pigments 153 (2018) 300–306
25
2.3 SUPPORTING INFORMATION
The NMR aggregation was employed to other dyes and the displays of the NMR data are shown
below as Figures S1 and S2.
Figure S1. Portions of the superimposed 1H NMR spectra of three structurally different dyes obtained by dilution from 200 µM to 12 µM. Acid blue 9 (left), Evans blue (middle), both medium-sized and Indigo carmine (right). Broken arrows indicate changes in chemical shift (δ ppm) with concentration. NMR samples were prepared in 50 mM sodium phosphate buffer pH 7.4 in 100% D2O solvent.
26
Figure S2. Portions of the superimposed 1H NMR spectra of Acid Green 50 (left) and Fast Green (right) dyes obtained by dilution from 200 µM to 12 µM. Broken arrows indicate changes in chemical shift (δ ppm) with concentration. NMR samples were prepared in 50 mM sodium
27
28
3.1 Contributions of the authors: A significant portion of this work was carried out by M.D. and F.S., as they contributed equally in terms of design the experiments, sample preparation, cell culture and data acquisition with assistance from M.K. M.D. also helped write the manuscript. S.L. contributed the hypotheses/concepts of the manuscript, supervised the research, interpreted data and helped write the manuscript. P.L. performed some data analysis with input from all authors.
29
3.2
Revealing Drug Nano-entities
Marwa Dlim,1,2 Fatma Shahout,1,2 Marwa Khabir,1 Patrick Labonte,1 Steven R. LaPlante1*
1 Institut National de la Recherche Scientifique, Center Institut Armand-Frappier, Université du Québec,
CANADA
2 These scientists contributed equally to this work and are regarded as both being first authors.
: A compound’s aqueous properties are
certainly influenced by the nature of its unique equilibria between single lone-tumbling molecules, self-associated aggregates (nano-entities) and solid forms. It is therefore surprising that there is yet no comprehensive and effective strategy for correlating a compound’s properties with its physicochemical and nano-entity behavior in solution. Perhaps a better understanding of the equilibria can provide
some insight into unexpected properties of many drugs when placed in aqueous conditions. Here, we use several anticancer drugs (Sorafenib, Lapatinib, Gefitinib and Fulvestrant) and an antileprosy drug (Clofazimine) as model systems to better understand their physicochemical behavior and self-association properties. We explore various techniques modeling a combination of NMR, DLS, electron and confocal microscopies to probe their three-state equilibria and behaviors in buffers, media and cells. These drugs were found to self-associate into relatively large nano-entities having distinct types and sizes that depend on the media. Furthermore, these compounds were capable of entering cells. Noteworthy advantages and “blind spots” were
30
observed for the various detection techniques employed. Overall, we found that a combination of methods is necessary to expose these drugs’ elusive solution equilibria.
The drug discovery community has recognized that the physicochemical attributes of compounds
can somehow predispose them to many properties.1-9However, the majority of pharma workflows
focus on prioritizing compound candidates that exhibit selected favorable properties, and deprioritizing those that have specific undesirable properties, without extensively characterizing their three-state equilibria and associated physicochemical attributes of candidate drugs in aqueous solution. It is becoming more apparent that each compound exists in a unique three-phase equilibrium between single lone-tumbling molecules, self-associated aggregates (nano-entities), and solid forms. Notably, the equilibria and nano-entity attributes and properties vary depending on media which contributes to rich and varied natural phenomenon but also complicates characterization efforts. Thus, it is both interesting and perplexing that the three-state equilibria, and related properties, remain relatively unexplored.
The importance of having insight into a compound’s three-state equilibrium can, for example, help predict its tendency to be promiscuous and likelihood of toxicity.10 These latter properties represent one of the most significant challenges in drug discovery - to date we are still unable to foresee whether or not a medicament will be safe for human consumption despite highly sophisticated rational design efforts.8, 11-18 Nonetheless, important advances have been made in
establishing a qualitive correlation between some physicochemical attributes of toxicity
outcomes.10It has become common knowledge that although high lipophilicity of drug candidates
can serve to improve potency, it also increases its likelihood of resulting in adverse in vivo toxicology outcomes. Thus, drug design efforts must qualitatively consider a compound’s physicochemical properties, and therefore strive to find a fine balance with regards to the impact of lipophilicity. To do so, a simplistic state-of-the-art tool employed by medicinal chemists is to follow a set of probabilistic guidelines based on an evaluation of a compound’s physicochemical attributes from calculated partition coefficient (cLogP) and total polar surface area (TPSA).11, 19
Certainly, a more evolved view of a compound’s physicochemical properties is wanting, along with improved experimental strategies, to better understand how a compound’s physicochemical properties can influence and predispose it to salient properties such as off-target outcomes. To begin, a simplistic view could be that more lipophilic compounds tend to be more
31
promiscuous by their attraction to hydrophobic off-target receptors.7 Simply stated, “stickier”
compounds can bind non-specifically to “sticky” hydrophobic receptor pockets either in a stoichiometric mode of off-target inhibition (1:1 ligand to target molecule) or nonstoichiometrically (≫1:1 ligands to target). This “sticky” attribute can also contribute to a compound’s tendency to self-associate in aqueous solution into aggregates, also referred to as colloids or nano-entities. However, lipophilicity alone does not explain the nature of a
compound’s three-state equilibrium and related properties.10
In fact, little is known about the types and range of sizes of self-assemblies that small molecules can adopt, although micelle-like colloids have been reported and recently much smaller nano-entities have also been observed.10, 20 It is likely that a wide range of sizes and types exist,
but detection strategies are lacking and must be developed, which explains in part our poor
knowledge of this phenomenon and elusive properties.21-26 However, progress is being made to
reveal some properties which have been implicated, for example, in promiscuity in high-throughput screens (false positives),21-23false negatives in cell culture assays due to lack of cell
membrane permeability,27 correlation with off target pharmacology10 and as having exceptional
oral bioavailability.28, 29
To date, no single technology can detect the full range of nano-entities that can exist, but each technology has its advantages and limitations. For example, dynamics light scattering (DLS) and transmission electron microscopy (TEM) are sensitive to large homogeneous assemblies (e.g. nanometer size) but are less optimal for small entities and mixtures. NMR spectroscopy, on the other hand, is highly sensitive to small- to medium-sized aggregates (Ångstrom to sub-nanometer sizes). This technology can also be used to detect large aggregates although it requires breaking the aggregates into smaller entities using detergents for detection purposes. Also, confocal laser scanning microscopy (CLSM) can be employed to monitor drugs in cells, but the compounds must be fluorescent and forms sufficiently large assemblies (greater than nanometer sizes). Other
potential detection methods can also be used such asnephelometry, SPR, MST, DOSY NMR and
CPMG NMR.
Here, we use several anticancer drugs (Sorafenib, Lapatinib, Gefitinib and Fulvestrant) and an antileprosy drug (Clofazimine) as model systems to explore various techniques for monitoring their physicochemical solution behavior. We evaluate data from NMR, DLS, TEM
32
and CLSM to characterize the nano-entities formed and to probe the strengths and limitations of the methods. It should be kept in mind that the present study focuses on compounds that only form the large micelle-type aggregates. Studies involving the smaller nano-forms are referred to an early report and to forthcoming disclosures.10, 20
A typical workflow practiced in the pharmaceutical industry is one where medicinal chemists synthesize new compounds based on design concepts intended to capture a range of intended favorable properties, e.g. binding and specificity for a target protein, bioavailability, stability and safety. Medicinal chemists almost exclusively characterize their candidate drugs in organic solvents, then lyophilize and expedite the powders or stock solutions to multiple other laboratories for a broad range of pharmaceutical tests where the compounds are dissolved in or diluted with aqueous media. However, drugs behave much differently in organic solvents as compared to aqueous media, and thus the above workflow introduces an important and uncharacterized disconnect. That is, no one along the workflow is responsible for monitoring a compound’s aqueous behavior in solution – thus, the three-phase equilibrium systematically goes unexplored.
This is unfortunate because a simple and quick perusal of the 1H NMR spectrum of a compound in buffer can easily begin to expose features of its three-state equilibrium.20 This is
illustrated in Figure1 for the four compounds (Sorafenib, Lapatinib, Gefitinib and Clofazimine).
These compounds were first placed in organic DMSO-d6 solvent at 200 M concentration where it was noted that they dissolved well - clear solutions with no observable precipitate. These stock samples were then transferred to NMR tubes and 1H NMR spectra acquired, respectively, as
shown in Figure1a. This atomic view of hydrogen nuclei shows that all resonances are observable
33
Figure 1. NMR spectra of four compounds. (a) Compounds in DMSO-d6 solvent at 20 mM concentration,
(b) Compounds in buffer at 20 mM (after mild centrifugation. Then collection of the supernatant) (c) Compounds plus Tween 80 detergent, (d) DLS data of the four compounds employed was in 50 mM sodium phosphate buffer, 100 mM NaCl, 10% D2O, pH 7.4 in the absence and presence of 0.025% Tween 80 at 24 hrs. Size measured after 24 hrs incubation by DLS (ranged from 200 nm-500 nm).
Samples of these compounds at 200 M in aqueous buffer were then prepared by placing aliquots of DMSO-d6 stock solutions into aqueous buffer followed by gentle agitation. Some cloudiness or solid precipitate were noted so the samples were subjected to light centrifugation. The
supernatant was then placed in NMR tubes and 1H NMR spectra acquired. Figure 1b shows that
no NMR resonances were observed. It is possible that the compounds totally existed as a solid-state form and were removed by this latter manipulation. Even if some solid remained as a cloudiness, the resonances of solids are too broad to be observed by solution NMR. Another possible explanation would be that the compounds partitioned between precipitates and very large self-associated and soluble aggregates. The latter would have to tumble too slowly in solution which would also result in resonances that are too broad to be observed by solution NMR. Interestingly, we showed in a previous report that a simple trick of adding a detergent such as Triton or Tween to the samples induced the breakup of the large aggregates, resulting in faster tumbling lone molecules, which then gave rise to observable NMR resonances. To our surprise,
the addition of detergent to the Sorafenib sample did not give rise to sharp resonances (see Figure
34
The latter observations unequivocally report the existence of the large aggregates. However, the lack of resonances for Sorafenib demonstrates our limited knowledge of aggregate types and how to manipulate and observe them by NMR. Interestingly, DLS data acquired on the aqueous samples, after light centrifugation, clearly showed existence of the nanometer sized aggregates
(see Figure 1d). The DLS data of these samples after the subsequent addition of detergent report
differential changes in aggregate sizes, which demonstrated the potential complementarity of NMR and DLS techniques.
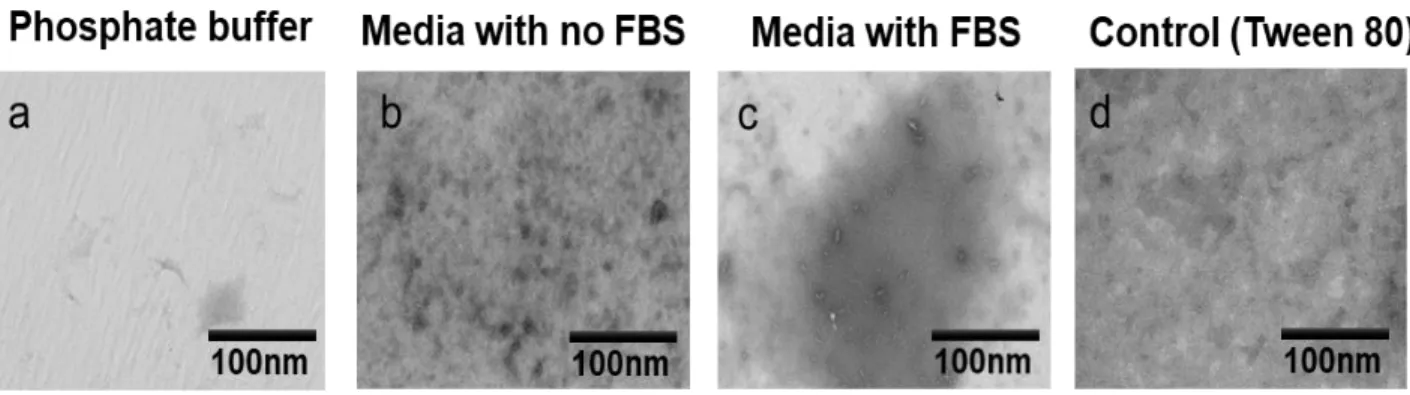
TEM also convincingly revealed the presence of very large aggregates in various media
such as DMEM with 5% fetal bovine serum (FBS) (see Figure 2a), cell culture media (DMEM)
without (FBS) (see Figure 2b), and aqueous phosphate buffer (see Figure 2c). First, it must be
kept in mind that the samples were prepared by soaking the samples with a carbon-coated copper grid which is required for TEM observation purposes. Also, it is expected that lone-tumbling single molecules (tumbling radius on the single digit Ångstrom scale) would be invisible by TEM which is sensitive to species that have radii on the double digit nanometer scale. Keeping these considerations in mind, a number of observations can nonetheless be made for charactering these intriguing and large nano-entities observed (see Figure2).
Interestingly, a comparison of the horizontal images (Figure 2c) shows a variety of large
aggregates for the drugs in buffer. Some are smaller such as that found for Clofazimine whereas very large globs are noted for Fulvestrant, Sorafenib and Lapatinib. A range of sizes is also noted. Gefitinib appears as a solid-like form. Changes in the aggregates are notable when the compounds
are soaked in DMEM media – compare Figure 2a with 2b. Likewise, dramatic changes are
35
Figure 2. TEM images of four aggregating anti-cancer drugs (Sorafenib, Lapatinib, Gefitinib, Fulvestrant),
and an aggregating anti-leprosy drug (Clofazimine), (a) Approximately 50 µM of the specified compounds were dissolved and individually incubated for 24 hrs in DMEM 5% FBS, or (b) DMEM with no 5% FBS, or (c) phosphate buffer with pH 7.4. Bars represent 100 nm. We tested another compounds in phosphate buffer and cell culture media as well as the controls as shown in the Figures S1 and S2 in the Supporting Information). DMEM contains a phenol red, glucose, L-glutamine, fetal bovine serum (FBS) and penicillin antibiotic.
We then studied the effect of adding detergent to large nano-entities. The addition of detergents to samples suspected of forming large aggregates is a widely used strategy in many biochemical assays to reveal false positive hits in screening campaigns. One typically runs screening campaigns to identify lone-tumbling compounds that inhibit a protein, but these assays are frequently contaminated with false-positive hits from compounds that form large aggregates
36
typically involves the addition of a detergent, which presumably breaks up drug aggregates, and results in the loss of false-positive inhibition.
We thus explored the effect of the addition of detergents on the aggregates of the drugs
studied here (see Figure 3a). The TEM images shown in Figure 3a for Sorafenib, Lapatinib and
Clofazimine (in the absence of detergent) clearly display large aggregates. Upon addition of
0.025% Tween 80 detergent, the TEM images in Figure 3b show that these large aggregates are
seriously altered and disrupted. Taking the 1H NMR experiments in Figure 1 into account, it is
clear that addition of detergent breaks the aggregates into very small tumbling entities for
Lapatinib and Clofazimine, which is consistent with the TEM changes in Figure 3b. However,
small entities were not observed for Sorafenib upon addition of detergent whereas the TEM data clearly shows disruption of the large aggregates. Therefore, the example of Sorafenib demonstrates that there might be aggregate types that NMR and TEM simply cannot detect.
Figure 3. (a) TEM images of 50 µM Sorafenib, Lapatinib and Clofazimine, after incubation for 24 hrs at
37 °C in DMEM 5% FBS in the absence of 0.025% Tween 80. (b) TEM images of these compounds in the presence of Tween 80. Bar represent 100 nm.
The subfield of drug self-assemblies has always been full of assumptions and dogma. Two notable contention assumptions are that compound aggregates cannot exist in plasma nor be able
37
to cross membranes to enter cells.30 The former assumption has often been rationalized based on
the observations that typical drug compounds are formed to be highly serum-bound in vivo 31 low
free-state concentrations. Given this, the majority of a compound would be expected to be bound to serum proteins such as albumin, leaving compounds mostly unavailable to self-associate. This assumption is unfounded. In a previous study, involving an NMR aggregation test, it was clearly shown that aggregating compounds remained self-associated in a range of pharmacology buffers, plasma and blood. This would suggest that there is a significant affinity for self-association for
some compounds.10
Regarding the latter assumption, we set out here to identify tools that can help determine if aggregating compounds can cross membranes and enter cells. For this, we explored the use of confocal laser scanning microscopy (CLSM). First, one must realize and consider that all the methods used here make observations at very distinct resolutions. NMR makes measurements at the atomic level or Ångstroms, whereas TEM and DLS resolve particles at the nanometer scale, and CLSM at the micrometer level. Thus, CLSM is the most appropriate method for observations at the cellular level. However, to render a compound observable by CLSM, it must inherent fluorescence, so we were limited in the compounds that could be studied – so potential compounds were pre-screened by a standard fluorescent microscope.
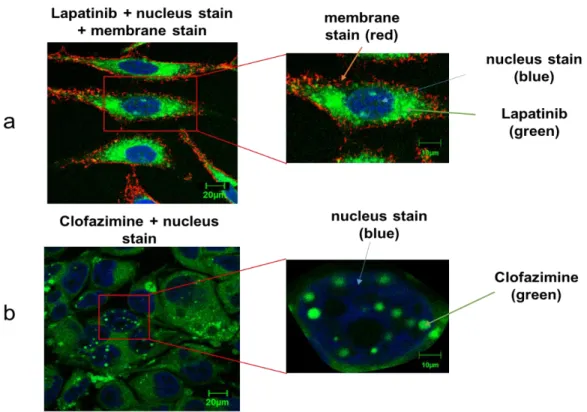
We began this study by the incubation of HeLa cells in the presence of Lapatinib at 50 µM
for 24 hours and acquired CLSM views (see Figure 4a). Views from a range of other
concentrations, conditions and compounds are provided in the Supporting Information, along with
a description of the procedures employed and experimental information. Figure 4a shows that the
green fluorescent of Lapatinib indeed had entered the cell and appears mostly localized to the
cytoplasm. Note that the cell membrane and nuclei can be visualized (see Figure 4a) based on the
red and blue dyes Alexa Fluor® 555 conjugate of WGA and DRAQ5™, respectively, which are well-known markers. Interestingly, Lapatinib appears to be well-distributed within the cytoplasm given that green fluorescence is observed for all the cytoplasm.
This is certainly distinct from the observations for Clofazimine. Clofazimine was
incubated with Huh-7 cells for 1 hour (see Figure 4b) (a range of other concentrations, conditions
were also tested and are shown in the Supporting Information Figure S8). Although Figure 4b
38
signals arising from the nucleus. Note that the nuclei can be visualized (see Figure 4b) based on
the blue dye DAPI, but the cell membrane cannot be easily distinguish given that no Alexa Fluor® 555 conjugate of WGA dye was added in this experiment due to signal interferences. In order to verify that the compound aggregates were occurring intra- and not extra-cellularly, care was taken to wash the cells after the incubation step. They were washed twice in phosphate-buffered saline (PBS) to remove any existing extracellular aggregates, and fresh DMEM 5% FBS were added to the cells.
Figure 4. (a) Confocal images of HeLa cells incubated in the presence of 50 µM Lapatinib aggregates for
24 hrs at 37 °C, Alexa fluor WGA 555 was used to stain and indicate cell membranes, DRAQ5™ was used to stain the nucleus. Bar represents 20 µm. (b) CLSM images of Huh-7 cells incubated in the presence of 20 µM Clofazimine treatment for 1 hr at 37 °C fluorescence of intracellular Clofazimine aggregates. DAPI was used to stain the nucleus. Bar represents 20 µm.
It is interesting that Clofazimine is considered as a lipophilic antibiotic which has very
long pharmacokinetic half-life reach up to 70 days.32 Others have noted that Clofazimine
![Fig. 2. Detailed procedure for preparing samples for the NMR aggregation assay [1,2].](https://thumb-eu.123doks.com/thumbv2/123doknet/5003809.124596/19.892.192.708.89.291/fig-detailed-procedure-preparing-samples-nmr-aggregation-assay.webp)