Distribution of blood pressure, body mass index and smoking habits in the urban population of Dar es Salaam, Tanzania, and associations with socioeconomic status
8
0
0
Texte intégral
(2) CARDIOVASCULAR RISK FACTORS IN DAR ES SALAAM, TANZANIA. addition, the association of the main modifiable cardiovascular risk factors with socioeconomic status (SES) is often unclear in these countries.4 The directions of these associations are important to know in order to anticipate health trends, since direct SES-risk factor relationships may predict a further deterioration of age-specific CVD rates with improved prosperity. Health indicators in Tanzania reveal a heavy double burden of communicable and non-communicable diseases. Malaria, AIDS, tuberculosis and other infectious diseases are still leading causes of death, particularly in childhood. Hence, mortality before age of 5 years is very high (150 per 1000).5 Moreover, survivors of childhood also experience extremely high mortality rates during adulthood. For example, age-adjusted mortality at ages 25–60 years was 10–20 times higher in Tanzania than in England.6 In fact, age-specific mortality from some non-communicable diseases can be higher in developing than developed countries. Stroke mortality was several times more frequent in Dar es Salaam than in England, which was postulated to relate to high levels of blood pressure (BP) and poor hypertension control.7 We therefore examined the prevalence of selected major modifiable risk factors of CVD, including BP, body mass index (BMI) and smoking habits, and their associations with indicators of SES in a representative sample of the adult population of Dar es Salaam, Tanzania.. Methods The Republic of Tanzania is situated on the East Coast of Africa, south of Kenya and north of Mozambique. Tanzania has 33 million inhabitants with more than 2 million in Dar es Salaam, the economic centre (Dodoma is the political capital). Both total fertility rate and mortality rate are high (respectively 5.5 and 16 per 1000 in Tanzania versus around 1.5 and 10 per 1000 in Europe5), which characterize early epidemiological transition. Infant mortality rate is very high (98 per 1000 live births) with a mean life expectancy reaching 45 years.5 The gross national product per capita was US$220 and total health expenditures at official exchange rate amounted to only US$12 per capita in Tanzania in 1999 compared to 240 in Mexico and 1600–3600 in Western European countries.5,8 The study area consisted of five branches of Temeke District in Dar es Salaam. These are five of eight branches that are part of a National Sentinel Surveillance system for monitoring burden of disease that is being developed by the Adult Morbidity and Mortality Project (AMMP), a project of the Tanzania Ministry of Health, funded by the UK Department for International Development and implemented in partnership with the University of Newcastle upon Tyne.6,7,9 The population of these branches is enumerated every 6 months while other parts of Dar es Salaam were last enumerated in 1988 by the National Census. Within the study area, a majority of homes have one level, around half have no electricity, and less than a quarter have running water. The study was a cross-sectional survey of cardiovascular risk factors of the adults aged 25–64 living in the study area. Seventeen local clinical officers visited all homes in the study area between November 1998 and August 1999. They administered a questionnaire and performed anthropometric and clinical measurements on all residents encountered at the inhabitants’ homes. In view of the large emigration-immigration rates in the area, inhabitants not registered in the census of September. 241. 1998 but living in the study area at the time of the survey (i.e. newcomers) were also included. Visits to inhabitants were facilitated by ‘ten-cell leaders’ (called ‘balozis’ in Kiswahili), i.e. the community leaders who administer clusters of ‘10 adjacent houses’ (‘shinas’) or approximately 100–200 people and who know personally all the residents in their respective constituencies. The questionnaire explored socioeconomic variables, lifestyles and medical history. Height was measured at 0.5 cm precision with a portable sliding caliper gauge. Weight was measured with electronic scales at 0.1 kg precision (Planax Automatic ST 500, Terraillon, Paris, France). Body mass index (BMI) was calculated as weight divided by height squared (kg/m2). Smoking was defined for a reported consumption of >1 cigarette/day. Blood pressure (BP) was measured with validated automated devices (Visomat® 2, Hestia Pharma, Mannheim, Germany).10 Three BP measurements were taken on the left arm at intervals of at least 5 min. The average of the second and third BP readings was considered in this study. Cut-off values for ‘overweight’ (BMI 25.0–29.9 kg/m2), ‘obesity’ (BMI >30.0 kg/m2) and ‘hypertension’ (BP >140/90 mmHg or self-reported use of antihypertensive medication) followed recent definitions from the World Health Organization.11,12 Participants were free to participate and informed consent was sought from each participant. Socioeconomic status was assessed with indicators of scholar education, occupation and wealth. Wealth level was characterized by a summary variable accounting for the household ownership of electricity (reported by 61.5% of respondents), television (26.0%), refrigerator (28.9%), flush toilet (14.8%) or car (6.0%). Each positive answer scored one point so that the variable ranged from 0 (lowest) to 5 (highest). The study was approved by the National Institute of Medical Research and by the Tanzanian Commission for Science and Technology. A sub-study was conducted later in October–December 1999 on 500 randomly selected non-participants (as identified from the census of September–October 1998) to examine migration rates in the study area and characteristics in non-participants as compared to participants to the study. Five clinical officers made up to four visits to the selected non-participants’ homes, with the assistance of the ten-cell leaders of the corresponding areas. Information on vital status and place of emigration was gathered from the ten-cell leaders and neighbours for persons no longer living in the area. The encountered non-participants were submitted to the same questionnaire and physical examination as the participants of the main study. Mean values and prevalence of selected variables of interest have been tabulated by sex and 10-year age categories. Prevalence adjusted for age to the new ‘standard world population’ were calculated.13 Multivariate linear and logistic regression models were performed to examine the associations between outcomes and variables of interest, adjusting for age, sex and potentially confounding variables. Interactions effects were evaluated among variables with significant main effect. Analyses were performed with Stata 6.0 (Stata Corporation, College Station, Texas, USA). P-values , 0.05 were considered significant.. Results In view of the large replacement rates of the population in the study area and assuming a stable dynamic population, the overall participation rate (62.2%) can be estimated as the ratio of.
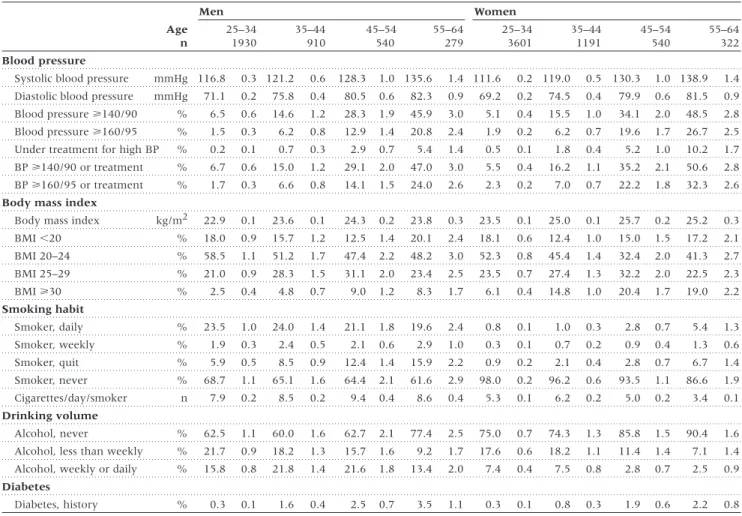
(3) 242. INTERNATIONAL JOURNAL OF EPIDEMIOLOGY. Table 1 shows the distribution of cardiovascular risk factors by sex and age. For both men and women, systolic BP increased linearly with age while diastolic BP tended to plateau after the age of 45–54 years. The association between age and systolic BP was steeper in women than in men and the overall prevalence of hypertension was higher in women than in men. Mean levels of BMI increased up to the age of 45–54 years and dropped slightly thereafter in both men and women. The prevalence of ‘overweight’ was similar in men and women. However, the prevalence of ‘obesity’ was more than two times higher in women than in men. Prevalence of smoking was low in both genders. The number of cigarettes smoked per smoker was fairly low in men and in women. The prevalence of quitters increased largely with age. More than 60% of men and 75% of women reported abstaining from drinking. Prevalence of self-reported history of diabetes was fairly low and increased substantially with age in both men and women. Adjusted to the world population, prevalence (%) among men/women aged 35–64 years was 27.1/ 30.2 for BP >140/90 mmHg or antihypertensive medication, 13.1/17.7 for BP >160/95 mmHg or medication, 28.0/27.4 for body mass index (BMI) of 25.0–29.9 kg/m2, 6.9/17.4 for BMI >30 kg/m2, and 22.0/2.6 for smoking. Table 2 shows the relationships between various indicators of SES and systolic BP, BMI, and smoking status after adjustment. the 9254 participants divided by the 14 866 people aged 25–64 identified in the census of October 1998. Participation was lower in men (45.2%) than in women (81.9%) but similar across age categories. Of the 9254 participants (39% men, 61% women; mean ± SD age: 35.5 ± 9.8 years), 98.4% were black, 66.5% Moslem and 30.9% born in Dar es Salaam. The sub-study of non-participants, conducted 12–14 months after the census of September-October 1998, indicated that 21.2% had moved outside of the study area (a majority outside of Dar es Salaam), 3.6% were dead, 4.8% were ‘travelling’ (several of them for a few months), and the fate of 4.2% was unknown. This shows a high emigration (and implicitly immigration) rate that may exceed 20–25% per year and which is consistent with the 25% migration rate per year found in another study in this area.14 Among the 331 non-participants who were found in the study area, 14 could not be met, 5 refused to be examined and 312 were examined. Compared to the study participants, nonparticipants had non-significant higher systolic and diastolic BP and higher BMI (P . 0.05 for all differences between sex- and 10-year age-specific estimates). Indicators of occupation and prevalence of smoking were similar in participants and nonparticipants in both sexes. This suggests that risk factor levels were not substantially different in non-participants as compared to participants.. Table 1 Distribution of cardiovascular risk factors by sex and age (mean levels or proportions with standard errors) Men Age n. Women 25–34 1930. 35–44 910. 45–54 540. 55–64 279. 25–34 3601. 35–44 1191. 45–54 540. 55–64 322. Blood pressure Systolic blood pressure. mmHg 116.8. 0.3 121.2. 0.6. 128.3. 1.0 135.6. 1.4 111.6. 0.2 119.0. 0.5 130.3. 1.0 138.9. Diastolic blood pressure. mmHg. 71.1. 0.2. 75.8. 0.4. 80.5. 0.6. 82.3. 0.9. 69.2. 0.2. 74.5. 0.4. 79.9. 0.6. 81.5. 1.4 0.9. Blood pressure >140/90. %. 6.5. 0.6. 14.6. 1.2. 28.3. 1.9. 45.9. 3.0. 5.1. 0.4. 15.5. 1.0. 34.1. 2.0. 48.5. 2.8. Blood pressure >160/95. %. 1.5. 0.3. 6.2. 0.8. 12.9. 1.4. 20.8. 2.4. 1.9. 0.2. 6.2. 0.7. 19.6. 1.7. 26.7. 2.5. Under treatment for high BP. %. 0.2. 0.1. 0.7. 0.3. 2.9. 0.7. 5.4. 1.4. 0.5. 0.1. 1.8. 0.4. 5.2. 1.0. 10.2. 1.7. BP >140/90 or treatment. %. 6.7. 0.6. 15.0. 1.2. 29.1. 2.0. 47.0. 3.0. 5.5. 0.4. 16.2. 1.1. 35.2. 2.1. 50.6. 2.8. BP >160/95 or treatment. %. 1.7. 0.3. 6.6. 0.8. 14.1. 1.5. 24.0. 2.6. 2.3. 0.2. 7.0. 0.7. 22.2. 1.8. 32.3. 2.6. Body mass index kg/m2. 22.9. 0.1. 23.6. 0.1. 24.3. 0.2. 23.8. 0.3. 23.5. 0.1. 25.0. 0.1. 25.7. 0.2. 25.2. 0.3. BMI ,20. %. 18.0. 0.9. 15.7. 1.2. 12.5. 1.4. 20.1. 2.4. 18.1. 0.6. 12.4. 1.0. 15.0. 1.5. 17.2. 2.1. BMI 20–24. %. 58.5. 1.1. 51.2. 1.7. 47.4. 2.2. 48.2. 3.0. 52.3. 0.8. 45.4. 1.4. 32.4. 2.0. 41.3. 2.7. BMI 25–29. %. 21.0. 0.9. 28.3. 1.5. 31.1. 2.0. 23.4. 2.5. 23.5. 0.7. 27.4. 1.3. 32.2. 2.0. 22.5. 2.3. BMI >30. %. 2.5. 0.4. 4.8. 0.7. 9.0. 1.2. 8.3. 1.7. 6.1. 0.4. 14.8. 1.0. 20.4. 1.7. 19.0. 2.2. Smoker, daily. %. 23.5. 1.0. 24.0. 1.4. 21.1. 1.8. 19.6. 2.4. 0.8. 0.1. 1.0. 0.3. 2.8. 0.7. 5.4. 1.3. Smoker, weekly. %. 1.9. 0.3. 2.4. 0.5. 2.1. 0.6. 2.9. 1.0. 0.3. 0.1. 0.7. 0.2. 0.9. 0.4. 1.3. 0.6. Smoker, quit. %. 5.9. 0.5. 8.5. 0.9. 12.4. 1.4. 15.9. 2.2. 0.9. 0.2. 2.1. 0.4. 2.8. 0.7. 6.7. 1.4. Smoker, never. %. 68.7. 1.1. 65.1. 1.6. 64.4. 2.1. 61.6. 2.9. 98.0. 0.2. 96.2. 0.6. 93.5. 1.1. 86.6. 1.9. n. 7.9. 0.2. 8.5. 0.2. 9.4. 0.4. 8.6. 0.4. 5.3. 0.1. 6.2. 0.2. 5.0. 0.2. 3.4. 0.1. Alcohol, never. %. 62.5. 1.1. 60.0. 1.6. 62.7. 2.1. 77.4. 2.5. 75.0. 0.7. 74.3. 1.3. 85.8. 1.5. 90.4. 1.6. Alcohol, less than weekly. %. 21.7. 0.9. 18.2. 1.3. 15.7. 1.6. 9.2. 1.7. 17.6. 0.6. 18.2. 1.1. 11.4. 1.4. 7.1. 1.4. Alcohol, weekly or daily. %. 15.8. 0.8. 21.8. 1.4. 21.6. 1.8. 13.4. 2.0. 7.4. 0.4. 7.5. 0.8. 2.8. 0.7. 2.5. 0.9. %. 0.3. 0.1. 1.6. 0.4. 2.5. 0.7. 3.5. 1.1. 0.3. 0.1. 0.8. 0.3. 1.9. 0.6. 2.2. 0.8. Body mass index. Smoking habit. Cigarettes/day/smoker Drinking volume. Diabetes Diabetes, history. BP: blood pressure; BMI: body mass index..
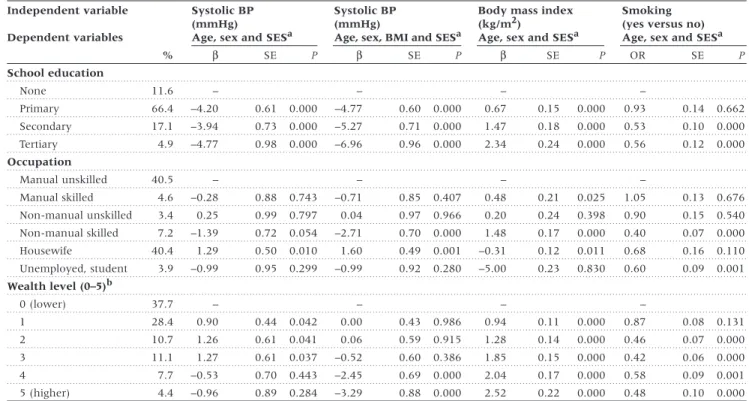
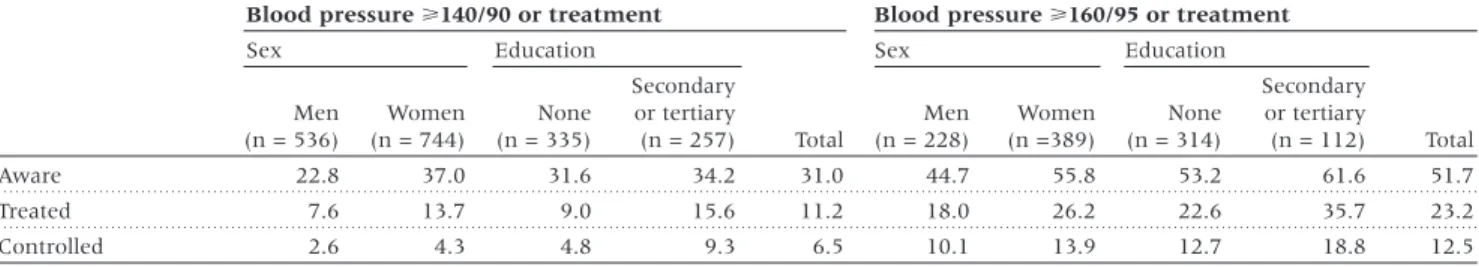
(4) CARDIOVASCULAR RISK FACTORS IN DAR ES SALAAM, TANZANIA. 243. Table 2 Association between socioeconomic variables and blood pressure (BP), body mass index (BMI) and smoking Independent variable. Systolic BP (mmHg) Age, sex and SESa. Dependent variables %. β. Systolic BP (mmHg) Age, sex, BMI and SESa. SE. P. β. Body mass index (kg/m2) Age, sex and SESa. SE. P. β. Smoking (yes versus no) Age, sex and SESa. SE. P. OR. SE. P. 0.662. School education None. 11.6. –. Primary. 66.4. –4.20. 0.61. 0.000. –4.77. 0.60. 0.000. 0.67. 0.15. 0.000. 0.93. 0.14. Secondary. 17.1. –3.94. 0.73. 0.000. –5.27. 0.71. 0.000. 1.47. 0.18. 0.000. 0.53. 0.10. 0.000. 4.9. –4.77. 0.98. 0.000. –6.96. 0.96. 0.000. 2.34. 0.24. 0.000. 0.56. 0.12. 0.000. 0.676. Tertiary. –. –. –. Occupation Manual unskilled. 40.5. –. Manual skilled. 4.6. –0.28. 0.88. 0.743. –0.71. 0.85. 0.407. 0.48. 0.21. 0.025. 1.05. 0.13. Non-manual unskilled. 3.4. 0.25. 0.99. 0.797. 0.04. 0.97. 0.966. 0.20. 0.24. 0.398. 0.90. 0.15. 0.540. Non-manual skilled. 7.2. –1.39. 0.72. 0.054. –2.71. 0.70. 0.000. 1.48. 0.17. 0.000. 0.40. 0.07. 0.000. 40.4. 1.29. 0.50. 0.010. 1.60. 0.49. 0.001. –0.31. 0.12. 0.011. 0.68. 0.16. 0.110. 3.9. –0.99. 0.95. 0.299. –0.99. 0.92. 0.280. –5.00. 0.23. 0.830. 0.60. 0.09. 0.001. Housewife Unemployed, student. –. –. –. Wealth level (0–5)b 0 (lower). 37.7. –. 1. 28.4. 0.90. 0.44. 0.042. 0.00. – 0.43. 0.986. 0.94. – 0.11. 0.000. 0.87. – 0.08. 0.131. 2. 10.7. 1.26. 0.61. 0.041. 0.06. 0.59. 0.915. 1.28. 0.14. 0.000. 0.46. 0.07. 0.000. 3. 11.1. 1.27. 0.61. 0.037. –0.52. 0.60. 0.386. 1.85. 0.15. 0.000. 0.42. 0.06. 0.000. 4. 7.7. –0.53. 0.70. 0.443. –2.45. 0.69. 0.000. 2.04. 0.17. 0.000. 0.58. 0.09. 0.001. 5 (higher). 4.4. –0.96. 0.89. 0.284. –3.29. 0.88. 0.000. 2.52. 0.22. 0.000. 0.48. 0.10. 0.000. a Socioeconomic status; SES is either school education or occupation or wealth level. b Wealth score ranges from 0 to 5 based on household ownership of electricity, television, refrigerator, flush toilet or car.. β: regression coefficient; OR: odds ratio; SE: standard error.. for age and sex in all models and, in addition, BMI for regression models on systolic BP. These parsimoniously adjusted models indicated that a higher SES was consistently associated with a lower systolic BP (particularly after adjustment for BMI), a higher BMI and a lower prevalence of smoking. The adjusted association between systolic BP and SES was stronger across categories of education than categories of occupation or wealth. In contrast, the adjusted association between BMI and SES was stronger across categories of wealth than categories of education and occupation (except for unemployed and students). Finally, the adjusted association between SES and smoking was lowest among categories of wealth. The effect of SES on systolic BP was accrued in most of the considered models by around up to 2 mmHg when BMI (which related directly with SES and negatively with BP) was accounted for. Table 3 shows the results of multivariate linear regression models relating SES variables with systolic BP, diastolic BP and BMI in men and in women. Systolic and diastolic BP were associated strongly and independently with BMI (e.g. 1.01 mmHg systolic BP and 0.91 mmHg diastolic BP per increase of 1 kg/m2 in men and women, respectively) and with age. These two variables (age and BMI) accounted for most of the variability in BP (e.g. R2 of 15.7% for systolic BP in men versus 16.6% for the full model as displayed in Table 3). The SES variables were associated more strongly with systolic than diastolic BP and in women more than in men. Noticeably, categories of wealth and education inter-correlated only moderately (e.g. 32% of people with secondary and tertiary education had a wealth score of. 0–1 and 6% with scholar education less than secondary had a wealth score of 4–5). Systolic BP was associated more with education than wealth. However, the effect of education was apparent mainly between the ‘no education’ and ‘primary education’ categories, particularly for systolic BP and for men. Interaction terms for the joint effect of wealth and education on BP had negative but non significant values (typically –1 to –3 [mmHg], depending on the chosen cut-off values), suggesting a trend toward an effect that could be more than additive. Being born outside of Dar es Salaam (6408 of 9254 participants) was also associated independently with higher BP than being born in Dar es Salaam. Inclusion in the regression models of antihypertensive treatment (yes or no) or place of birth did not alter the regression coefficients of the SES variables, indicating that the effect of SES on BP was not mediated through these variables. Body mass index was associated strongly with age, and in women more than in men. Body mass index was directly and independently associated with education (women) and with wealth. Among men, smokers had BMI smaller by 1.14 kg/m2 compared to non-smokers, after adjustment for covariates. The difference (–0.65 kg/m2) was not statistically significant in women but there were only 72 women who reported smoking (hence a small statistical power). Being born outside of Dar es Salaam was not associated with BMI. Only 143 (1.6%) of the 9254 participants reported taking antihypertensive treatment. Table 4 shows the prevalence of awareness, drug treatment and BP control by sex and education.
(5) 244. INTERNATIONAL JOURNAL OF EPIDEMIOLOGY. Table 3 Multivariate association between socioeconomic variables and blood pressure and body mass index in men and women Systolic blood pressure (mmHg). Diastolic blood pressure (mmHg). Body mass index (kg/m2). Men R2 = 0.17. Men R2 = 0.16. Men R2 = 0.08. β. Women R2 = 0.23 SE. P. β. SE. β. P. Women R2 = 0.17 SE. P. β. SE. β. P. Women R2 = 0.06. SE. P. β. SE. P. Education None. –. –. –. –. –. –. Primary. –4.98 1.29 0.000 –3.44 0.71. 0.000 –0.93. 0.93 0.317. 0.02. 0.52 0.967. 0.30 0.28 0.280. 0.71. Secondary. –4.40 1.39 0.002 –5.15 0.96. 0.000 –0.53. 1.01 0.598 –1.11. 0.69 0.111. 0.65 0.30 0.032. 1.01. 0.19 0.000 0.26 0.000. Tertiary. –5.44 1.68 0.001 –6.36 1.46. 0.000 –0.79. 1.22 0.516 –2.47. 1.05 0.019. 1.16 0.36 0.001. 1.65. 0.38 0.000. Wealth level 0a. –. –. 1–3. 0.03 0.60 0.958 –0.26 0.50. 0.605 –0.09. 0.44 0.833 –0.43. 0.36 0.904. 1.11 0.13 0.000. 1.05. 0.13 0.000. 4–5. –0.48 1.01 0.630 –2.17 0.84. 0.010 –1.13. 0.73 0.123 –1.55. 0.61 0.011. 1.62 0.22 0.000. 1.76. 0.22 0.000. 0.000. 0.06 0.000. 0.04 0.000 NCMb. BMI (kg/m2) Smoking (yes versus no) Age (10 years). –. –. 1.01 0.08 0.000 NCMb. 0.91 0.05 NCMb. 4.73 0.28 0.000. 0.76 NCMb. 7.08 0.27. 0.000. 0.72. –. NCMb. 3.47. 0.21 0.000. –. NCMb. –1.14 0.14 0.000 –0.65. 0.55 0.235. 4.01. 1.94 0.000. 0.51 0.06 0.000. 0.95. 0.07 0.000. Born in Dar es Salaam. –2.70 0.60 0.000 –1.53 0.49. 0.002 –1.87. 0.43 0.000 –0.61. 0.36 0.090. 0.07 0.12 0.605 –0.18. 0.13 0.160. Constant. 86.02 2.32 0.000 73.82 1.65. 0.000 45.16. 1.68 0.000 41.38. 1.18 0.000. 20.47 0.41 0.000 19.38. 0.36 0.000. a Wealth score ranges from 0 to 5 based on household ownership of electricity, television, refrigerator, flush toilet or car. b NCM: variable not considered in model.. β: regression coefficient; SE: standard error. Regression models include all variables listed, except when stated otherwise.. Table 4 Awareness, treatment and control of blood pressure (%) by sex and education status Blood pressure >140/90 or treatment. Blood pressure >160/95 or treatment. Sex. Sex. Education. Men (n = 536). Women (n = 744). None (n = 335). Secondary or tertiary (n = 257). Aware. 22.8. 37.0. 31.6. 34.2. Treated. 7.6. 13.7. 9.0. Controlled. 2.6. 4.3. 4.8. Education. Total. Men (n = 228). Women (n =389). None (n = 314). Secondary or tertiary (n = 112). 31.0. 44.7. 55.8. 53.2. 61.6. 51.7. 15.6. 11.2. 18.0. 26.2. 22.6. 35.7. 23.2. 9.3. 6.5. 10.1. 13.9. 12.7. 18.8. 12.5. status for two definitions of ‘hypertension’. Admittedly, a definition based on lower cut-off values of BP measured at only one visit (survey) is likely to result in a larger number of false positive hypertensive cases. Overall, 31–52% of hypertensive persons were aware of their condition, 11–23% were taking a treatment, and 7–13% had BP controlled. These proportions were more favorable in women than in men and in educated than non-educated people.. Discussion This study in an urban population in early epidemiological transition shows a high prevalence of hypertension and excess weight in both men and women, particularly after the age of 45 years. After adjustment for covariates, SES was associated inversely with BP and smoking and directly with BMI. BP tended to relate more with education than wealth, BMI related more with wealth than education and smoking related similarly with. Total. both. Antihypertensive treatment was taken less often by men than women and by persons of low than high SES. The prevalence of hypertension was high, particularly after the age of 45 years. BP levels were, however, substantially lower in this study than in 770 adults aged >15 years in another area of Dar es Salaam.15 Lower values in our study may relate to measurements based on 2nd and 3rd measurements (versus 1st and 2nd in the other study) and use of automated devices (versus mercury sphygmomanometers). Automated devices tend to give lower BP values compared to mercury devices, according to formal validation studies.10,16 The prevalence of hypertension in our study was higher than that found in previous studies in Tanzania, generally in rural areas: 1–5% in the 1960s,17 2% in 197918 or 2–10% in villages in 1987–1989.19 Prevalence in this study was similar to that in several African urban populations,20 lower than in some higher income African countries (e.g. 28% in Seychelles21 or 30% in South Africa22) and much lower than in African Americans (43%).23.
(6) CARDIOVASCULAR RISK FACTORS IN DAR ES SALAAM, TANZANIA. Detection and treatment of hypertension were poor, irrespective of how hypertension was defined. These levels were, however, substantially better in women than in men and in educated than non-educated persons, which is consistent with findings in several other populations.20 Low control levels may reflect the combined effects of competing priorities in health care such as infectious diseases, scarce resources, and low level of public education on non-communicable diseases.24 The inverse SES-BP relationship in our study was apparent without adjustment for BMI and it expectedly increased further after adjustment for BMI (BMI was associated positively both with SES and with BP). A recent meta-analysis indicated that BP was higher (e.g. by 2–3 mmHg for systolic BP) in persons of high than low SES in most studies in developed countries while findings were less consistent in the few studies from developing countries.4 A small BP difference can have large impact at a population level since, for example, a 5-mmHg lower diastolic BP predicts a 21% lower coronary heart disease rate and a 34% lower stroke rate.25 Our data suggest a stronger effect of education than wealth on BP. This may suggest the importance of knowledge for the adoption of healthy lifestyles and diet. A healthy diet, for example, can indeed substantially lower BP.26 The prevalence of excess body weight was substantial, particularly after the age of 35 years. Although the overall prevalence of obesity is as low as 2.5% in the mainly rural sub-Saharan populations, it is typically higher in urban than rural settings and in educated than uneducated people.27 The epidemic of obesity in developing countries has been attributed to large changes in the diet structure and in professional and leisure occupation types, which all relate strongly to urbanization.28 Body mass index was strongly associated with SES, particularly with indices of wealth. A direct SES-BMI relation is consistent with findings in other developing populations29,30 but it contrasts with an inverse gradient generally found in developed countries, inclusive in people of African descent.31,32 In developed countries, higher BMI in individuals of lower SES has been related to restricted knowledge and behavioural options/ access toward healthy foods or safe exercise, lower valuation of weight control, discrimination against socioeconomic advancement and cultural standards of physical attractiveness.33 Cultural factors may differ in developing countries where food sometimes remains a daily challenge and overweight may subsequently be perceived as a sign of wealth. Body mass index was substantially lower in smokers than in non-smokers. This is consistent with increased energy expenditure34 and elevated plasma leptin concentrations in smokers.35 Smoking prevalence was approximately 20% in men and less than 5% in women. These proportions are fairly low compared to both developed and developing countries.36 The prevalence of regular smokers did not vary substantially with age while the proportions of ex-smokers increased monotonically with age. This can suggest that smoking uptake spreads over a large age range, in contrast to the uptake mainly concentrated in younger ages reported in developed countries.. 245. Smoking prevalence was associated inversely with education and wealth. An inverse SES-smoking association has been found in most industrialized and middle-income countries but less consistently in low-income countries.37 In a study in 12 South American and Asian centres, the association was positive (non significantly) in three, flat in four, and inverse in five.38 In Africa, a direct association was reported in several countries, e.g. Nigeria39 and South Africa.40 An inverse SES-smoking association may relate to better knowledge of the hazards of smoking and a better use of health-related information in those with higher SES. From a public health perspective, weight control should have high priority in view of the substantial prevalence of overweight and the detrimental effects of excess weight on several cardiovascular risk factors. Educational, legislative and fiscal interventions should be implemented to facilitate the adoption of a healthy diet and to increase facilities and opportunities for leisure physical activity.41 In view of the direct SES-BMI association, psychosocial and cultural determinants of obesity should be investigated carefully to inform appropriate health education campaigns in low-income populations where overweight may be perceived as desirable. The establishment of a comprehensive national tobacco control programme is of paramount importance to prevent an increase in the currently fairly low cigarette consumption under the pressure of increasingly aggressive marketing campaigns from the tobacco industry. Finally, affordable medications should be available to hypertensive patients.42 Special attention should be paid to patients of low SES as they tend to have more adverse cardiovascular risk factor levels and lower treatment rates. Interventions to raise BP awareness and control are also good entry points for comprehensive noncommunicable disease prevention and control programmes.24 More generally, these data stress the scale and the seriousness of the emerging challenge of cardiovascular disease in developing countries, with particular emphasis on persons of low SES. These data also stress the need for early interventions including both public health strategies and a careful adaptation of the health care infrastructure.. Acknowledgements This research was financed by a grant of the Swiss National Science Foundation (No 32–51189.97). C Lengeler was supported by a senior research fellowship from the Swiss National Science Foundation (grant 32–41632.94). We thank the 17 clinical officers for their dedication in performing the survey, including A Rwebogra, M Balampama, J Gibbes, M Said, O Omari and A Twalib who assisted in all the stages of the survey; the many ten-cell leaders who facilitated the conduct of the survey; P Pichette of the Dar es Salaam Urban Health Project for logistic assistance; H Mugula, director of Temeke Hospital for his constant support; the Adult Morbidity and Mortality Project team, particularly Dr N Unwin for fruitful discussions, and G van Melle, PhD, IUMSP, for assistance in statistical analyses..
(7) 246. INTERNATIONAL JOURNAL OF EPIDEMIOLOGY. KEY MESSAGES •. Non-communicable diseases account for a high burden of disease in developing countries, and this burden is still increasing as they progress along epidemiological transition.. •. Assessing the population levels of risk factors permits to anticipate the future cardiovascular trends and gives key information for preventive strategies.. •. Prevalence of high blood pressure and excess body weight was high in the urban population of a country in an early stage of the epidemiological transition.. •. Socioeconomic status (SES) was associated inversely with blood pressure and smoking: this may suggest favourable trends as development proceeds.. •. Socioeconomic status was associated directly with body mass index, which may forecast an obesity epidemic similar to the one observed in more affluent countries.. •. These data stress the scale and the seriousness of the emerging challenge of cardiovascular disease in developing countries, with particular emphasis on people of low SES; they also stress the need for early interventions including both public health strategies and a careful adaptation of the health care infrastructure.. References 1 Omran AR. The epidemiological transition. A theory of the epi-. demiology of population change. Milbank Mem Fund Q 1971;4:509–38. 2 Murray CJL, Lopez AD. Mortality by cause for eight regions in the. world: Global Burden of Disease Study. Lancet 1997;349:1269–76. 3 Reddy KS, Yusuf S. Emerging epidemic of cardiovascular disease in. developing countries. Circulation 1998;97:596–601.. 17 Forsyth D. Hypertension in Tanzania. East Afr Med J 1969;46:309–12. 18 Vaughan J. Blood pressure and heart murmurs in a rural population. in the United Republic of Tanzania. Bull World Health Organ 1979;57: 89–97. 19 Swai AB, McLarty DG, Kitange HM et al. Low prevalence of risk. 4 Colhoun HM, Hemingway H, Poulter NR. Socio-economic status and. factors for coronary heart disease in rural Tanzania. Int J Epidemiol 1993;22:651–59.. blood pressure: an overview analysis. J Hum Hypertens 1998;12:91–110.. 20 Fuentes R, Ilmaniemi N, Laurikainen E, Tuomilehto J, Nissinen A.. 5 World Health Organization. The World Health Report 2000. Geneva:. Hypertension in developing economies: a review of population-based studies carried out from 1980 to 1998. J Hypertens 2000;18:521–29.. World Health Organization, 2000. 6 Kitange HM, Machibya H, Black J et al. Outlook for survivors of child-. 21 Bovet P, Shamlaye C, Kitua A, Riesen WF, Paccaud F, Darioli R. High. hood in sub-Saharan Africa: adult mortality in Tanzania. Br Med J 1996;312:216–20.. prevalence of cardiovascular risk factors in the Seychelles (Indian Ocean). Arterioscler Thromb 1991;11:1730–36.. 7 Walker RW, McLarty DG, Kitange HM et al. Stroke mortality in urban. 22 Mollentze WF, Moore AJ, Steyn AF et al. Coronary heart disease risk. and rural Tanzania. Lancet 2000;355:1684–87. 8 World Bank. World Development Indicators 2000. CD-ROM. Washington:. World Bank, 2000. 9 The Adult Morbidity and Mortality Project. Tanzanian Ministry of. Health, UK Department for International Development, University of Newcastle upon Tyne (http://www.ncl.ac.uk/ammp/). 10 Dieterle T, Battegay E, Bucheli B, Martina B. Accuracy and ‘range of. uncertainty’ of oscillometric blood pressure monitors around the upper arm and the wrist. Blood Press Monit 1998;3:339–46. 11 Guidelines. Subcommittee. 1999 World Health OrganizationInternational Society of Hypertension guidelines for the management of hypertension. J Hypertens 1999;17:151–83.. 12 Physical status: the use and interpretation of anthropometry: report of. a WHO expert committee. WHO Tech Rep Ser 1995;854:1–452. 13 United Nations. World Population Prospects. New York: United Nations,. 1991. 14 Mswia R, Whiting D, Kabadi G, Masanja H, Setel P. Dar es Salaam. factors in a rural and urban Orange Free State black population. S Afr Med J 1995;85:90–97. 23 Drizd T, Dannenberg AL, Engel A. Blood pressure levels in persons. 18–74 years of age in 1976–80, and trends in blood pressure from 1960 to 1980 in the United States. Vital Health Stat 1986;234:1–68. 24 Reddy KS. Hypertension control in developing countries. J Hum. Hypertens 1996;10(Suppl.1):S33–38. 25 MacMahon S, Peto R, Cutler J et al. Blood pressure, stroke, and cor-. onary heart disease. Part 1. Prolonged differences in blood pressure: prospective observational studies corrected for the regression dilution bias. Lancet 1990;335:765–74. 26 Sacks FM, Svetkey LP, Vollmer WM et al. Effects on blood pressure. of reduced dietary sodium and the dietary approaches to stop hypertension (DASH) study. N Engl J Med 2001;344:3–10. 27 Martorell R, Khan LK, Hughes ML, Grummer-Strawn LM. Obesity in. women from developing countries. Eur J Clin Nutr 2000;54:247–52. 28 Popkin BM. The nutrition transition and its health implications in. lower-income countries. Public Health Nutr 1998;1:5–21.. demographic surveillance system. Ed: the INDEPTH network. Population, Health and Survival in INDEPTH sites. IDRC/CRDI, Ottawa, Canada (in press).. 29 Bunker CH, Ukoli FA, Nwankwo MU et al. Factors associated with. 15 Edwards R, Unwin N, Mugusi F et al. Hypertension prevalence. 30 Gilberts EC, Arnold MJ, Grobbee DE. Hypertension and determinants of. and care in an urban and rural area of Tanzania. J Hypertens 2000;18: 145–52.. blood pressure with special reference to socioeconomic status in a rural south Indian community. J Epidemiol Community Health 1994;48:258–61.. 16 Lithell H, Berglund L. Validation of an oscillometric blood pressure. 31 Jeffery RW, French SA. Socioeconomic status and weight control. measuring device: a substudy of the HOT Study (Hypertension Optimal Treatment). Blood Press 1998;7:149–52.. practices among 20- to 45-year-old women. Am J Public Health 1996; 86:1005–10.. hypertension in Nigerian civil servants. Prev Med 1992;21:710–22..
(8) CARDIOVASCULAR RISK FACTORS IN DAR ES SALAAM, TANZANIA. 247. 32 Burke GL, Savage PJ, Manolio TA et al. Correlates of obesity in young. 38 The INCLEN Multicentre Collaborative Group. Socio-economic status. Black and White women: the CARDIA Study. Am J Public Health 1992; 82:1621–25.. and risk factors for cardiovascular disease: a multicentre collaborative study in the International Clinical Epidemiology Network (INCLEN). J Clin Epidemiol 1994;47:1401–09.. 33 Sobal J, Stunkard AJ. Socioeconomic status and obesity: a review of. the literature. Psychol Bull 1989;105:260–75. 34 Hofstetter A, Schutz Y, Jequier E, Wahren J. Increased 24-hour energy. expenditure in cigarette smokers. N Engl J Med 1986;314:79–82.. 39 Taylor OG, Oyediran OA, Bamgboye AE, Afolabi BM, Osuntokun BO.. Profile of some risk factors for coronary heart disease in a developing country: Nigeria. Afr J Med Sci 1996;25:341–46.. 35 Nicklas BJ, Tomoyasu N, Muir J, Goldberg AP. Effects of cigarette. 40 Strebel P, Kuhn L, Yach D. Determinants of cigarette smoking in. smoking and its cessation on body weight and plasma leptin levels. Metabolism 1999;48:804–08.. the black township population of Cape Town. J Epidemiol Community Health 1989;43:209–13.. 36 World Health Organization. Tobacco or Health: A Global Status Report.. 41 Ebrahim S, Davey Smith G. Systematic review of randomised. Geneva: World Health Organization, 1997. 37 Bobak M, Jha P, Nguyen S, Jarvis M. Poverty and smoking. In: Jha P,. Chaloupka F (eds). Tobacco Control in Developing Countries. New York: Oxford University Press (for the World Bank and WHO), 2000, pp.41–61.. controlled trials of multiple risk factor interventions for preventing coronary heart disease. Br Med J 1997;314:1666–74. 42 Cooper RS, Rotimi CN, Kaufman JS, Muna WF, Mensah GA. Hyper-. tension treatment and control in sub-Saharan Africa: the epidemiological basis for policy. Br Med J 1998;316:614–17.. A study coordinator taking the blood pressure of a female study participant (reproduced with permission).
(9)
Figure
Documents relatifs
