Adapting a Hazards-Risk Model to Water Scarcity in Rural
India-Aurangabad Case Study
by
Paige K. Midstokke B.A. Political Economy
University of California, Berkeley 2013
Submitted to the Institute for Data, Systems, and Society and the Department of Civil and Environmental Engineering in Partial Fulfillment of the Requirements for the Degree of
Master of Science in Technology and Policy and
Master of Science in Civil and Environmental Engineering
AR
at the MASSA
Massachusetts Institute of Technology OF T
February 2018
C2018 Massachusetts Institute of Technology
FEB
All rights reserved.
+-
LIB
Signature of Author: Certified by:$
i
Certified by:jiia Uu
Ir
acue
~ignatureredacted
/(1
gnature
redacte
CHIVES ECHNOLOGY28
2018
RARIES
Paige Midstokke Technology and Policy Program ,partment of Civil and Environmental Engineering December 8, 2017James L. Wescoat Jr. Aga Khan Professor, Department of Architecture
Department of Urban Studies and Planning Thesis Supervisor
Accepted by:
//I
Dennis McLaughlin H.M. King Bhumibol Professor of Water Resources Management Department of Civil and Environmental Engineering, Thesis Reader
Signature redacted
Munther Dahleh William A. Coolidge Professor, Electrical Engineering and Computer Science Director, Institute for Data Systems and Society
Accepted by: _Signature
redacted
/
x Jesse KrollMITLibraries
77 Massachusetts Avenue
Cambridge, MA 02139 http://Iibraries.mit.edu/ask
DISCLAIMER NOTICE
Due to the condition of the original material, there are unavoidable flaws in this reproduction. We have made every effort possible to provide you with the best copy available.
Thank you.
Some pages in the original document contain text that runs off the edge of the page.
Adapting a Hazards-Risk Model to Water Scarcity in Rural
India-Aurangabad Case Study
by
Paige Midstokke
Submitted to the Institute for Data, Systems, and Society and the Department of Civil and Environmental Engineering on December 8, 2017 in Partial Fulfillment of the Requirements for
the Degree of Master of Science in Technology and Policy and Master of Science in Civil and Environmental Engineering
Abstract
The objective of this project is to improve the responsiveness of District Planning to rural water scarcity in India. Through engagements with the Groundwater Survey Development Agency, and Maharashtra State Government Water Supply and Sanitation Department, we selected
Aurangabad District to conduct field visits and develop a model that can spatially represent risk of villages to water scarcity. Within Aurangabad District, Vaijapur block was selected as a case study due to its drought effects and high water tanker usage in the past five years.
This thesis develops a disaster risk metric for water scarcity, using an analysis of potential hazards, socioeconomic vulnerability, and policy responses to assign a "disaster risk score" to each village. Risk is seen as a function of hazard, vulnerability, and government capacity, so all three factors of risk are addressed. Villages are assigned a risk score in Vaijapur block of
Aurangabad District By providing a risk score a season in advance of drought, planners are able to select an alternative capacity measures rather than the quickest tanker option.
The aim of this research is to assist district governments in Maharashtra state in predicting, between one season to two years in advance, the risk of villages to drinking water scarcity in order to respond before incurring a drinking water crisis. Secondly, this model is used to
prioritize infrastructure projects over the coming two years in order to best use limited financial resources to alleviate the burden of water scarcity at the village level. This research could ultimately be integrated into the existing state website for statewide planning and allocation of resources.
Thesis Supervisor: James L. Wescoat Jr.
Title: Aga Khan Professor of the Department of Architecture
Acknowledgements
This thesis is a product of months of fieldwork, and the hard work, financial support, and mentorship of many people. My departmental support at Civil and Environmental Engineering, and my home department Technology and Policy Program were incredibly supportive of my academic goals and thesis research. Barbara DeLaBarre and Dr. Kenneth Oye were particularly helpful in their advice on framing the problem, and incorporating the methods of policy and engineering into a single, cohesive thesis.
I would like to thank my advisor, Dr. James Wescoat, for introducing me to field research and
proper methods for conducting academic research with integrity. You have provided guidance that has allowed me to understand the depth of analysis required to understand a problem before attempting a solution. Thank you for supporting my interests in drought research, in
incorporating environmental engineering, and in developing a proper framework. This work could also not have been possible without our community partners in India, including Murthy Jonnalagadda, consultant to the World Bank in Mumbai. Our partners in Aurangabad, including the Zilla Parishad and Groundwater Surveys Development Agency, were also incredibly helpful in providing data, coordinating meetings and village visits, and providing expert guidance on the water scarcity dynamics in the region.
The MIT Tata Center, supported by the Tata Trust, provided financial and academic support without which this project could not be possible. I would also like to thank Michael Bono and Chintan Vaishnav for their advice on designing metrics for risk and the different forms of
sensors available to measure water levels. I would like to thank Riddhi Shah for her exceptional
GIS mapping skills and her work on this project, including making a trip out to Aurangabad for
surveying the Zilla Parishad in Marathi.
I would also like to thank Dennis McLaughlin for his guidance as my engineering thesis advisor,
and his mentorship for developing the system identification and PCA models.
Finally, I would like to thank my family and Jeremy Elster for their support in my research, my travel, and my graduate education. Their compassion and support allowed me to dive deeply into my research, and to commit to developing myself as a hydrologist and policy analyst.
Contents
Abstract 2
Acknowledgements 3
Chapter 1: Introduction 7
1.1 Problem Statement 7
1.1.1 Problems Being Addressed 8
1.2 Defining Water Scarcity 8
1.2.1 Government Criteria for Drought and Water Scarcity 9
1.2.2 Broader Criteria for Water Scarcity 11
1.2.3 Intersection of Drought and Water Scarcity 11
1.3 Literature review of Methods for Managing Water Scarcity in India 12
1.3.1 Literature Review Abstract 13
1.3.2 Historical Water Scarcity 13
1.3.3 Water Scarcity Frameworks 14
1.3.4 Water Scarcity Indices 16
1.3.5 Impacts on the Rural 16
1.3.6 Modeling Scarcity in India 17
1.3.7 The Modem Field of Planning: Drought and Scarcity 18
1.3.8 Literature Review Conclusion 19
1.4 Research Questions and Objectives 20
1.4.1 Gaps in Current Water Scarcity Planning and Management 20
1.4.2 Connection of Data Sources to Planning Process 21
1.4.3 Expanding the Range of Choice 21
1.4.4 Summary of Research 21
Chapter 2: Aurangabad District Case Study 22
2.1 Historical Water Context and Landscape 26
2.2 Existing Planning Practices 28
2.3 Climatological Conditions 31
2.4 Hydrologic and Geologic Conditions 31
2.6 Policy and Regulations for Water Scarcity 34
2.7 Case Study Synthesis 35
Chapter 3: Risk Model Methodology 36
3.1 Conceptual Framework 36
3.2 Hazard Score Development 37
3.2.1 Variables and Sources 37
3.2.2 Rainfall Statistics 38
3.2.3 Groundwater Statistics 41
3.2.4 Irrigation Demand and Temperature 49
3.2.5 Methodology 50
3.2.5.1 Systems Identification 50
3.2.5.2 Results and Interpretation 51
3.3 Vulnerability Score Development 54
3.3.1 Variables and Sources 55
3.3.2 Methodology 58
3.3.2.1 Data Cleaning 58
3.3.2.2 Variable Exploration 58
3.3.3 Vulnerability Score Development from Percentage Variables 60
3.3.4 Vulnerability Results 61
3.4 Capacity Score Development 62
3.5 Overall Risk Scores 65
Chapter 4: Planning Implications and Conclusions 69
4.1 Current Planning Process 69
4.2 Key Findings and Implications 73
4.2.1 Recharge Rate 73
4.2.2 Timing of Planned Government Interventions 74
4.2.3 Spatial Patterns and Planning 75
4.3 Model Recommendations 76
4.4 Conclusion 77
1. Results in R for Regression Model: Social Vulnerability 79
2. Images of 19 Variables in Social Vulnerability Index, Created by Riddhi Shah 80
3. System Identification Matlab Code 90
4. Principal Component Description 93
Figure 4.1 Principle Component Results: Cumulative Variance Explained 93
Figure 4.2 The Scaling applied to each variable in PCA 94 Figure 4.3 Mapping of Cumulative Variance Explained by first 10 PCs 95
Figure 4.4 Mapping of Principal Component 1 and Principal Component 2 95
Figure 4.5 Eigenvalues 96
Figure 4.6 Distribution of Ten Principal Components and Summation 98
Figure 4.7 Summed Principal Components and Score 99
Figure 4.8 Map of Vulnerability Score: Principal Component Based 100
Figure 4.9 Percentage Variables in Second PCA Analysis 101
Figure 4.10 Variance Reduction in Second Principal Component Analysis 102 Figure 4.11 Map of PCA for Percentage Variables: 10 Principal Components Score 103
Figure 4.12 Map of PCA for Percentage Variables: 8 Principal Components Score 103
5. Principle Component Code in Rstudio 104
6. Reference Table of Risk Score and Components for 16 Observation Well Villages 106 7. Format for Water Security Plan Household Survey, provided by GSDA Aurangabad 107
Chapter 1: Introduction
1.1 Problem Statement
Severe and sustained water scarcity, predominantly in the form of depleted rainfall, has limited the availability of groundwater resources, and thus drinking water, in Central Maharashtra. Aurangabad district, located in central Maharashtra, has a complex array of challenges in managing water scarcity. Aurangabad has a growing population, water-intensive industries including soda and beer manufacturing, small farmers who rely on rainfall, and the district has lower rates of rainfall absorption to groundwater due to elevation changes and runoff.
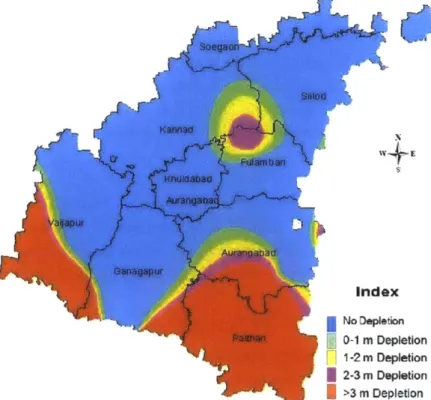
It is expected that regions with below average rainfall will have declining groundwater levels. A newer challenge for districts is managing areas that are receiving the expected amount of rainfall but at a higher intensity for a shorter period of time, meaning there is higher runoff and less water is absorbed into the ground. Additionally, there are variable rates of withdrawal which lead to variation in regional groundwater depletion. Below, Figure 1.1.1 shows pockets of
groundwater depletion throughout the district of Aurangabad, in part because below average rainfall, (i.e. > 10% less than average rainfall) is experienced in the south.
Figure 1.1.1 Groundwater Depletion in 2015 Compared to Last 5 Year Average
SILLOD KANNAD DABAD r WIPR .\i. FULAMBRI jiABAD
I
Ii~
LI
I
I
No
0.1-1-2
2-3
1
Groundwater
m
Groundwater
n Groundwater
n Groundwater
m" PATHAT dThe population of Aurangabad district, as of 2011 census, was 3,695,928. Of that population, 62.47% or 2,308,846 people live in rural villages (GOI, 2011). The high proportion of rural communities makes water management extremely decentralized and challenging. Aurangabad is positioned in the arid Marathwada region of central India, and its district, along with surrounding districts, face difficult decisions in deciding which villages receive aid in times of drought, what types of aid they receive, and in anticipating rural village water needs. In the current scarcity planning process, money is set aside each year to be used in one of seven responses, and villages can apply for assistance once they are receiving less than 40 liters per capita per day (LPCD). In
2016, for example, 80 tankers were sent on 2-3 trips per day for three months to villages, costing
the district over $3,000,000 USD (ZP Aurangabad, 2016). This is the most-costly of the seven responses a district can make, but it requires the least amount of advanced planning or
anticipation.
1.1.1 Problems Being Addressed
Of the vast challenges faced by a drought-prone arid rural region, there are three systemic
problems which should be addressed. First, drought planning is currently reactionary rather than anticipatory; second, drought responses are spatially fragmented and thus inefficiently deployed, and third, drought planning is done in the short-term. In order to improve resiliency in the Maharashtra, it is crucial to address these three concerns.
This thesis delves into the plans for how to make district planning proactive, increase
intervention efficiency by visualizing spatial patterns of risk, and design a tool for multi-year drought assessment by means of an adapted hazards risk model.
By improving our understanding of the risks and vulnerabilities rural villages face, the water
scarcity planning process can become more proactive and less reactionary, giving districts the ability to respond with longer term solutions than the provision of tankers. An integrated regression model of groundwater prospect data, census data, rainfall data, and observation well data is used to assign a hazard score to villages in specific monsoon scenarios, giving districts insight into which villages require intervention before the peak dry season. This model of risk assessment will be incorporated into the planning process as a decision support tool that can provide a ranking of water scarcity risks in the presence of different conditions, such as depleted
rainfall.
1.2 Defining Water Scarcity
Drought and water scarcity are often used interchangeably when discussing a depletion in the supply of water to households, agriculture, or industry. As this study is focused on the state of Maharashtra, it is crucial to understand these terms as they exist in policy and practice in India as well as specifically in Maharashtra.
1.2.1 Government Criteria for Drought and Water Scarcity
The Indian Meteorological Department (IMD), a federal agency, has historically classified drought as a rainfall deficiency which deviates from a long-term average. Drought has been classified as normal if it deviates 25% or less from the long-term average, moderate drought if
50% or less, and severe drought if it deviates more than 50% from the long-term average (IMD,
2016). These classifications are typically given when a month, season, or year is atypical from
the historical long-term average for rainfall. This understanding of drought does not consider hourly intensity of rainfall, groundwater absorption, or other forms of water scarcity such as increased consumption. Below is a map of rainfall variation in Aurangabad District, using IMD data.
Figure 1.2.1 The 2015 Isohyetal Map of Rainfall Variation in Aurangabad
ISOHYTAL MAP OF AURANGABAD
o 30 60 4 404W0 m .00.to." $20 10 "a0 ON b60700 - 704740 Source: GSDA, 2016
The Department of Irrigation of India (DOI) has defined agricultural drought as four consecutive weeks of rainfall depletion greater than 25% from the long-term average (DOI, 2016). More than half of Aurangabad district relies on agriculture as their primary income, making agricultural drought detrimental to the livelihood of the district. This definition of drought again refers to rainfall depletion, even if farmland does not rely directly upon rainfall but instead upon surface water or well water.
The Government of India has defined drinking water scarcity as an amount of liters per capita per day received in the smallest administrative unit, the village. Water Scarcity was a village
receiving less than forty liters per capita per day (LPCD), which increased to fifty-five LPCD in
2017.
Figure 1.2.2 District 2015 Water Scarcity Map - January to March
MAP SHOWING SCARCITY AREA - DISTRICT AURANGABAD Jan. to March 2015
Legend
TALUKA BOUNDARY Villages
Status
Tanker Fed Villages Scarcity Area No Scarcity
Source: GSDA, 2015
In addition to agriculture and meteorological drought, it is commonly accepted that there are socio-economic drought, hydrological drought, and ecological drought (UNL, 2016). While these definitions for drought are defined at the national level, the state of Maharashtra is given the authority to write policy for managing both drought and scarcity. Currently, Maharashtra has certain protections for groundwater when it is considered "overexploited". As defined by the Groundwater Survey and Development Agency of Maharashtra, any watershed that is withdrawn in a single year over 70% is considered overexploited. This label triggers certain groundwater withdrawal restrictions within the state, and also directs GSDA's attention to villages who rely on groundwater from overexploited aquifers.
1.2.2 Broader Criteria for Water Scarcity
Seasonal drinking water scarcity in India is strictly defined as persons receiving less than 55 LPCD for drinking and living for a given season. This standard was introduced in the 2012-2017 XII 5- year plan by the National Rural Drinking Water Programme (NRDWP) of India, in order for a habitation or village to be considered "fully covered" (NRDWP, 2016). While LPCD is measured annually, it often fluctuates during the year, giving rise to seasonal water scarcity. Seasonal water scarcity is seen as temporary, and has historically been alleviated when the monsoon season arrives, but Aurangabad has experienced villages with as many as 9 months of water scarcity for up to 5 years in a row, a historic high for water scarcity magnitude and longevity (AAP, 2015-16). For the purposes of this study, it is important to add complexity to this definition to ensure that we understand the root causes and risk of water scarcity. Water Scarcity will be defined as the deficiency of drinking water supplies leading to a lack of water for normal and specific needs, leading to health risks, diminished livelihoods and socioeconomic vulnerability (UNL, 2016). Rainfall may remain unchanged, but water scarcity may occur in groundwater, surface water, or elsewhere as it is the supply of water that is insufficient to meet demand.
The ultimate goal of this study is to consider not only rainfall, but other causes of water scarcity, and factors which lead a Gram Panchayat vulnerable to water scarcity. By having a broader understanding of the causes of water scarcity, one can foresee regional vulnerabilities in advance of a crisis. This is particularly useful for government responses and interventions.
1.2.3 Intersection of Drought and Water Scarcity
We have discussed four of the five types of drought: (1) meteorological being the most referred to, then (2) hydrologic, (3) agricultural drought, (4) socio-economic, and (5) ecological drought. These types of drought are seen as forms of a diminished water supply, and all are forms of water scarcity. Water Scarcity can also occur without the supply being diminished by
environmental factors or drought. Ecological drought, while outside the scope of this research, addresses the impacts of drought on multiple ecosystems such forests, vegetation, and livestock
(USGS, 2016). Ecological drought is a crucial element in considering the impacts of drought on
the environment and on farmers or irrigated land.
This study looks at Water Scarcity under agricultural, socio-economic and hydrologic drought conditions, meaning there is a diminished water supply. Consumption patterns at the individual household are relatively low, with the highest rural households consuming around 100 LPCD and peri-urban consuming around 135 LPCD (AAP, 2014-15). The government standard for urban is 135, the standard for peri-urban is 70 LPCD, and the rural standard is now 55 LPCD
(GOI, 2017). For most rural households, consumption rates are much closer to 40-55 LPCD, 11
meaning policy targeting a decrease in household consumption would greatly affect livelihoods. The experience of Water Scarcity in times of hydrological and meteorological drought, meaning subsurface and surface water supplies are insufficient for normal household activities is life threatening. This form of water scarcity will be identified, and Gram Panchayats' vulnerability to this form of water scarcity will be visually displayed for district governments to make policy decisions.
Figure 1.2.2 Groundwater Depletion Heat Map of Aurangabad District comparing 2015 levels to average of the previous 5 year levels
-~ Khuidabad Index No Depstion a3 j 0-1 m Depletion n 1-2 rn Depletion 2-3 Depletion >3 M Depletion Source: GSDA Aurangabad, 2015
Methods for understanding the impacts, effects, and causes of drought have evolved over time in both academic and political fields. It is important to assess this evolving notion of drought, and the related fields of natural hazards and risk, in order to assess the best way to incorporate data into anticipating risk of drought for villages in India.
1.3 Literature review of Methods for Managing Water Scarcity in India
Issues pertaining to the management of water supply and demand in India have been documented for centuries. In order to understand the historical context for water scarcity in Rural India, we first examine the historical distinction between drought and scarcity to understand their
differences. This literature review also outlines the array of modeling methods for basaltic fractured watersheds, as it defines the geomorphologic challenge and will provide insight into methods used to understand groundwater fluctuations. Finally, the literature review will reference the current field of water scarcity planning as the starting point for this research.
1.3.1 Literature Review Abstract
My research entails the development of a water scarcity decision support tool for the state of
Maharashtra to identify Gram Panchayats (multi-village administrative units) most vulnerable to water scarcity. In order to develop such a tool, it is crucial to first explore the concepts of water scarcity and drought to best understand how the notion of each term shapes the reasons for its perpetuation. For India, a long history of farming has made water for irrigation a central focus in the livelihood of the nation, but now even drinking water and industrial water face scarcity. This review addresses literature on the history of drought and water scarcity in India, as well as the history of how to measure, model, predict and remediate water scarcity. A mixture of academic articles, government literature, books, and doctoral theses are referenced in order to develop a robust catalog of water scarcity resources.
1.3.2 Historical Water Scarcity
The notion of water scarcity and drought has evolved over history and geographic boundaries. In India, drought becomes well documented in the early 19th century as the cause of famine, and
drought management was defined in terms of famine relief (Arnold, 1993). Famine relief came most commonly in the forms of irrigation works, where the baseline goal was for every farmer to receive enough water for their crops so that communities had enough food to subsist (Arnold,
1993). This form of drought management is now called "deficit irrigation"- irrigation which
provides enough water for crops to survive, but no more. This led to lower crop yields in India, as the goal of drought management was to provide farmer subsistence (Burgher). These survival goals for drought management were prevalent during British colonial rule, when farmland was vast and there was opportunity for higher revenues with higher crop yields. Drought management became drought mitigation, as the British diverted more surface water flows to irrigation to ensure a cash flow from Indian exports such as shampoo and cotton (Peckham). The concept of drinking water scarcity brought with it health implications in 1 9th century India, as the British
sought to curb contagion of disease by encouraging social hygiene, which involved regular bathing and handwashing (Peckham).
Since Indian independence, the Indian Meteorological Department (IMD) has defined drought as when annual rainfall for a region falls below 75% of expected rainfall. IMD has historically categorized drought into three categories, hydrological drought, meteorological drought, and agricultural drought. Their monsoon forecasts predict rainfall deficits and declare "drought years" in the three drought categories. In January 2016, India Meteorological Department
decided to replace the nomenclature of drought with "more precise" language (Vasudeva, 2016). Instead, the word drought is now being replaced by "deficit".
The Groundwater Survey Development Agency (GSDA), operating in Pune, Maharashtra, operates as a state-level agency and measures water scarcity based on the percentage of
groundwater withdrawn from a watershed or aquifer. GSDA deems a watershed "overexploited" when a community extracts 70% or more of its watershed in a given year, leading to longer-term
depletion issues and dropping of the water table (GSDA, 2015). The term "overexploited" is used to indicate extreme groundwater scarcity. While the GSDA does not govern surface waters or canals, it does work closely with drinking water municipalities as groundwater is the dominant source for drinking water in Rural Maharashtra.
The Government of India defines water scarcity in India for households as a function of water received. Any household receiving less than 40 liters per capita per day (LPCD) is experiencing water scarcity. The State Government of India has a new target of 55 LPCD by 2017 for rural India, meaning a home is water scarce in 2017 if each person has access to less than 55 LPCD (NRDWP, 2015).
Water Scarcity in Maharashtra is currently attributed to a lack of rainfall catchment and
groundwater availability in basins across the state, as described by engineer and Maharashtrian water storage expert, M.M. Dighe (2003). Dighe attributes scarcity to the increasing population and increasing demand for water in rural Maharashtra, accounting for the numerous bore wells competing for, and depleting, the water table. Dighe's water scarcity entails a lack of sufficient drinking water for households to live comfortably on a daily basis, and it is threatened by a lack of dams, groundwater recharge, and overall catchment of the sporadic rainfall Maharashtra receives. Water Scarcity has evolved to become something that is understood based off its categorization, causing it to be fragmented into more and more types of categories from hydrological to socioeconomic and meteorological. Similarly, the field of hydrology is
continuing to expand drought and water scarcity to a problem of not only precipitation changes, but also human demands and climate change as culprits and social vulnerability as a side effect. These changes in academic understanding of water scarcity shape the conceptual framework through which one addresses scarcity.
1.3.3 Water Scarcity Frameworks
Now that we have addressed the evolving historical notions of water scarcity, we are able to define conceptual frameworks for thinking about and categorizing water scarcity. Timing is important in the creation of a conceptual framework for water scarcity. In India, drinking water scarcity is deemed as receiving less than 40 LPCD (NRDWP, 2015) regardless of for how long, although government intervention usually requires an expectation of three months of future water scarcity.
To provide contrast, water scarcity in the United States is not deemed severe unless it persists
more than two years, whereas drought that spans 6 months or more in India is seen as severe. From 1855-63, the West Coast of the United States experienced extreme prolonged drought due to La Nina, the counterpart to El Niio, where sea temperatures drop and trade winds are
incredibly harsh in the Pacific (Cole). In this time, and even now, U.S. drought lasting more than 2 years is regarded as prolonged and intense (Cole). The El Niflo and La Nifia were seen as cyclical, causing water scarcity and drought in the Pacific to be viewed as cyclical changes (Cole). In India, the annual monsoon season is seen as the cyclical 'reversal' of water scarcity.
Sinha in a survey of 900 years of monsoon precipitation shows the increased variability in total accumulated precipitation each year and variability in the intensity of rainfall in order to show that sustained drought is likely to become a more common occurrence (Sinha 2007).
With a fixed amount of rainfall, conceptual frameworks have shifted to understanding not only the supply, but ways to model and curb demand for industrial, household, and agricultural water use. Malin Falkenmark is a leading expert on not only the effects of human demand on scarcity, but the concentrated negative effects on low-income, rural and minority populations. Falkenmark
claims that water scarcity is the key strain on water security, and thus on socioeconomic
development (Falkenmark, 1997). Falkenmark, along with colleagues, addresses the concept of demand-driven water scarcity, how it can be measured by use-to-availability, and postulates the proper reserve amounts as a percentage of total water supply (Falkenmark and Lindh, 1976). Demand-driven water scarcity was coined as "water stress" in 2011 to identify the human and non-human consumption of water as a stress on the overall water system (Kummu and Varis,
2011). The United Nations formally set the mark for high water stress as 40% withdrawal in a
"Comprehensive Assessment of the Freshwater Resources of the World" (UN, 1997), but this has been expanded by Falkenmark in developing nations to 70% withdrawal as the point of overexploitation, where a basin should be closed until recharge has occurred (Falkenmark,
2003).
Within drinking water scarcity, it is broadly accepted that there are two forms: demand-driven water scarcity and population/supply driven water scarcity (Lankford, 2013). Supply driven water scarcity is the result of a lack of sufficient water, including rainfall, surface water, groundwater, and treated oceanic water.
The University of Nebraska, Lincoln provides detailed conceptual frameworks for water scarcity and drought through their Institute of Agriculture and Natural Resources. This institution, which specializes in drought studies, identifies that drought is a "deficiency of rainfall... over an
extended period of time, generally at least one season", where the meaning of deficiency varies widely by geography. Donald A. Wilhite provides a method for differentiating drought from other water crises such as scarcity through a conceptual framework (Wilhite, 2005), while A.F. Loon uses observation-modeling to distinguish drought from water scarcity (Loon, 2013).
The Government of India's Ministry of Water Resources establishes three categories of drought, each measured differently. The Government of India concretely measures and defines
meteorological, hydrological, and agricultural drought (Ministry of Water Resources, 2013). These definitions are used to classify a village or administrative unit in India as 'water scarce', which in turn signals government remediation processes.
1.3.4 Water Scarcity Indices
There are water scarcity and drought indicators or indices, used to identify the relative risk or vulnerability of a region, watershed, or community to an imbalance in water access. The Water Poverty Index is a new, holistic look at the aggregate of many indices and is designed for identifying the vulnerability of a community to risk by aggregating watershed, country, and regional indices (Sullivan, 2002).
The Palmer Drought Severity Index and Crop Moisture Index were the leading indices for drought measures in the 1950's-2000's. Both gave a relative measure of moistness based on temperature and precipitation to estimate the amount of evaporation or evapotranspiration, and were best suited for those reliant on irrigation or groundwater (Palmer, 1965). The Standard Precipitation Index, a less complex index to calculate, was developed in 1993 as an alternative to the Palmer Index to measure the standard deviations away from mean precipitation in a region and provides early warning of drought (NASA.gov).
1.3.5 Impacts on the Rural
Drought impacts on rural communities, particularly in India, differ widely from drought impacts on the urban. The University of Yamanashi, Japan explored the impacts drought have on
Maharashtra, a state with a large rural and farming population and a state that produces 15% of India's gross domestic product (Ichikawa et al, 2014). This study found that the depletion of water resources in rural Maharashtra had high impacts on agriculture and food security for the state as a whole. They point out that the 2012 drought in India caused the nation's gross domestic product to decrease by 0.5%. The study also shows the varying degree of water quality among private water tankers, and the cumbersome process involved with retrieving water out of a depleted well.
There are also large questions of livelihood and gender inequality during rural drought in India, addressed by Krishna in an exploration of community resource management (Krishna, 2004). Krishna addresses the dangers of women retrieving water late at night, the inability to attend school, and how rural industries rely more heavily on water, and thus does their livelihood (Krishna, 2004).
Falkenmark, Lunddqvist, and Wildstrand provide insight into the micro-scale approaches to the vulnerability of drought in semi-arid regions of India in order to develop large-scale strategies for mitigation (1989). The vulnerability to drought is assessed against the counterfactual, where
drought iessons over time, in a study by Dr. Gopalakrishnan in order to illustrate that poverty and environmental degradation are likely effects of drought (1993).
International studies on rural drought in arid regions on impacts of the family, the farm, gender equity, education, and livelihoods are found on Tanzania (Krishna, 2004), Nepal (Merz et al,
2003), Australia (Bettini et al, 2013), Brazil (Garcia-Torres et al, 2003), and Canada (Sanyal,
2015).
1.3.6 Modeling Scarcity in India
There are a variety of hydrological modeling methods relevant to water scarcity, as well as some more general climatic, natural disaster related modeling and general vulnerability modeling methods. Although it deals with geohazards, a relevant survey of modeling techniques includes Pradham's "Terrigenous Mass Movements", which explores methods for modeling and mapping vulnerability to natural disaster. These methods include risk mapping, "data modeling,
topography, geology, geomorphology, remote sensing, artificial neural networks, binomial regression, fuzzy logic, spatial statistics and analysis, and scientific visualization" (Pradham et al, 2012).
Remote sensing of bore wells has become a successful way to monitor water levels and water management, though it has limitations in hardrock terrain (Rao, 2003). Remote sensing has also been found effective for measuring evapotranspiration of crops, and is well suited for rural, arid India, as was found in a 2001 study (Srinivas 2001). Remote sensing data have also been successfully incorporated into GIS for mapping of water resources by the International Astronautical Congress (Jeyaram et al, 2006).
Demand modeling of water using non-spatial modeling, such as system dynamics modeling, has been demonstrated by the Massachusetts Institute of Technology in a 2011 study on Singapore (Welling, 2011). Methods for multi-variable econometric regression for water demand and prediction based on population and environmental factors are analyzed by the Institute for Water Management in Dresden, Germany (Koegst et al, 2008).
Maharashtra faces unique challenges in modeling its groundwater due to the nature of basaltic fractured hard rock. A notable study on the formation of basaltic aquifers in India was conducted to address the complexities of the structures to be modeled. Measuring potentialities for
groundwater in basaltic hardrock in India is a method that allows for error and interquartile ranges. Kriging, a geostatistical method used in the Oil and Gas industry is also used in some groundwater models when one can assume uniformity of the soil or rock underneath the surface (Khan et al, 2016). An alternative method for randomizing water levels across an unmapped aquifer is Monte Carlo simulation, which requires large amounts of data for the strata types and depths below all observation wells (Khan et al, 2016). The most commonly used method today for modeling groundwater in hard rock is still the pumping test, which is an empirical method
that requires pumping all of the water out of an irrigation well and measuring recovery rates (Shah, 2012).
Service delivery models for drinking water in India are analyzed in a study by the Naandi Foundation (Kumar et al, 2014). Modeling monsoon rainfall variability using national Indian data has been completed in a 2014 study (Ranade et al, 2014). Drought characterization,
modeling future predictions of drought, and modeling change and down-scaling are all addressed in a 2015 study of international drought modeling and mitigation (Senaut, 2015).
1.3.7 The Modem Field of Planning: Drought and Scarcity
In March 2016, U.S. President Obama released a Federal Action Plan for Long Term Drought Resilience, which included a memorandum, action plans, progress reports, and a tracking of actions taken'. The US Bureau of Reclamation is offering WaterSMART grants for funding small, on the ground projects as well as large scale energy efficient and water conservation projects and planning improvements for drought2. This shift towards increased research in the drought planning field has been gradual, as can be seen in Figure 1.3.7.1, showing the number of English-written books referencing Drought Planning, peaking in 1990 and again after 2008.
Figure 1.3.7.1 Drought Planning references in English books
0.000000500% 0.000000450% 0.000000400% 0.000000350% 0.000000300% 0.000000250% 0.000000200% 0.000000150% 0.000000100% 0.000000050%. DruhDrought 0.000000000% 1900 1910 1920 1930 1940 1960 1960 1970 1990 1990 2000
(cM n hNi1sifar fOcus. 9&ftPWaodfoaactcw=8%*N*)
Source: Google Ngram Viewer, 2017
This trend helps to narrow the scope of drought planning to its relative inception in the 1970's, its peak in the 1990's, and the current field as it stood in the 2008 time frame.
We are seeing the most data-intensive forms of drought planning research in academic
dissertations and theses, with modeling, prediction, and decision support systems designed, such
I https://www.whitehouse.gov/campaign/drought-in-america 2 http://www.usbr.gov/watersmart/grants.html
as a recent Texas A&M dissertation that integrates risk, two new multivariate indices, and a decision support tool (Deepthi, 2014).
The University of Nebraska, Lincoln has a leading center on drought planning (UNL, 2016). The current framework for rural drought planning in the United States consists of a balance sheet where supply and demand are calculated, with water quality compromised supplies are
subtracted from the total supply. A target is set for the amount of water in reserves, and when supply falls below a certain level actions are triggered.
The current framework for water scarcity in India consists of a bottom-up "signal" for scarcity, and then a top-down response. Water scarcity is experienced at the village level, paperwork is submitted to a Block Development Officer (BDO), and then either the BDO or District
determines the type of response, if any, to be provided to the village. This process is timely and does not provide Districts any insight to plan for future water scarcity. The process is designed for rural villages who receive less than 40 LPCD, for which it receives applicants during three quarters of the year. Applications are not received during monsoon season. The government enlists one of seven approved responses to remediate the drinking water, ranging from short to long-term solutions and vary in cost. The policy responses are listed in the table below.
Figure 1.3.27.2 Policy Responses to Water Scarcity Applications in Maharashtra
1. Provide Shallow Trenches in Riverbed
2. Deepening and Desilting of Wells
3. Acquisition of Private Wells
4. Providing Water by Tanker/Bullock Cart
5. Special Repairs of Piped Water Supply Schemes
6. Provide a Tubewell
7. Provide Temporary Piped Water Supply
IIT Bombay, IIT Roorkee and a variety of other institutions in Maharashtra, Gujarat, and Uttarakhand India have produced sophisticated research on predictive techniques for water management, aquifer mapping, applications of sensor technology to water supply estimation of surface and groundwater, and techniques for curbing agricultural and household consumption of water in villages. There is a lack of integration of socio-economic vulnerability with
hydrogeological vulnerability.
1.3.8 Literature Review Conclusion
This literature review provides historical context for water scarcity research in India, as well as the general shift in the field of water management to conceptualize, model, and respond to water scarcity. While the concept of water scarcity is not new to rural Maharashtra, a region heavily
reliant on irrigation, we are entering a new era of sustained drought that current literature does not adequately address. The policy and practical responses to higher severity drought and longer-term water scarcity require a multi-year planning process and a new suite of planned responses. In Maharashtra, the water scheme investment plans, called "Annual Action Plans" occur on an annual basis, and serve as systematic planning processes for water scheme construction and alteration in rural Maharashtra. These plans are not compared year to year, and long-term solutions are often unable to be reached due to the need for quick solutions to drinking water scarcity. While water tanker use is widely discouraged as a long-term fix, government funding limits the response to scarcity-prone villages to one action at a time. This means, provide a tanker for instant relief and assume the monsoon season will relieve this need, or construct or mend sources for water withdrawal.
Water scarcity, in the form of depleted rainfall, or scarcity due to water stress is increasingly hard to predict as rural Maharashtra is covered in publically dug wells, as well as non-sanctioned privately dug wells for human consumption and irrigation. The lack of proper community
management at the aquifer and sub-basin levels often leads to a scurry in newly prolonged dry seasons for groundwater.
This research on water scarcity planning in Aurangabad will augment existing practices for management of a scarce resource for drinking water, while introducing new concepts regarding the modeling of vulnerability to water scarcity, and the suite of policy responses available to
each block (Taluka). There is a striking parallel between natural disaster modeling and drought modeling, making it a natural connection to design a drought model with the existing natural disaster modeling methods already established.
1.4 Research Questions and Objectives
The primary research question is how can the district planning process for water scarcity be improved with a numeric model to identify drought risk? This research question is further broken down into two lines of thinking: how can the data being collected by the district and state
agencies be used to anticipate future drought risks, and how can data models be integrated into the current planning process.
The objectives of this research are to make the planning process more proactive, to understand how a variety of factors, including rainfall, affect groundwater levels, and to provide a decision support tool that can be used for scenario-based modeling of Gram Panchayats groundwater levels.
1.4.1 Gaps in Current Water Scarcity Planning and Management
As is referenced in the Literature Review, there is a lack of sophisticated data integration in current water scarcity frameworks as it can be cumbersome and up-front costs are high. Much emphasis is put on predicting rainfall, but not on how that variability disproportionately affects
Gram Panchayats. There is also a lack of conjunctive groundwater and surface water
management, as in India different state agencies control the two sources of water, politicizing the possibility of conjunctive management.
1.4.2 Connection of Data Sources to Planning Process
The District Governments of Pune and Aurangabad, as well as the Groundwater Survey and Development Agency of Maharashtra have expressed an interest in using their existing data sources to the planning process. Our partnership began with a statistical analysis of Annual Action Plan data from 2014-2015 to notice trends in the types of projects, forms of scarcity, and characteristics of villages being selected for water scarcity remediation measures. These data, along with Groundwater Prospect Map data, a century of rainfall data, Observation Well data, the Integrated Management Information System (IMIS) repository, and Government of India Census data from 2011 have been cleaned, combined, and analyzed for trends, relationships and statistical significance in advance of the model creation. This process was done as an initial step to understand how projects have been selected, and the types, timing and recurrence of water scarcity in Aurangabad District as well as Pune District. Initial reports were presented in person in Maharashtra in January 2015 and August 2016 to ensure applicability of research and
feasibility of integration with existing planning processes.
1.4.3 Expanding the Range of Choice
Aurangabad district is aware of the sustained drought and the changing nature of monsoon seasons. Their fractured basaltic hardrock makes it difficult for geologists and hydrologists to predict exactly where water sits and where rainfall recharges the land without aquifer maps, which are being mandated by the federal government but have not been completed in
Aurangabad. Many regions of Aurangabad experience water scarcity at some point in the span of a calendar year, but the timing, cause and severity have become seemingly unpredictable.
By developing a model to help assess the risk of groundwater scarcity in Gram Panchayats,
districts are able to react to the problem earlier, and possibly differently than if they had less time to react. This expands the range of choices and policy responses a district can employ. The late
scientist, hydrologist and professor Gilbert F.White studied how in disaster preparedness and response planning, when a government can consider the full range of choices they are less bias to pick one over another (White, 1986). Ultimately, this would improve the management process of water scarcity planning in India by limiting a bias towards the quickest solution.
1.4.4 Summary of Research
Chapters two through four will outline the conditions of our study's location , how the risk score was calculated, and how the results of this research could be introduced to the existing annual
District Water Security Plan. Methods tried but not ultimately used for the risk score are located in the appendix.
Chapter 2: Aurangabad District Case Study
The federal government, referred to as the Government of India (GOI), mandates general rules such as national limitations on well-depths (60 meters) and minimums for drinking water (55 LPCD by 2017), but it recognizes that states develop regulations for consumption and
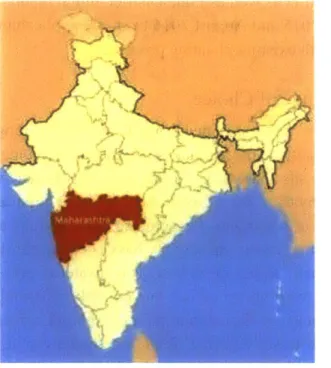
distribution of groundwater and surface water (GOI, 2011). Indian States govern most aspects of water, including drinking water and irrigation water. This allows for tailored policies to distinct geographies, but also creates challenges regarding coordination of interstate rivers, canals and watersheds. The state of Maharashtra, shown in Figure 2.0.1, spans the coastline, desert, and mountains adding many layers of complexity to state-level water management.
Figure 2.0.1 Maharashtra State Highlighted in India Map
Source: GSDA Mumbai, 2017
The state of Maharashtra is the focal point of this research project. The following is a brief explanation of the social and environmental landscape of the state. Maharashtra is a state with extremely high literacy rates relative to the country, and home to two large cities; Mumbai and Pune. In terms of area, the state is predominantly agrarian, and is comprised of 70% basaltic hardrock and associated black cotton soils. The state has 114,200,000 people according to the
2011 national census, and its cities and peri-urban regions are expected to increase in population (Hui, 2017).
Figure 2.0.2 Divisions of Maharashtra State
Source: Google Images, 2017
Figure 2.0.2 displays the six divisions of Maharashtra state, which each contain four to eight districts. Maharashtra on its west side is home to the Konkan Division, known for high rainfall,
lush terrain, and high salinity coastal soil due to its proximity to the ocean. On one field visit to a village in Raigad District, I sampled a glass of water collected from a rice field with a TDS of over 3000. This brackish water limits groundwater utilization, forcing rural communities to rely heavily on the vast rainfall during monsoon seasons to carry them through the year. Their soil is best for rice and coconut crops. While water scarcity is not an issue, storage capacity of rainfall and water quality are threats to their drinking water supply.
The central part of Maharashtra state, the Aurangabad Division, is home to the Godavari basin, named after the Godavari river. This area is a part of the Marathwada region, an arid to semi-arid region with low rainfall in monsoon season and limited surface water. Eight districts within Maharashtra state rest within the Marathwada region, one of which is Aurangabad district. The entire Marathwada region is known for its proclivity to drought. Aurangabad is the regional headquarters and will be the case study for this research.
Bhandara liandurandl jagaon db Now* Choaur mumrbal Suburban hange city a Amaravati Division Aurangabad Division Konkan Division Nagpur Division ur Nashik Division
SPune
DivisionThe varying geography and climate of Maharashtra state, as is seen in the contrast between the Konkan and Aurangabad divisions, makes water planning at the state level challenging. This has led the State of Maharashtra to empower its district governments to shape planning practices and standards that encourage financial and water sustainability under the conditions unique to their regions. This study intends to enhance the existing planning practices at the district level by identifying regional risk to drought and regional socio-economic vulnerabilities.
Figure 2.0.3 Aurangabad District
Soegaqn 0
Phulambri
Paithan
Source: GSDA Aurangabad, 2016
Aurangabad district, as seen in Figure 2.0.3, is comprised of nine blocks. The district is the headquarters for the Aurangabad Division of Maharashtra State, governing the arid and semi-arid Marathwada region. Aurangabad District has a history of water innovation, with some structures still in operation from the 1600s.
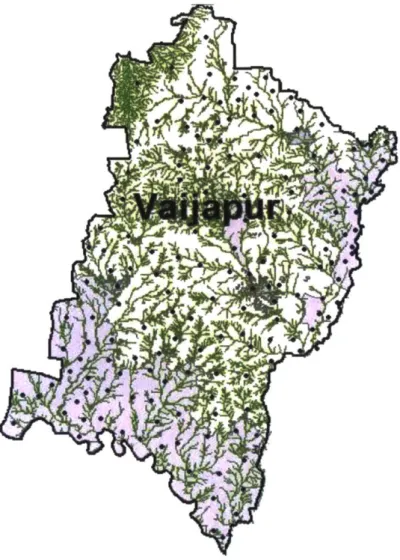
Figure 2.0.4 Vaijapur Block with Drainage Points in Green
Source: Paige Midstokke, 2017 with GSDA data
A Block Development Officer (BDO) governs a block, also referred to as a "tehsil" or "taluka".
The BDO receives requests from villages and makes preliminary decisions or final decisions in emergency situations, before the District government reviews these requests. All Block
Development Officers are appointed for a set period, and their primary role is to oversee the Gram Panchayats in their blocks and to communicate between Panchayats and the District. When a village requests assistance due to water shortages, Block Development Officers review the completeness of the Village or Panchayat application before it is seen by the District, or if an emergency, approve tankers to be sent directly to the requesting community.
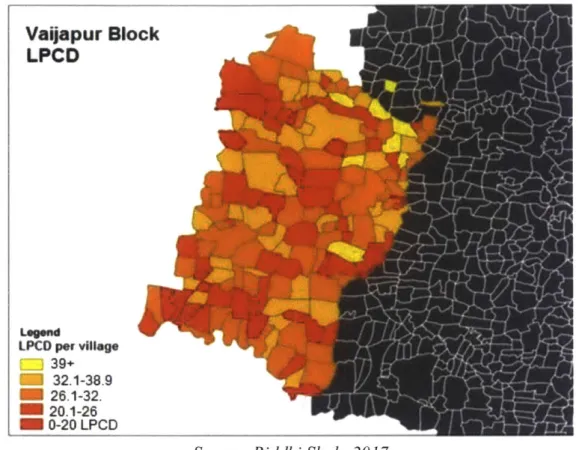
2.0.5 Heat Map of LPCD in Vaijapur District
Vaijapur Block
LPCD
LPCD per vilage ~ 39+ _ 32.1-38.9-
26.1-32. 20.1-26-
0-20 LPCDSource: Riddhi Shah, 2017
Figure 2.0.5 Displays the pattern of LPCD ranges across Vaijapur Block. One can see that there are 3-5 village clusters with red, or extremely low, LPCD meaning government mitigations could occur at the cluster level rather than village level. While Vaijapur has many high scarcity
villages, noted in red as less than 20 liters per capita per day, the district of Aurangabad has a long history of managing low rainfall with high irrigation demand on water.
2.1 Historical Water Context and Landscape
Aurangabad district has a history rich in water systems, as well as the famous Daulatabad Fort,
Bibi Ka Maqbara - a tomb made in the likes of the Taj Mahal -- Panchakki, and the Ajanta and
Ellora Caves. Panchakki, a water mill, was built circa 1695 A.D. and remains functional in Aurangabad city. This mill sits in front of a mosque with an oblong reservoir, and uses energy from a spring to run the flour mill. This flour mill was used to serve visitors, pilgrims, and later to feed an orphanage. Water is fed to Panchakki from a well eight kilometers away, through an underground conduit. There water falls into the Panchakki cistern producing enough energy to turn the mill. Prior to Panchakki, Aurangabad had a sophisticated water delivery system with its
earliest aqueduct built in 1612 upon the discovery of groundwater at the foot of mountains north of Aurangabad city. There has historically been a shortage of reservoirs, surface water, and rain in Aurangabad making it necessary to deliver water from elsewhere. This aqueduct served as the basis of the Nahr (conduit) water system and supported a population of approximately 700,000 people. By 1803, two more aqueducts were built by to support the increase in population and water demand.
As Aurangabad city's administrative boundaries expanded to Aurangabad district, covering over 10,000 square kilometers of land, the district continued to face challenges supplying sufficient drinking water and irrigation water. Observation wells are constructed to monitor the quality and quantity of groundwater as it is the primary source of drinking water for rural district residents. There are currently 141 observation wells in Aurangabad District, with the intent of expanding to
714 observation wells for their district's Groundwater Prospect Map by 2020. District officials select wells by mapping the district and marking the varying terrain. Wells are selected across the district to ensure that a variety of terrain and all varying climates within the district are monitored. GSDA, with the guidelines of the Ministry of Drinking Water and Sanitation's Rajiv Gandhi National Drinking Water Mission Project, selects wells based on construction-type, with priority given to bore wells as seen in Figure 2.1.1 below.
Figure 2.1.1 Preference of Well Selection for Observation by Ministry of Drinking Water and Sanitation
Priority Number Well Type
1 Irrigation Bore/Tube Well
2 Water Supply Bore/Tube Well
3 Irrigation Dug Well
4 Hand-Pump Well
5 Dug-Wells Community Water Supply
6 Dug-Wells Individual House
Vaijapur Tehsil has three observation wells, housing over 100 villages and 41,296 people (Census, 2011). Vaijapur sits 514 meters above sea level, and is known as the "Gateway to Marathwada" for its 18th century war-torn history under the Moghul Empire, followed by the
Marathas. Vaijapur district has a rail connection with both Mumbai and Hyderabad, positioning itself to be a region of growth for those wishing to reside in the rural countryside and travel or work in a metropolitan city. Even with its connectivity to nearby cities, it remains an agriculture dominant tehsil.
The Narangi River flows through Vaijapur district, with a Narangi-Vaijapur dam located northwest of Vaijapur city. This dam contains the Vaijapur reservoir, a reservoir used exclusively for irrigation. It was completed in 1998 and has a live storage capacity of 11.5 million cubic meters (India WRIS).
2.2
Existing Planning Practices
District Governments within Maharashtra State deploy existing annual drinking water planning procedures to budget for the upcoming year. This process involves gathering quantitative data; but no goal setting, qualitative measurements, or multi-year objectives. Planning for water is based around the monsoon season, assuming that the post-monsoon season will require no water tankers or shortages due to the heavy rainfall accumulation.
Planning practices include assessing a financial budget and selecting villages that will receive assistance due to issues of water quality, failures of piped water supply schemes, or inability to receive 55 LPCD from current water scheme(s). Some of these villages are identified by Block Development Officers, some self-nominate, and some are selected by District officials. The selection process for these villages into the Annual Action Plan for water varies between districts in Maharashtra. In some cases, it is desirable to select "low-hanging fruit" villages who are close to 55 LPCD in order to report to the state a high success rate in village interventions. In other cases, districts choose to assist the most vulnerable and lowest LPCD receiving villages.
Figure 2.2.1 Variables collected Aurangabad District
on Villages selected for the District Annual Action Plan in
Column AAP Variables
1 District 2 Taluka 3 Gen Total 4 Gen Covered 5 Gen Uncovered 6 SC Total 7 SC Covered 8 SC Uncovered 9 ST Total 10 ST Covered 11 ST Uncovered 12 Total Pop 13 Total Covered 14 To Uncovered 15 Total % Uncovered 16 APL HH 17 BPL HH 18 Total HH 19 No of Sources 20 Detail of sources
21 Completion Year of Previous Scheme
22 Present LPCD 23 % Coverage 40 LPCD 24 % Coverage 55 LPCD 25 WQ 26 WQ Test Report 27 NRDWP Category 28 20 Pt target 29 Ongoing New 30 Scheme Name 31 Scheme Type 32 Source Category 33 Scheme Sanction Year 34 Sanction Date
35 Program Head
36 Present Stage Scheme
37 Expected Month Completion 38 Excepted Year Completion 39 Implementing Agency
40 Proposed Subworks 41 Total Est Cost 42 GOI Share Cost 43 GOM Share Cost 44 Project Population
45 Number of Habitations in Scheme 46 Per Capita Cost
47 Funds Released to ZP 48 Gen Govt Fund Required 49 SC Govt Fund Required
50 ST Gov Fund Required 51 Total Govt Fund Required
52 Central Share 53 State Share
54 Gen Fund Required
55 SC Fund Required 56 ST Fund Required 57 Total Fund Required 58 Minority Dominance 59 VWSC
60 Details of Classification 61 Site Verification?
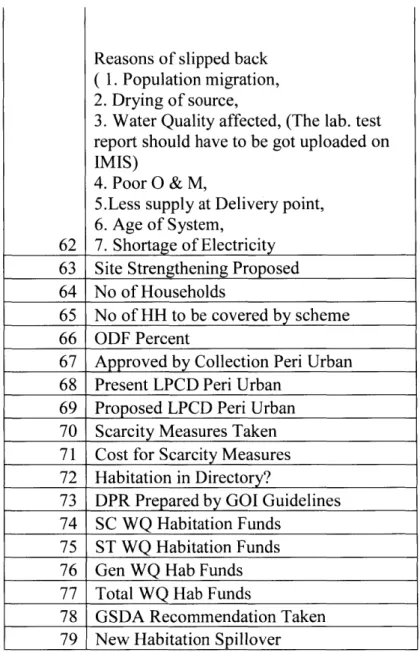
Reasons of slipped back
( 1. Population migration,
2. Drying of source,
3. Water Quality affected, (The lab. test
report should have to be got uploaded on
IMIS)
4. Poor O & M,
5.Less supply at Delivery point,
6. Age of System,
62 7. Shortage of Electricity 63 Site Strengthening Proposed 64 No of Households
65 No of HH to be covered by scheme
66 ODF Percent
67 Approved by Collection Peri Urban 68 Present LPCD Peri Urban
69 Proposed LPCD Peri Urban 70 Scarcity Measures Taken 71 Cost for Scarcity Measures
72 Habitation in Directory?
73 DPR Prepared by GOI Guidelines 74 SC WQ Habitation Funds
75 ST WQ Habitation Funds 76 Gen WQ Hab Funds 77 Total WQ Hab Funds
78 GSDA Recommendation Taken 79 New Habitation Spillover
Figure 2.2.1 depicts the variables gathered and tracked within a single year for all villages in the Aurangabad Annual Action Plan. The Annual Action Plan consists of the villages selected for
some form of infrastructure assistance to improve their village or multi-village level water scheme. The Annual Action Plan tracks finances, water needs, socioeconomic data, and other information listed in Figure 2.2.1 in order to keep track of their yearly projects.
Each district submits its plan to the state, but these annual action plans are not combined or analyzed at the state level. Formatting of plans varies slightly by state, making combining reports tedious, and state governments do not currently have personnel to analyze water infrastructure
projects across districts, or across years for a single district. It is compelling for district governments to use their historical data to make projections about future water planning decisions to anticipate funding requests from the state.
2.3 Climatological Conditions
Aurangabad District, and thus Vaijapur Tehsil, reside within the semi-arid Marathwada Region of India. Climate is particularly dry outside of monsoon season, with an annual mean
temperature ranging from 17 to 33 degrees celsius, depending upon time of day and year. The climate of Vaijapur is a part of the steppe zone, as precipitation is anticipated to be slightly less than evapotranspiration annually. As a steppe climate, Aurangabad receives slightly more rain than a desert, but it is received in high intensity during the monsoon season, in some cases increasing runoff and limiting recharge.
2.3.1 Reported Rainfall (mm) for Aurangabad District from 1990 - 2015, source India
Meteorological Department CD 0) 0) In 1990 1995 2000 2005 2010 2015 Time
Source: Paige Midstokke, 2017
Figure 2.3.1 depicts the rainfall from 1990-2015 in Aurangabad, calculated as an average of four sites measured daily within Aurangabad district. Rainfall for the district averages 710 mm annually, 595 mm or 83.8% of which are received during the monsoon season of June, July, August and September. Using the total district average for rainfall from 2011-2016, Vaijapur district received 12.1% more rainfall than Aurangabad district with an average of 735 mm compared with the district five year average of 634 mm.
2.4 Hydrologic and Geologic Conditions
Aurangabad District is a part of the Deccan trap, a region entirely covered by basaltic lava. This lava is now fractured basaltic hard rock. The typical strata consists of a vesicular basalt in upper
I
WA