CIDA Ref: 7038883 CEA Ref: 604138 INRS Ref: R1327 ISBN Ref: 978-2-89146-710-0 December 2011
FINAL TECHNICAL REPORT
Hydrogeological Assessment Project
of the Northern Regions of Ghana (HAP)
VOLUME II
Water Resources
Database Development
S
UMMARYThis report documents the work carried out to establish a sustainable groundwater resources database at the WRC. This database will contribute to the strengthening of WRC’s institutional capacity and will at the same time help the WRC fulfill its central coordination role in integrated water resources management and planning in the water sector of Ghana.
The Arc Hydro database model was used to create a groundwater and surface water database for the Northern Regions of Ghana referred to as the WRC Water Resources Database. The Arc Hydro database model was chosen because it was designed by experienced GIS and water analysts and because it is offered freely to the GIS community. However, since it only offers a basis for the creation of a database, this model had to be modified and customized in order to meet the WRC data management needs. These modifications notably involved the creation or modification of database feature classes, domains and relationships.
Following the creation of the WRC Water Resources Database template, available groundwater data and part of the surface water data collected under the HAP or provided by the WRC were imported into this database using Arc Hydro tools. The import process required available data to be reorganized and standardized. Additional data were also generated to complement the existing information.
While the resulting database can provide a sustainable groundwater and surface water data repository for the WRC, additional work could improve the quality and quantity of water data stored in the database. Notably, some of the existing data still need to be verified against original borehole logs in order to correct remaining errors (e.g. keypunching errors) and also to add missing data, if necessary. The most important task to ensure the long term usefulness and continued existence of this database will however be related to database management. While this can be facilitated by standardizing data entry at the source (i.e. data coming from NGOs, donors, or contractors) and data integration operations at the WRC, adequate resources (i.e. human, financial, technical) will be required at the WRC in order to manage the database in an efficient and sustainable way.
T
ABLE OFC
ONTENTSPage 1. INTRODUCTION ... 1-1
1.1 Background ... 1-1 1.2 Objectives and report content ... 1-1 2. DATA COLLECTION ... 2-1 2.1 Groundwater data ... 2-1 2.1.1 Overview of data consolidation ... 2-1 2.1.2 Collection and integration of additional groundwater data ... 2-2 2.1.3 Groundwater data collection summary ... 2-3 2.2 Surface water data ... 2-3 3. DATABASE MODEL ... 3-1 3.1 Evaluation and selection of database model ... 3-1 3.2 Description of Arc Hydro database model ... 3-1 3.2.1 Database file format ... 3-2 3.2.2 Overview of architecture ... 3-2 3.2.3 Arc Hydro Groundwater tools ... 3-5 4. DATABASE MODEL CUSTOMIZATION ... 4-1 4.1 Database structure ... 4-1 4.1.1 Framework component ... 4-1 4.1.2 Borehole component ... 4-3 4.1.3 Hydrostratigraphy component ... 4-3 4.1.4 Time series component ... 4-4 4.1.5 Other database components ... 4-4 4.2 Database validation features ... 4-5 4.2.1 Attribute validation rules ... 4-5 4.2.2 Spatial validation rules ... 4-5 4.3 Database coordinate system ... 4-5 5. DATA INTEGRATION ... 5-1 5.1 Groundwater data ... 5-1 5.1.1 Preparation of data to be integrated ... 5-1 5.1.2 Data import into the database ... 5-2 5.2 Surface water data ... 5-4 5.2.2 Data import into the database ... 5-4 5.3 Database content summary ... 5-5 6. CONCLUSIONS AND RECOMMENDATIONS ... 6-1 6.1 Additional work ... 6-1 6.1.1 Remaining data gaps and errors ... 6-1 6.1.2 Additional modifications to existing data ... 6-2 6.1.3 Integration of complementary data ... 6-2 6.2 Guidelines for database management ... 6-3 7. REFERENCES ... 7-1
T
ABLESTable 2-1 – Summary of available daily streamflow datasets ... 2-4 Table 2-2 – Summary of available monthly rainfall datasets ... 2-5 Table 2-3 – Summary of available daily rainfall datasets ... 2-6 Table 4-1 – List of WRC Water Resources Database relationships... 4-5 Table 4-2 – List of WRC Water Resources Database domains ... 4-6 Table 5-1 – Complementary information appended to data before integration ... 5-2 Table 5-2 – Summary of data field correspondence between HAP consolidated data and WRC Water Resources Database ... 5-3
F
IGURESFigure 3-1 – Main components of the Arc Hydro groundwater database model ... 3-3 Figure 3-2 – Example of database feature relationship using HydroID (Strassberg, 2008) 3-5 Figure 4-1 – Simplified diagram of WRC Water Resources Database ... 4-2
A
PPENDICESAppendix A: Preliminary database assessment
Appendix B: Data field correspondence between HAP consolidated data and WRC database Appendix C: HydroID assignation procedure
Appendix D: Borehole numbering scheme and HydroCode assignation procedure Appendix E: Electronic documents
Appendix E-1: WRC Water Resources Database content report Appendix E-2: WRC Water Resources Database schema report Appendix E-3: WRC Water Resources Database template
L
IST OFA
CRONYMS ANDA
BBREVIATIONSAHGW Arc Hydro Groundwater
AFD Agence Française de Développement
CGIAR Consultative Group for International Agriculture Research CIAT International Centre for Tropical Agriculture
CIDA Canadian International Development Agency CSI Consortium for Spatial Information
CWSA Community Water and Sanitation Agency (Ghana) ESRI Environmental Systems Reseach Incorporated
EU European Union
GIS Geographical Information System
GLOWA Globalen Wasserkreislauf (Global Change in the Hydrological Cycle) GSD Geological Survey Department of Ghana
GWW Ground Water for Windows software
HAP Hydrogeological Assessment Project of the northern regions of Ghana
HGU Hydrogeologic units
HSD Hydrological Services Department of Ghana MSD Meteorological Services Department of Ghana
NGO Non-governmental organization
RDBMS Relational database management systems SRTM Shuttle Radar Topographic Mission (NASA) SWERA Solar and Wind Energy Resource Assessment
UN United Nations
WATSAN Water and Sanitation WHO World Health Organization
WRC Water Resources Commission (Ghana) WRI Water Research Institute (Ghana) WVI World Vision International
1. I
NTRODUCTION 1.1 BackgroundThe Hydrogeological Assessment Project (HAP) of the northern regions of Ghana was designed to contribute to the collection and analysis of scientific data on groundwater with the long term objective of improving groundwater resource management and development in the northern regions of Ghana, and thus contribute towards achieving the WATSAN targets set within the Ghana Poverty Reduction Strategy through “…and enhanced knowledge base and understanding of the hydrogeological conditions in the north of Ghana”.1
One of the first steps towards the realisation of HAP objectives consisted in establishing the basis for current knowledge of the hydrogeological setting by assessing and consolidating the content of the electronic hydrogeological databases made available by stakeholders. Adequate and sustainable storage and management of these consolidated data required the development of a new database
1.2 Objectives and report content
This report documents the work carried out to establish a sustainable groundwater resources database at WRC (referred to as the WRC Water Resources Database in this report). This database will contribute to the strengthening of WRC’s institutional capacity and will at the same time help the WRC fulfill its central coordination role in integrated water resources management and planning in the water sector of Ghana.
The Arc Hydro groundwater database model (Strassberg et al., 2007) was selected to serve as the basis for the creation of the WRC Water Resources Database. This database model is the result of many years of work by experienced GIS and water analysts that is offered freely to the GIS community. It offers the possibility to manage and analyze both groundwater and surface water and can be adapted to suit user needs. This database model will not only help improve data access and management but it also gives the possibility to WRC to ensure data integrity and sustainability.
This report first presents an overview of the electronic water-related data collected under the HAP. This is followed by the rationale behind the selection of the Arc Hydro database model and by the description of the Arc Hydro database model itself. The modifications made to this database model to meet WRC’s needs are then summarized, followed by an overview of the methodology used to import the water-related data already collected and stored in the database. Finally, the way forward for the sustainable management of this database is discussed.
1 Memorandum of Understanding between the Government of Canada and Ghana for the Hydrogeological
2. D
ATA COLLECTION2.1 Groundwater data
In the first year of the HAP (2006), electronic data were obtained from various sources. Electronic databases containing hydrogeology-related information were identified and obtained from the following stakeholders in the electronic format indicated in parentheses:
Agence Française de Développement (AFD) (MS Excel file)
Canadian International Development Agency (CIDA) (MS Excel file) European Union (EU) (MS Excel file)
Global Change in the Hydrological Cycle Project (GLOWA) (MS Access file) Water Research Institute (WRI) (Ground Water for Windows (GWW) file)
World Vision International (WVI) (Ground Water for Windows (GWW) file)
The first three databases, obtained via the Community Water Supply and Sanitation Agency (CWSA), contained only new records2 from recent projects carried out mainly in the Northern Region. The GLOWA database contained records collected from different sources, notably private drilling companies, regional CWSA offices and the WRI. Although research conducted under the GLOWA project mostly concerns the Volta Basin, this electronic database contained records for all of Ghana. On the basis of this review of databases contents, the WRI database was considered the most complete hydrogeological database for the northern regions of Ghana at the time of data collection and comprised records from many water supply projects carried out in the northern regions. The WVI database contained records created under WVI projects and some records from the WRI database for the Northern Region that were considered as duplicates for the consolidation of collected data. A few records from various smaller water supply projects were also obtained from the CWSA.
The content of the electronic databases obtained through the above mentioned stakeholders were validated and consolidated into a unique database to serve HAP’s purposes and to help for future hydrogeological projects in Northern Ghana. To facilitate the validation and consolidation process, all databases were converted into MDB files (i.e. Microsoft Access Database files). Some manual data transfer was required for databases in the GWW format as some data fields (e.g. lithology) could not be exported automatically in a convenient format. Prior to consolidation, the content of each database was assessed to identify 1) unique records among all available databases, 2) reliable records among these unique records (N.B.: reliability based on location data) and 3) resultant data gaps within the unique and reliable records. The first objective was aimed at eliminating redundant and duplicate information for data consolidation while the second and third objectives were aimed at establishing the need for additional data collection to achieve HAP’s objectives.
2.1.1 Overview of data consolidation
The identification of unique records was not done the same way for all databases as reference information (e.g. report ID, project ID …) was not always available. The records from the AFD, EU and CIDA databases were all considered unique since they came from recent projects and were unlikely to have been entered in any other database yet (and thus duplicated). Consequently, a thorough verification of record uniqueness was not undertaken for these databases. For the GLOWA and WVI databases, it was generally possible to determine the presence of redundant records through database queries. As most of these records were originally taken from the WRI database, records from the latter were considered unique while redundant records in the GLOWA and WVI databases were identified as duplicates. The complete methodology is outlined in a preliminary database assessment presented in Appendix A (N.B.: results from this report have been updated since, as described below).
The evaluation of record reliability was carried out only for the data fields containing well coordinates, i.e. longitude and latitude. As original location data (e.g. hard copies of borehole logs) were generally not available, coordinates reliability was evaluated using spatial analysis functions with respect to administrative boundary and community GIS layers. Records identified as unreliable were flagged and kept for future and more thorough verification. It is important to mention that this was a time consuming task and that, therefore, it was not carried out with the same level of detail for all databases. An example of the process followed for the identification of reliable records is given in the preliminary database assessment report provided in Appendix A. While a complete analysis of all databases could have yielded more reliable records, the effort needed to accomplish this was considered disproportionate at the time in regards to the results that would be obtained.
For the HAP’s purposes, the following data fields were considered to be the minimum data requirements3 to carry out the necessary hydrogeological analysis: 1) Well state, 2) Well depth, 3) Lithology descriptions, 4) Static groundwater level, 5) Yield and 6) Water quality data (pH, conductivity. Fe, Mn, F). The identification of data gaps for these data fields is twofold: 1) identification of gaps in terms of data quantity and 2) identification of data gaps in terms of spatial distribution of data. The former was simply done through statistical analysis. Records containing information for each of these data field were compiled in order to evaluate the quantity of data available for each data field. The records resulting from this compilation were then plotted for each data field to assess their spatial distribution. This was done with reference to a 15 x 15 km cell grid that was considered the minimum requirement in terms of data distribution for HAP’s purposes (i.e. min. density of 1 record per 225 km², with 507 cells in Northern Ghana) and considered suitable for the study area given the resources available. Following the analysis of unique and reliable records, statistics were calculated for each database. Statistics showed that, for the initial assessment, the total number of unique records for the whole study area was 9 851 and that 7 594 of these records were considered reliable (as far as location data are concerned). Of the unique and reliable records, only 71 contained the minimum required data. These statistics also revealed that there were major gaps in the lithology and water quality data fields. Although further validation could have helped increase the number of reliable records, it was considered that the amount of work needed would be disproportionate in regards of the results expected. This was notably explained by the following problems:
syntax errors in community and district names absence of community names in some databases presence of new communities in some database coordinate discrepancies for the same community
The verification of the spatial distribution of the 71 records identified above revealed that only 26 cells contained one or more boreholes with most of them located in the Upper East Region. Considering that 507 cells were necessary to cover the entire study area, it was obvious that additional data were needed, both in terms of quantity and in terms of spatial distribution, to carry out any significant data analysis required to meet HAP’s objectives.
2.1.2 Collection and integration of additional groundwater data
Given the results of the initial assessment of the databases, additional data were thus collected manually from reports (soft and hard copies) identified earlier in the project. New data consisted mainly of reliable boreholes from water supply project reports that met at least one of the data requirements mentioned earlier. The selection was made mostly on the basis of the following: well data location (one well per 15 x 15 km cell)
3 Minimum data requirements only apply to hydrogeological data found in available databases; other required
well data representative of conditions encountered in the cell
This exercise, which was carried out by WRI staff yielded about 200 new reliable records, 65 of which met all the minimum data requirements.
2.1.3 Groundwater data collection summary
Following the additional data collection, the newly obtained reliable records were appended to the previously consolidated data. In addition to the new records obtained from the reports, new data generated by HAP targeted field work was also added to the consolidated data. This notably included 40 monitoring wells with their associated data (i.e. groundwater levels, groundwater sample analysis results, pumping test results …), geochemical data from three sampling campaigns targeting over a 100 boreholes, and analytical results from porewater and rainwater samples used for groundwater recharge estimation. Thus, the final number of records available at the time of writing was 10 139, of which 7 874 were considered unique and reliable records. Of these, 191 records had the minimum required data and those were spread out in 125 cells. While the validation process and the correction of errors described above were by no means an exhaustive exercise, the data collected and consolidated at that time of the project were deemed reliable enough to yield sound analysis results for HAP.
Throughout the consolidation process, data were temporarily kept in a flat file (i.e. a single database table termed HAP consolidated database) since potential software and models for this database were still being evaluated at the time. The database model evaluation and selection are discussed in section 3.
2.2 Surface water data
Surface water data were also collected during the HAP to support various analyses, validate results and prepare maps. Three types of data were mainly gathered: 1) hydrometric data (i.e. river flow measurements), 2) hydrographic data (i.e. watercourses and water bodies) and 3) rainfall data. The bulk of data were collected early in the project (2007-2008) but more recent data were also obtained towards the project end (2010).
Hydrometric datasets were provided by the Ghana Hydrological Services Department (HSD) in the form of MS Excel files for the following gauging stations in Northern Ghana:
Black Volta River basin: Bui and Bamboi
White Volta River basin: Daboya, Kpasenkpe, Nabogo, Nawuni, Paga, Pwalugu, Yarugu Kulpawn River sub-basin: Yagaba
Nasia River sub-basin: Nasia Red Volta River basin: Nangodi
Sisilli River sub-basin: Nakong and Wiase Oti River basin: Saboba
Datasets for these gauging stations include daily streamflow values (in cubic meters per second, m3/s) for the 1951-2004 period, although they contain multiple data gaps of variable
time length (from days to decades). For some gauging stations, it was possible to fill a number of data gaps with additional data obtained from Global Runoff Data Centre (www.grdc.bafg.de). However, considering the available streamflow data (in terms of temporal and spatial coverage) and project timeframe, it was not possible to generate representative streamflow estimates from existing data to fill all these gaps. Later in the project (2010), more recent daily hydrometric data (2004-2008 period) were also obtained for the following stations in Northern Ghana: White Volta River basin: Daboya, Kpasenkpe, Nabogo, Pwalugu, Yarugu
Kulpawn River sub-basin: Yagaba Nasia River sub-basin: Nasia
Red Volta River basin: Nangodi
Sisilli River sub-basin: Nakong and Wiase
In addition, datasets from the following gauging stations located outside the northern regions were also obtained:
Ankobra River basin: Beppoh, Bonsaso, Dwokwa, Prestea Dayi River basin: Gbefi, Hohoe
Densu River basin: Asuboi, Akwadum, Mangoase, Pakro Pra River basin: Brenasi, Mfensi, Twifu Praso
Tano River basin: Hwidiem, Sefwi Wiawso, Tanoso
While data obtained for most of these gauging stations consist of daily streamflow values, some also had monthly average streamflow values. The datasets cover variable time periods between 1962 and 2008. Table 2-1 summarizes all daily hydrometric data obtained.
Table 2-1 – Summary of available daily streamflow datasets
Available years
From To
Akwadum Eastern Densu 1977 2004 4307 (42 %)
Asuboi Eastern Densu 1964 2004 5297 (35 %)
Bamboi Northern Black Volta 1951 2004 7228 (37 %)
Beppoh Western Ankobra 2008 2008 273 (75 %)
Bonsaso Western Ankobra 2008 2008 273 (75 %)
Brenasi Eastern Pra 1991 2007 1168 (19 %)
Bui Northern Black Volta 1954 2004 3553 (19 %)
Daboya Northern White Volta 1962 2006 5152 (31 %)
Dwokwa Western Ankobra 2008 2008 278 (76 %)
Gbefi Volta Lower Volta (Dayi) 2002 2007 365 (16%)
Hohoe Volta Lower Volta (Dayi) 1962 2007 354 (21 %)
Hwidiem Brong Ahafo Tano 1991 2007 2355 (38 %)
Kpasenkpe Northern White Volta 2004 2006 124 (11 %)
Mangoase Eastern Densu 2002 2004 365 (33 %)
Mfensi Ashanti Pra 1991 2007 511 (8 %)
Nabogo Northern White Volta (Nabogo) 1962 2006 5590 (34 %) Nakong Upper East White Volta (Sisilli) 1965 2006 10558 (69 %)
Nangodi Upper East Red Volta 1957 2006 13701 (75 %)
Nasia Northern White Volta (Nasia) 1951 2006 7142 (35 %)
Nawuni Northern White Volta 1953 2005 1636 (8 %)
Paga Upper East White Volta 2004 2005 115 (16 %)
Pakro Eastern Densu 1965 2004 8416 (58 %)
Prestea Western Ankobra 2008 2008 273 (75 %)
Pwalugu Upper East White Volta 1951 2006 9823 (48 %)
Saboba Northern Oti 1953 2004 3718 (20 %)
Sefwi Wiaso Western Tano 1991 2007 2145 (35 %)
Tanoso Brong Ahafo Tano 1991 2007 511 (8 %)
Twifo Praso Central Pra 1991 2007 1149 (18 %)
Wiase Upper East White Volta (Sisilli) 1961 2006 9458 (56 %) Yagaba Northern White Volta (Kulpawn) 1957 2006 10636 (58 %)
Yarugu Upper East White Volta 1962 2006 9256 (56 %)
Station name Missing daily
values (%)
Region Basin
Hydrographic data were first obtained from the Solar and Wind Energy Resource Assessment Project in shapefile format (SWERA, 2005). The data, which covered the whole of the country, consisted of two files containing watercourse and water body features. However, close
examination of these data revealed an insufficient level of detail for HAP’s purposes. Additionally, data inaccuracies were noted in the northern regions, notably watershed limits were overlapping head streams in some areas. Therefore, larger scale hydrographic data were later obtained from the Ghana Survey Department along with other thematic data (i.e. cultural, forest, hypsographic, hydrographic, landform, transport and utility features). The data provided consisted of 43 files in ArcInfo interchange format (i.e. e00 files), each representing a 50k map sheet. As these files were not readily usable, data were re-organized by creating a mosaic out the 50k map sheets. This exercise however revealed several topological errors (e.g. overlapping polygons) that could not be corrected within project timeframe. The presence of these topological errors represents a limitation for spatial analysis and prevents the creation a flow network that could allow water flow modeling.
Rainfall data were obtained from the Ghana Meteorological Services Department (MSD). Daily, monthly and yearly datasets were obtained for different stations (all in millimeters, mm). Daily data covering the 2000-2010 period were first obtained for selected synoptic stations as part of meteorological datasets comprising the following data: precipitation, temperature, relative humidity, sun hours and wind speed. Because of project constraints, only rainfall data could however be included in the database (N.B.: other data can however be integrated into the database and linked to relevant stations in the future). These daily datasets were provided for the following 8 meteorological stations: Bole, Kete-Krachi, Navrongo, Sunyani, Tamale, Wa, Wenchi and Yendi. Concurrently, monthly meteorological datasets covering the 1961-2005 period were also obtained for the following stations: Ada, Bole, Kete-Krachi, Navrongo, Tamale, Wa and Yendi. Later in the project, additional daily and monthly datasets were obtained for other stations, some of them outside the northern regions. Daily rainfall datasets covered the 1950-2009 period although many of them contained multiple data gaps of variable time length (from days to decades). These datasets were provided for 34 non-synoptic stations, plus Akuse and Ho synoptic stations. As for the additional monthly rainfall datasets, they covered the 1934-2005 period (although with significant gaps also) for 10 non-synoptic stations, plus the Koforidua synoptic station. Finally, in order to improve the spatial distribution of rainfall data, yearly datasets comprising monthly average rainfall data were also obtained from 141 stations throughout Ghana for the 1971-2001 period. Information related to daily and monthly rainfall datasets acquired under HAP is summarized in tables 2-2 and 2-3.
Table 2-2 – Summary of available monthly rainfall datasets
Available years
From To
Ada Volta Synoptic station 1961 2005
-Adeiso Eastern Rainfall station 1939 1996 277 (40 %)
Apedua Eastern Rainfall station 1955 2002 184 (32 %)
Asafo Akim Eastern Rainfall station 1972 1995 50 (17 %)
Bole Northern Synoptic station 1961 2005
-Kete-Krachi Volta Synoptic station 1961 2005
-Koforidua Eastern Synoptic station 1965 2005 6 (1 %)
Kukurantumi Eastern Rainfall station 1960 2005 205 (37 %) Mangoase Eastern Rainfall station 1939 2002 310 (40 %)
Nankese Eastern Rainfall station 1960 2002 90 (17 %)
Navrongo Upper East Synoptic station 1961 2005
-Nsawam Eastern Climatological station 1934 2005 53 (6 %) Pokoase Greater Accra Climatological station 1953 2005 23 (4 %)
Suhum Eastern Rainfall station 1939 2005 207 (26 %)
Tafo (CRIG) Eastern Agrometric station 1950 2005 53 (8 %)
Tamale Northern Synoptic station 1961 2005
-Wa Upper West Synoptic station 1961 2005
-Yendi Northern Synoptic station 1961 2005
-Station name Station type Missing monthly
values (%) Region
Table 2-3 – Summary of available daily rainfall datasets
Available years
From To
Akaa Volta Climatological station 1956 2006 1223 (7 %)
Akuse Eastern Synoptic station 1950 2009 138 (1 %)
Amedzofe Volta Climatological station 1963 2009 1750 (10 %) Anfoega Akukome Volta Rainfall station 1955 2002 7741 (44 %)
Baglo Volta Rainfall station 1955 1980 786 (8 %)
Bawku Upper East Rainfall station 1950 2004 8902 (44 %)
Bole Northern Synoptic station 2000 2010 365 (9 %)
Bolgatanga Upper East Agrometric station 1954 2009 9266 (45 %) Busunu Northern Rainfall station 1953 1983 4282 (38 %) Gambaga Northern Rainfall station 1950 2006 8377 (40 %) Garu Upper East Agrometric station 1954 2009 11122 (54 %)
Helu Volta Rainfall station 1961 1983 3828 (46 %)
Ho Volta Synoptic station 1950 2009 75 (0.3 %)
Hohoe Volta Climatological station 1950 2009 2697 (12 %) Karaga Northern Rainfall station 1954 1978 5142 (56 %) Kayoro Upper East Rainfall station 1956 1983 5927 (58 %) Kete-Krachi Volta Synoptic station 2000 2010 365 (9 %)
Kpandu Volta Climatological station 1958 2009 378 (2 %)
Kpeve Volta Agrometric station 1950 2009 1323 (6 %)
Kunkungu Upper West Rainfall station 1954 1965 575 (13 %) Kusawgu Northern Rainfall station 1955 2008 7448 (38 %) Leklebi Dafo Volta Rainfall station 1950 1980 1943 (17 %) Likpe Mate Volta Rainfall station 1955 1985 2730 (24 %) Nakrong Upper East Rainfall station 1967 2008 6420 (42 %) Nalerigu Northern Rainfall station 1952 1981 4316 (39 %) Nankpanduri Northern Rainfall station 1954 1979 1702 (18 %) Nasia Northern Climatological station 1967 1983 881 (14 %) Navrongo Upper East Synoptic station 2000 2010 365 (9 %)
New Ayoma Volta Rainfall station 1955 1986 1968 (17 %)
Paga Upper East Rainfall station 1956 1997 6291 (41 %) Pong Tamale Northern Climatological station 1950 2009 1906 (9 %)
Pusiga Upper East Rainfall station 1955 1987 990 (8 %) Sunyani Brong Ahafo Synoptic station 2000 2010 365 (9 %)
Tamale Northern Synoptic station 1950 2010
-Teteman Volta Rainfall station 1976 1983 273 (9 %)
Tolon Northern Rainfall station 1961 1979 3740 (54 %)
Tsito Volta Rainfall station 1959 2009 6139 (33 %)
Tumu Upper West Rainfall station 1950 2004 8297 (41 %)
Wa Upper West Synoptic station 2000 2010 365 (9 %)
Walewale Northern Climatological station 1972 2009 2820 (20 %) Wenchi Brong Ahafo Synoptic station 2000 2010 365 (9 %)
Wiaga Upper East Rainfall station 1954 2002 5251 (29 %) Yapei Northern Rainfall station 1955 2004 11430 (63 %)
Yendi Northern Synoptic station 2000 2010 365 (9 %)
Station name Missing daily
values (%) Station type
3. D
ATABASE MODEL3.1 Evaluation and selection of database model
As data were collected and consolidated under HAP, discussions were initiated on the subject of the database model and software to be used. The selection of an adequate database model and software required investigations into database needs and capabilities at the WRC.
The first step in this process consisted in the evaluation of the database software used by the WRC at the beginning of the project. This software, named Ground Water for Windows (GWW), is a free hydrogeological database software developed in the early 1990’s through a United Nations (UN) program. While this software comprises several useful database features and analysis functions, its initial assessment revealed some concerns. First, there has not been any update of the software since its release in 1994, which makes the software interface outdated. Another point of concern is that the GWW database structure and format do not allow a straightforward connection and data export to other widely used database software. Thus, any data analysis or browsing to be done with other software would involve time-consuming transfer of required data through error prone procedures. Spatial analysis and mapping capabilities of GWW are also limited in comparison to up to date GIS software. In order to address these concerns, the GWW lead developer, Jasminko Karanjac, and the GWW UN contact, Claude Sauveplane, were contacted to enquire if changes could be made to the software. As this proved unfeasible within HAP’s timeframe and budget, other solutions were explored.
Therefore, the next step involved the investigation of other various database software, some specifically designed to host water-related data. These included the following: MS Access, ArcGIS, Rockworks, HydroGeo Analyst and Equis. Specifications and capabilities of these software packages were compared with those of GWW and with each other. This initiated further discussions with the WRC in relation with long-term database needs. Among the factors discussed were database analysis and management capabilities, software purchase and upgrade costs, software training and software compatibility. As it was collectively agreed that the WRC required an ArcGIS license to meet their mapping needs (whatever the database software selected), it was decided to use a database model that could be implemented within ArcGIS and its database platform, SQL Server Express. Investigations identified the Arc Hydro database model as the most relevant.
3.2 Description of Arc Hydro database model
The Arc Hydro database model started as a model for representing surface water systems within an ArcGIS geodatabase. In 2002, the Arc Hydro database model was published as an ESRI book entitled: Arc Hydro GIS for Water Resources (Maidment, 2002). Arc Hydro has been highly successful and has been widely adopted in industry. The groundwater database model has since been developed as a companion to the surface water database model.
The Arc Hydro groundwater database model is a geodatabase design used for representing multidimensional groundwater data (Strassberg et al., 2007). The database model supports representations of different types of groundwater data including representation of data from aquifer maps and well databases, data from geologic maps, 3-D representations of borehole and hydrostratigraphy, temporal information, and data from simulation models. The model is based on the newly designed Arc Hydro framework, which is shared by the surface water and groundwater database models. Users can add groundwater and surface water components (GIS layers, data files…) to the framework as necessary, or develop their own components. This new componentized approach enables the tailoring of the geodatabase design to meet specific needs. More detailed information on the Arc Hydro database model can be found at: www.archydrogw.com www.aquaveo.com
3.2.1 Database file format
Arc Hydro is a conceptual and technical design implemented within a geodatabase (Strassberg et al., 2007). Although the logic of the database model can be implemented in different GIS software packages, the proposed Arc Hydro design implements object classes from the ArcGIS geodatabase model. In order to query, visualize and use the content of such a geodatabase, an ArcView license level is required. To create, modify and properly manage geodatabase elements, an ArcEditor level license is required.
The geodatabase is a repository of geographic information organized into geographic data sets built on top of relational database management systems (RDBMS) such as Microsoft Access, Oracle, or Microsoft SQL Server that are customized for storing spatial data structures. Thus, the geodatabase performs as any standard RDBMS with additional capabilities related to the storage of geospatial features. Geodatabase objects used in the Arc Hydro database model include features, feature classes, relationships, rasters, and raster catalogs. Features, which are spatial vector objects (e.g., points, lines, polygons) with attributes (or data fields) to describe their properties, are stored within a feature class which represents a collection of features with the same geometry type, attributes, and relationships (N.B.: in a feature class, a feature is equivalent to a row in a table). Relationships are objects that define associations between feature classes based on key fields (e.g. a relationship can associate an aquifer and a well). Finallly, raster data sets represent imaged, sampled, or interpolated data on a uniform rectangular grid, and raster catalogs are used for storing, indexing, and attributing raster data sets. A detailed description of the geodatabase model and feature classes is provided by Zeiler (1999) and can also be found on the ESRI support website (http://support.esri.com).
3.2.2 Overview of architecture
The Arc Hydro groundwater database model provides data structures for representing two-dimensional (2-D) and three two-dimensional (3-D) hydrogeologic features (e.g., aquifers, wells, faults, cross sections, and volumes), objects for describing computational grids (cells and nodes) to represent inputs and outputs from simulation models, and objects for storing tabular or gridded temporal information such as water levels and water quality measurements. The main components of the model are illustrated in Figure 3-1 and summarized below based on information given at: www.archydrogw.com/ahgw/Arc_Hydro_Groundwater_Data_Model. A complete description of the database model can be found in Strassberg, 2005.
The Arc Hydro framework provides a simple data structure for storing basic spatial datasets describing hydrologic systems. The framework supports basic water resources analyses such as tracing water as it flows over the terrain in watersheds, streams, and water bodies, creating groundwater levels and groundwater quality maps, and viewing time series data related to monitoring stations and wells. The Arc Hydro framework includes the following features:
Aquifer- Polygon features representing aquifer boundaries. The features can be classified to represent different zones such as outcrop and confined sections of the aquifer.
Well – Point features representing well locations and their attributes.
WaterLine - Line features representing hydrographic “blue lines”, which represent mapped streams and water body center lines.
Waterbody – Polygon features representing areas such as ponds, lakes, swamps, and estuaries.
Watershed – Polygon features representing drainage areas contributing water flow from the land surface to the water system.
HydroPoint – Point features representing hydrographic features such as springs, water withdrawal/discharge locations, and structures.
MonitoringPoint – Point features representing locations where hydrologic variables are measured, such as stream-gage stations and precipitation gages.
Figure 3-1 – Main components of the Arc Hydro groundwater database model Watershed Aquifer Wells Waterbody HydroPoints WaterLines MonitoringPoint GeoArea GeoLine GeoPoint Boundary 1 1..* VerticalMeasurement 1..* 1..* 1..* WaterLine Waterbody HydroPoint Watershed 1 1..* 1 1..* 1 1 1..* 1..* 1
Framework data model
Wells and boreholes
Time Series
Simulation
Hydrostratigraphy
SectionLine 1 1..* 1..* 1..* 1..*Geology
1..* 1..* BoreLine BorePoint 1 HydroGeologicUnit HGUArea GeoSection GeoVolume GeoRasters TimeSeriesType 1..*Time Series Datasets TimeSeries MonitoringPoint Cell2D Cell3D Node Well Aquifer 1 1..* January 1991 January 1992 January 1993 Feet above mean sea level
UniqueIDTable
The Borehole component contains classes for representing 3-D information recorded along boreholes. The data can be stored as tabular information related to well features or as 3-D point and line features that can be visualized in ArcScene.
BoreholeLog - Table for representing vertical data along boreholes. Each row in the BoreholeLog table represents a point or interval along the borehole.
BorePoint - 3-D point feature class for representing point data along boreholes. BoreLine - 3-D line feature class for representing interval data along boreholes.
The Hydrostratigraphy component represents hydrogeologic units (HGU) using 2-D and 3-D features. Classes in the component enable the representation of hydrogeologic models including 2-D polygons representing the extent of hydrogeologic units, cross sections, surfaces representing the top and bottom of hydrogeologic units, volume elements.
HydrogeologicUnit – Table for defining conceptual hydrogeologic units.
GeoArea - Polygon feature class for representing the 2-D extent of hydrogeologic units or parts of them.
GeoSection – 3-D multipatch feature class representing vertical cross sections. SectionLine – Line feature class for representing 2-D section lines.
GeoRasters - Raster catalog for storing raster surfaces. The catalog enables storing rasters within the geodatabase and adding attributes describing raster datasets.
GeoVolume – multipatch feature class for representing 3-D volumes.
The Geology component consists of a set of objects for representing data from geologic maps and to integrate geologic data with other groundwater-related datasets.
GeologyPoint – Points that represent locations such as springs, caves, sinks, and observation points.
GeologyLine – Line features that describe objects such as faults, contacts, and dikes. GeologyArea – Polygon features describing areal features such as rock units.
The Time Series component provides a design for dealing with temporal data series within Arc Hydro. This design provides better support for utilizing multiple representations of time series data and a table structure to describe time series variables.
The AHGW Simulation feature dataset is a set of vector feature classes that can represent common modeling objects. It is designed to allow for representation of finite element and finite difference systems in a GIS. The simulation feature dataset includes five feature classes: Boundary, Cell2D, Cell3D, Node2D, and Node3D. These feature classes enable storage and representation of model inputs and outputs related to the simulation objects.
Boundary - Polygon feature class that represents the two dimensional extent of a model. It is not an essential part of the model representation but it can be useful to illustrate the location of the simulation model to support a simple spatial reference or database query. Cell2D – Polygon feature class used to represent cells or elements associated with
two-dimensional simulation models or a single layer of a three-two-dimensional model.
Cell3D – Multipatch feature class for representing three-dimensional cells and elements of simulation models.
Node2D – 2-D Point feature class that represents nodes in a 2-D model grid/mesh or the nodes in a single layer of a 3-D model grid/mesh.
Node3D – 3-D Point feature class that represents nodes in a model grid/mesh.
Internal relationships between the components of the AHGW database model are managed through the use of a unique identifier termed HydroID (usually an integer number). Every feature in the AHGW database model is assigned a unique HydroID that is used to manage
relationships between features and relate features with tabular data. Figure 3-2 illustrates the relationship between features of the Well feature class and features of the Aquifer feature class. In this example, the relationship has a one-to-many cardinality4 since an aquifer feature can be associated with one or more wells. The latter are related to aquifer features through the AquiferID data field, which is equal to the HydroID of an aquifer feature. Other database features and tabular data are related in a similar way although different types of relationships can be used (e.g. one-to-one or many-to-many).
Figure 3-2 – Example of database feature relationship using HydroID (Strassberg, 2008)
3.2.3 Arc Hydro Groundwater tools
Arc Hydro Groundwater Tools were developed by ESRI (www.esri.com) and Aquaveo (www.aquaveo.com) to improve groundwater data management capacities within ArcGIS. Based on the Arc Hydro groundwater database model, the tools enable the user to take advantage of the ArcGIS platform to archive, manage, and visualize groundwater information as well as time series and geological data. The toolkit includes Groundwater Analyst, MODFLOW Analyst and Subsurface Analyst which are described below.
Tools in the Groundwater Analyst allow the user to import data into the AHGW database model, manage key attributes and visualize data. With Groundwater Analyst, the user is able to import a variety of datasets (wells, time series, cross sections, volumes) into a geodatabase, manage symbology of layers in ArcMap and ArcScene, map and plot time series, and create common products such as water level, water quality, and flow direction maps. These tools are free to all licensed ArcGIS users with an ArcMap level license.
The Subsurface Analyst allows the user to create and visualize both 2-D & 3-D geologic models, starting with classification and visualization of borehole logs, creation and editing of cross sections, and generation of 3-D geosections and geovolumes. The complete set of tools included in the Subsurface Analyst are available for about 2000 $ CAD.
The MODFLOW Analyst enables the user to create, archive, and visualize modflow models within ArcGIS. The geoprocessing tools are based on the MODFLOW Database model, which supports the storage of a complete MODFLOW model (including grid structure, inputs, results) within an ArcGIS geodatabase. Tools in the toolkit enable the user to import an existing model into the geodatabase and geo-reference the model so that results can be visualized and analyzed in the context of other GIS data and that new models can be created from GIS features. The complete set of tools included in this toolkit are available for about 1500 $ CAD. Information on software requirements and installation procedure for the Arc Hydro groundwater tools can be found on the Aquaveo website (www.aquaveo.com/ahgwinstallation).
4 The cardinality of a relationship specifies the number of objects in the origin class that can relate to a number
of objects in the destination class; a relationship can have one of three cardinalities: one-to-one, one-to-many and many-to-many.
4. D
ATABASE MODEL CUSTOMIZATIONTo create the WRC Water Resources Database, the Arc Hydro groundwater database model described in the previous section was customized in order to adequately store all available data and to suit database needs at the WRC. Some of the feature classes and tables proposed in the original model were thus left out of the customized database model and a few new ones were created to complement the existing ones. Furthermore, additional attributes (or data fields) were created in some of the original feature classes and tables as only basic attributes are predefined in the model. To provide means of ensuring data integrity, new domains5 and
relationship classes6 were added to those proposed in the database model. All these
modifications are summarized in the following sections (N.B.: feature classes and tables are underlined and data fields are in italic font to clarify descriptions) and a simplified database diagram is provided in Figure 4-1.
4.1 Database structure
4.1.1 Framework component
The Arc Hydro template for the Aquifer feature class was used as is, except for the addition of one data field, GeoUnit. In the WRC Water Resources Database, this feature class was used to store hydrogeological contexts rather than aquifers since available hydrogeological information did not allow adequate definition of aquifers. These hydrogeological contexts were primarily delineated on the basis of geology7 and the GeoUnit data field thus identifies the name of the geological unit(s) comprised within each hydrogeological context. Also, the data field HGUID was left empty since the HGU (i.e. hydrogeologic units) defined for this project cannot be generalized laterally at regional scale with the available information.
For the Well feature class, several new data fields were added to complement the predefined data fields in the Arc Hydro template. The main data fields or groups of data fields added comprise: geographic coordinates (Longitude, Latitude), condition or state of well (WellState), type of well (WellType), use of well (WellUse), administrative areas (Region, District, Community), hydrological basin (Basin), companies involved in siting and drilling activities (BhComp, SitingComp), dates of siting and drilling activities (WellDate, SitingDate), drilling method (BhMethod), airlift yield (AirliftYld), pump information (PumpType, PumpDepth, PumpDate), comments (CommentsGeneral, CommentsLocation), record entry date (EntryDate), data availability or reliability identifiers (e.g. records with reliable coordinates) (HasXY, HasDpt, HasLth, HasSwl, HasYld, HasGwq) and duplicate record identifier (HasDupl). The content of the latter data field was generated from a non-exhaustive duplicate identification process that was carried out on data consolidated under the HAP. This process was aimed at identifying duplicates to be left out of the HAP analyses and possible duplicates that would require a more detailed verification. Aside from the creation of the above mentioned data fields, the HGUID field was replaced by the HGUGeneral field (c.f. section 4.1.3) since, for most records, more than one HGU was intercepted. The purpose of these generalized HGUs is to provide a rough indication of the productive zone intercepted by the well. It is also important to mention that space-dependent information (e.g. LandElev, AquiferID, Basin and GeoUnit) were not assigned to records for which coordinates were considered unreliable (i.e. HasXY = 0). To complement the Well feature class, a BoreholeIndex table was created to store additional information that allows the identification of well in relation with other databases obtained during the HAP. Data fields in this table include well identifiers from other databases (WellID_1, WellID_2, WellID_3, WellRefNo), name and funding of the project under which the well was
5 Domain : Defines a set of legal attribute values for a data field; it limits the possibility of data entry error
because the choices for each value are limited within defined parameters.
6 Relationship class : Defines the properties of a relationship or of an association between two objects.
7 The geological map used for the definition of main hydrogeological contexts is the 2009 version published by
the Ghana Geological Survey Department (GSD, 2009); the GeoUnit data field of the Aquifer feature class corresponds to a combination of the Stratigraphy and TectonicDomain data fields of the soft copy of the map.
constructed (PrjctName, PrjctFund), the licence number of the drilling contractor (LicenceNo) and data sources for the available information (DSource1, DSource2, DSource3).
The MonitoringPoint feature class was used to store and represent point locations where groundwater and surface water monitoring data were collected. For groundwater data, this consisted in a subset of the Well feature class comprising active monitoring wells. All complementary information such as lithology, construction details, groundwater levels are however linked to the features in the Well feature class. Consequently, an additional data field, WellID, was created in the MonitoringPoint feature class to link back to these features in the Well feature class. For surface water data, the monitoring points comprised meteorological stations (i.e. agro-metric station, climatological station, rainfall station and synoptic station) and river flow gauging stations. Data obtained from these monitoring points were respectively stored in the SeriesRainfall table and the SeriesRiverflow table (see section 4.1.4).
4.1.2 Borehole component
In the Arc Hydro database model, the BoreholeLog table of this component was designed to store and manage all vertical measurements related to features in the Well feature class. This table was however replaced by three similar tables, BoreholeLithology table, BoreholeConstruction table, BoreholeSample table, in order to organize, manage and visualize datasets of different nature in a more efficient way. The structure of these tables was based on the BoreholeLog table template to which four data fields were added: 1) a LogID field to provide a unique vertical measurement (or log) identifier, 2) an FGeometry field to specify the geometry of the feature considered (e.g. point or interval), 3) a LogCode field to indicate the possible values associated to the type of vertical measurement (e.g. type of screen for construction details) and 4) a LogDescr field to provide a free text description of the vertical measurement. In the BoreholeConstruction table, the HGUID and HGUCode fields were replaced by the HGUGeneral and HGUCodes fields since, for most vertical measurements, more than one HGU was intercepted. As stated in section 4.1.3, the information in these fields was only extracted for records with lithology data and known screened or open-hole intervals.
Three 3-D feature classes, BoreLineLithology, BoreLineConstruction and BoreLineSample, were created accordingly to represent, when possible, vertical measurements listed in the tables mentioned above. These feature classes were based on the BoreLine feature class of the Arc Hydro database model. Except fo the FGeometry field which would be redundant with the SHAPE field of the feature class, the same data fields added to the tables above were added to these feature classes.
4.1.3 Hydrostratigraphy component
Considering the extent of the project area and the available lithological data, the definition of hydrostratigraphic units (or hydrogeologic units, i.e. HGU) was largely based on levels of bedrock weathering and fracturing, which generally have a significant influence on the occurrence of groundwater in Northern Ghana. These HGU are therefore not built from sets or groups of lithological units but rather from qualitative indications given in borehole logs that are related to weathering and fracturing. These units are listed in the HydroGeologicUnit table, which is used without modification.
For some of the feature classes in the other Arc Hydro database model components, HGUGeneral replaced the HGUID data field since more than one HGU was associated with the record considered. HGUGeneral thus represents a generalized HGU based on all HGU intercepted (e.g. if highly and moderately weathered rock units are intercepted by the screen interval, the generalized HGU would be 'Regolith'). In some feature classes, all HGU intercepted by a well are also stored in the HGUCodes data field for future reference. The information in both these data fields, HGUGeneral and HGUCodes, is only available for records that have both lithology data and construction details (i.e. screen or open hole intervals).
Finally, given data availability and project constraints, the proposed spatial representation of the hydrostratigraphy within the Arc Hydro database model (Section 3.2.2) was not implemented. 4.1.4 Time series component
The storage of temporal data collected under HAP required the creation of eight additional tables:
Groundwater data: SeriesGroundwaterLevel table, SeriesPumpingTest table, SeriesStepDrawdownPumpingTest table, SeriesGroundwaterQuality table and SeriesGroundwaterIsotope table,
Surface water data: SeriesRainfall table, SeriesRainwaterQuality table and SeriesRiverflow table
The groundwater data-related tables were respectively created to store groundwater level data, pumping test data, step-drawdown pumping test data, geochemical data and isotopic data. The structure of these tables was based on the AttributeSeries table template. The latter template was preferred over the TimeSeries template as it allows the storage of multiple time-dependent variables in the same table (e.g. multiple physico-chemical parameters analysed at a given well on a given date). The variables included in each of these tables correspond to the most commonly measured variables in databases and in hydrogeological studies collected under the HAP. If necessary, additional variables can be appended to these tables in the future.
The surface water data-related tables were respectively created to store rainfall data8, geochemical data on rainwater and river flow measurements. The structure of the table storing rainwater geochemical data was based on the AttributeSeries table template as it contains many time-dependent variables like the groundwater-related tables. The other two tables, storing rainfall and river flow data, were however based on the TimeSeries template as both datasets contain only a single dependent variable (i.e. rainfall and river flow). The time-scale of measurements for these single variables can be indicated in the VarID data field which links to the VariableDefinition table (see below).
In order to document variables of all time series tables in the database, the VariableDefinition table was also used. Two data fields, Standard and Note, were added to this table to respectively provide a quality standard for the variable (e.g. WHO drinking water guideline values for geochemical parameters (WHO, 2008) and a free text description or general comment related to the variable or the values entered for this variable.
Finally, the SeriesCatalog table was also incorporated into the WRC Water Resources Database in order to provide a quick overview of the times series avaiable in the database. 4.1.5 Other database components
4.1.5.1 Geology component
All feature classes of the geology component were left out of the WRC Water Resources Database. Many geological features such as caves, sinks, fault, dikes and regional alteration zones were unavailable at the time of writing and, considering that the available information (i.e. polygons features representing geological units) was used to define hydrogeological contexts, it was decided not to include this component in the database.
4.1.5.2 Simulation feature dataset
At the time of writing, all feature classes of this component were left out of the WRC Water Resources Database as there were no needs for them in the foreseeable future.
8 Only rainfall data could be included in the database within the project timeframe; however, other
meteorological data such as temperature (avg., min., max.), relative humidity (min., max.), sun hours and wind speed could also be included and linked to existing monitoring points in the future.
4.2 Database validation features
4.2.1 Attribute validation rules
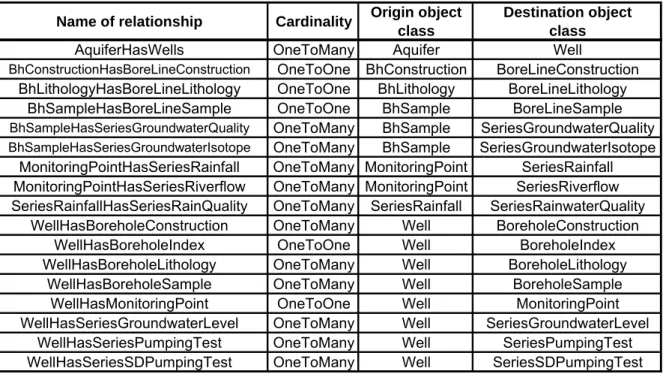
The Arc Hydro groundwater database model is designed to allow the definition of relationships between database objects. This is done through the creation of relationship classes linking feature classes and tables within the geodatabase. The implementation of the modifications presented in the previous sections required the creation of additional relationship classes besides already existing ones. The final list of relationships added is presented in Table 4-1. Table 4-1 – List of WRC Water Resources Database relationships
Name of relationship Cardinality Origin object class
Destination object class
AquiferHasWells OneToMany Aquifer Well
BhConstructionHasBoreLineConstruction OneToOne BhConstruction BoreLineConstruction
BhLithologyHasBoreLineLithology OneToOne BhLithology BoreLineLithology
BhSampleHasBoreLineSample OneToOne BhSample BoreLineSample
BhSampleHasSeriesGroundwaterQuality OneToMany BhSample SeriesGroundwaterQuality BhSampleHasSeriesGroundwaterIsotope OneToMany BhSample SeriesGroundwaterIsotope
MonitoringPointHasSeriesRainfall OneToMany MonitoringPoint SeriesRainfall
MonitoringPointHasSeriesRiverflow OneToMany MonitoringPoint SeriesRiverflow
SeriesRainfallHasSeriesRainQuality OneToMany SeriesRainfall SeriesRainwaterQuality
WellHasBoreholeConstruction OneToMany Well BoreholeConstruction
WellHasBoreholeIndex OneToOne Well BoreholeIndex
WellHasBoreholeLithology OneToMany Well BoreholeLithology
WellHasBoreholeSample OneToMany Well BoreholeSample
WellHasMonitoringPoint OneToOne Well MonitoringPoint
WellHasSeriesGroundwaterLevel OneToMany Well SeriesGroundwaterLevel
WellHasSeriesPumpingTest OneToMany Well SeriesPumpingTest
WellHasSeriesSDPumpingTest OneToMany Well SeriesSDPumpingTest
To improve data integrity within the WRC Water Resources Database, additional domains were also created and assigned to appropriate data fields. All domains defining the values permitted for the specified data fields are listed inTable 4-2.
4.2.2 Spatial validation rules
While there are no topology rules defined in the AHGW database model, it was decided to include at least one topology in the WRC Water Resources Database in order to facilitate spatial analysis and ensure consistent results when using the Aquifer feature class. This topology, named AquiferTopology, was defined and validated for the Aquifer feature class with two basic rules: 1) polygons must not have gaps and 2) polygons must not overlap. No topology was created for the Well feature class as too many wells were without reliable coordinates.
4.3 Database coordinate system
The coordinate system used for all database spatial features is the Ghana Meter Grid. The details of this projected coordinate system are stated below:
Projection: Transverse_Mercator False Easting: 274319.510000 False Northing: 0.000000 Central Meridian: -1.000000 Scale Factor: 0.999750 Latitude of Origin: 4.666667 Linear Unit: Meter (1.000000)
Geographic Coordinate System: GCS_Leigon Angular Unit: Degree (0.017453292519943299) Prime Meridian: Greenwich (0.000000000000000000) Datum: D_Leigon
Spheroid: Clarke_1880_RGS
Semimajor Axis: 6378249.144999999600000000 Semiminor Axis: 6356514.869549775500000000 Inverse Flattening: 293.464999999999970000
As a complement, the Well feature class also has longitude and latitude data fields to store original geographic coordinates.
Table 4-2 – List of WRC Water Resources Database domains
Name Description
AHBoolean Pseudo-boolean field
AquiferFType Feature classification for aquifer contexts AquiferName Name of aquifer contexts
BasinName Name of standard drainage areas named after main rivers BhMethod Borehole drilling method
BoreholeLogType Classification of borehole logs DsType Type of time-enabled dataset ElevationRange Domain Range for elevation values
ElevUnits Units for elevation values FGeometry Feature geometry
GPSReading Type of locations for GPS readings
HasDpt Classification of records based on availability of well depth values HasDupl Classification of records based on the existence of duplicate records HasGwq Classification of records based on availability of gw quality info
HasLth Classification of records based on availability of lithology information HasSwl Classification of records based on availability of gw level values
HasXY Classification of records based on coordinates availability/reliability HasYld Classification of records based on availability of yield values HGUCode Hydrogeologic unit code
HGUGeneral Generalized hydrogeologic unit intercepted by well Lithostratigraphy Lithostratigraphic/lithodemic units
LogCodeBA Borehole annulus classification LogCodeBC Borehole completion classification LogCodeBD Borehole diameter classification
LogCodeBL Names of common lithologic units LogCodeSM Log sample medium
MonitoringPointFType Feature classification for MonitoringPoint MType Type of groundwater level measurement
PtLoc Location of gw level measurements associated to pumping test PumpType Type of pump installed
RefPt Reference point for groundwater level measurement RegionName Name of administrative region
SmplMedium Sample medium for time series TimeUnits Time units
TSDataType Data type for TimeSeries VarUnits Units for time series variables
WellState Classification of well state or well condition WellType Classification for well type
5. D
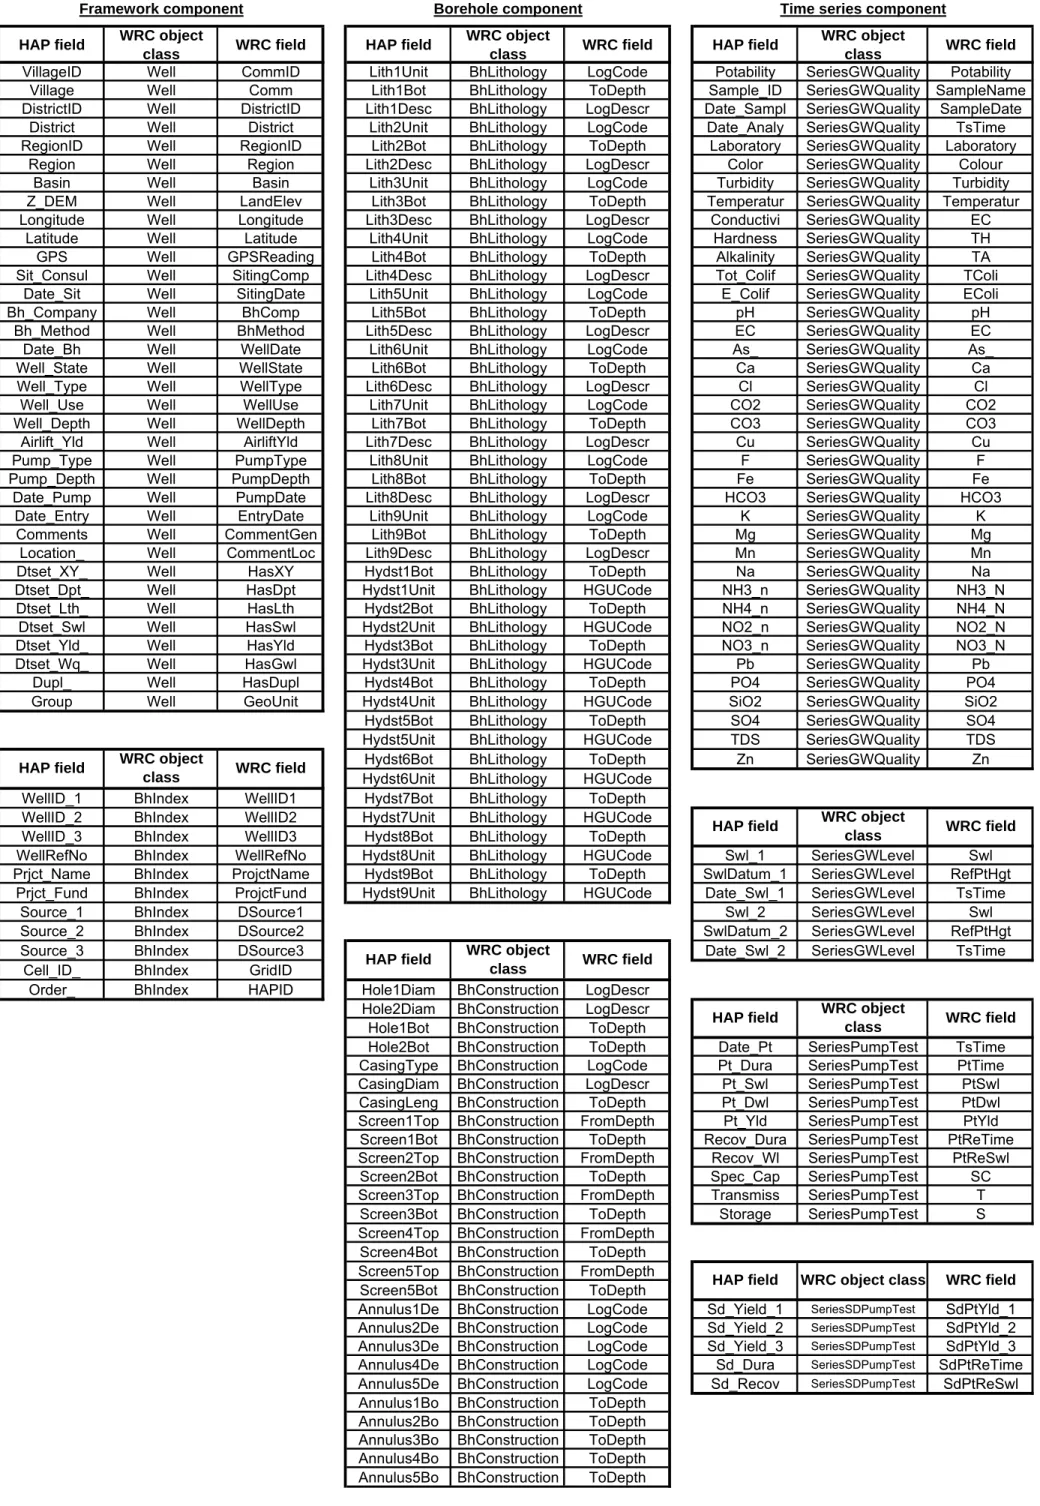
ATA INTEGRATIONThis section summarizes the operations involved in the integration of relevant water-related data collected under the HAP into the WRC Water Resources Database. For future data integration, a complementary document entitled 'Water Resources Database Operation Manual' (SLI-INRS, 2011) was prepared. In addition to detailing data integration operations related to the database, this document provides guidelines for data analysis, extraction and representation.
5.1 Groundwater data
5.1.1 Preparation of data to be integrated
Prior to data integration, different operations were required to ensure collected groundwater data complied with the WRC Water Resources Database structure and validation features. The main operations included 1) assigning a temporary identifier to each feature to be integrated, 2) restructuring and standardizing information according to database destination tables and domains and 3) adding complementary information from external data sources.
5.1.1.1 Temporary feature identification
An arbitrary but unique numeric identifier was temporarily assigned to each feature of the consolidated data (e.g. point features such as wells or meteorological stations) in order to relate them to their associated tabular data, which will be stored in different database tables (e.g. pumping test data for wells). Once the features were integrated in the database, this temporary identifier was replaced with the HydroID identifier generated by the Arc Hydro tools (see section 5.1.2 for HydroID assignation). This approach prevented the manual assignation of the HydroID prior to data integration, which can lead to database integrity errors and gaps in the identifier sequence of the HydroID. It however required the substitution of the temporary identifier in every feature class and table of the database after data integration.
5.1.1.2 Data restructuring and standardization
Subsequently, consolidated data were reorganized in order to be integrated into the database with the 'Text Import' tool in the AHGW Tools. This step notably involved restructuring sequential data such as lithology units, hydrostratigraphy units, screen intervals and temporal data to match the structure of the WRC Water Resources Database. To facilitate this step, MS Excel templates based on the database structure were developed as data entry forms. These templates include data validation features such as drop-down lists and error messages based on database domains to ensure consistency and facilitate the standardization of values. During this operation, it was necessary to generate additional data to complement the part of the existing information. In the case of groundwater quality data, this meant that vertical intervals from which groundwater samples originated (i.e. screen or open hole sections) had to be approximated, when possible, on the basis of the construction details of the well. And, in the case of borehole construction details, it meant that all HGU intercepted by wells (i.e. at screen or open hole sections) had to extracted.
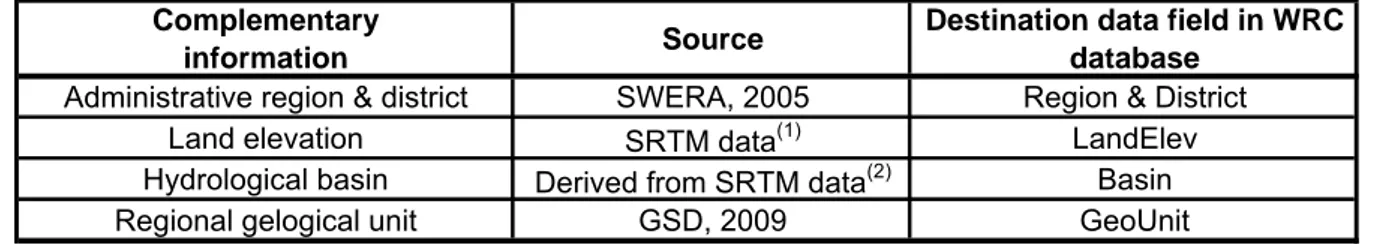
5.1.1.3 Addition of complementary information
Finally, as the data collected under the HAP lacked various complementary information (e.g. land elevation at well location), additional data had to be extracted from different external data sources. This complementary information is summarized in Table 5-1. In the eventuality that new and/or more accurate data sources are obtained, this complimentary information should be updated. This notably concerns the information related to administrative districts that was known to be outdated at the time of writing. This information could however not be updated since electronic data related to new districts were not available yet. All complimentary information was appended to the consolidated data using spatial analysis functions in ArcGIS (i.e. spatial join for vector data and extract tool for raster data).
Table 5-1 – Complementary information appended to data before integration Complementary
information Source
Destination data field in WRC database
Administrative region & district SWERA, 2005 Region & District
Land elevation SRTM data(1) LandElev
Hydrological basin Derived from SRTM data(2) Basin
Regional gelogical unit GSD, 2009 GeoUnit
Note:
(1) : Shuttle Radar Topographic Mission data obtained from International Centre for Tropical Agriculture through the Consortium for Spatial Information of the Consultative Group for International Agriculture Research (CGIAR-CSI) (CIAT, 2008).
(2) : Hydrological basins were delineated from SRTM elevation data in ArcGIS software with hydrology functions of the Spatial Analyst tools.
5.1.2 Data import into the database
Following data preparation, relations between data fields of the consolidated data and the WRC Water Resources Database were identified. This exercise allowed the consolidated data to be imported to the WRC Water Resources Database using the 'Text Import' tool in the AHGW Tools. The identification of these relations is documented in detail in Appendix B and is summarized in Table 5-2 for each groundwater-related feature class and table with the exception of the Aquifer feature class. As mentioned in section 4.1.1, the latter was used to store hydrogeological contexts delineated on the basis of the geology. Features corresponding to these hydrogeological contexts were created from the most recent geological map (GSD, 2009) obtained in shapefile format. Following the creation of polygons features and of the relevant attributes, topological errors were corrected according to rules defined in section 4.2.2. Following data import to the WRC Water Resources Database, additional operations were required to complete the data fields used to link or describe data. First and foremost, a unique database identifier was assigned to each database feature using the HydroID data field. As mentioned in section 3.2.2, this data field is used to manage relationships between database features and tabular data. The complete procedure used to assign the HydroID is detailed in Appendix C. Subsequently, unique external identifiers were assigned to each well with reliable coordinates. This new ID, to be integrated in the HydroCode data field of the WRC Water Resources Database, was assigned using a vector grid based on the national borehole numbering scheme (see Appendix D for complete procedure to assign HydroCode). This step was necessary to provide a standardized external identifier as data collected under HAP came from various databases using different identification schemes for their records (N.B.: the original database identifier was however kept and stored in the BoreholeIndex table). Finally, variables used in the time series were also defined and described in the VariableDefinition table in order to provide basic information on the content and format of the data they contain. In a similar way, HGU were also defined in the HydroGeologicUnit table based on existing HGU transferred with lithology data. Relevant time series were also described in the SeriesCatalog table.