Publisher’s version / Version de l'éditeur:
Vous avez des questions? Nous pouvons vous aider. Pour communiquer directement avec un auteur, consultez la première page de la revue dans laquelle son article a été publié afin de trouver ses coordonnées. Si vous n’arrivez pas à les repérer, communiquez avec nous à [email protected].
Questions? Contact the NRC Publications Archive team at
[email protected]. If you wish to email the authors directly, please see the first page of the publication for their contact information.
https://publications-cnrc.canada.ca/fra/droits
L’accès à ce site Web et l’utilisation de son contenu sont assujettis aux conditions présentées dans le site LISEZ CES CONDITIONS ATTENTIVEMENT AVANT D’UTILISER CE SITE WEB.
2010 IEEE International Conference on Systems, Man and Cybernetics, pp.
1584-1590, 2010-10
READ THESE TERMS AND CONDITIONS CAREFULLY BEFORE USING THIS WEBSITE. https://nrc-publications.canada.ca/eng/copyright
NRC Publications Archive Record / Notice des Archives des publications du CNRC : https://nrc-publications.canada.ca/eng/view/object/?id=55f2cc2f-d7d7-4c58-8160-66bbab16a98f https://publications-cnrc.canada.ca/fra/voir/objet/?id=55f2cc2f-d7d7-4c58-8160-66bbab16a98f
NRC Publications Archive
Archives des publications du CNRC
This publication could be one of several versions: author’s original, accepted manuscript or the publisher’s version. / La version de cette publication peut être l’une des suivantes : la version prépublication de l’auteur, la version acceptée du manuscrit ou la version de l’éditeur.
For the publisher’s version, please access the DOI link below./ Pour consulter la version de l’éditeur, utilisez le lien DOI ci-dessous.
https://doi.org/10.1109/ICSMC.2010.5642358
Access and use of this website and the material on it are subject to the Terms and Conditions set forth at
A 3-D indoor location tracking and visualization system based on
wireless sensor networks
http://www.nrc-cnrc.gc.ca/irc
A 3 -D indoor loc a t ion t ra c k ing a nd visua liza t ion syst e m ba se d on
w ire le ss se nsor ne t w ork s
N R C C - 5 3 2 9 0
B a l , M . ; X u e , H . ; S h e n , W . ; G h e n n i w a , H .
O c t o b e r 2 0 1 0
A version of this document is published in / Une version de ce document se trouve dans:
2010 IEEE International Conference on Systems, Man, and Cybernetics (IEEE
SMC 2010), Istanbul, Turkey, October 10-13, 2010, pp. 1-7
The material in this document is covered by the provisions of the Copyright Act, by Canadian laws, policies, regulations and international agreements. Such provisions serve to identify the information source and, in specific instances, to prohibit reproduction of materials without written permission. For more information visit http://laws.justice.gc.ca/en/showtdm/cs/C-42
Les renseignements dans ce document sont protégés par la Loi sur le droit d'auteur, par les lois, les politiques et les règlements du Canada et des accords internationaux. Ces dispositions permettent d'identifier la source de l'information et, dans certains cas, d'interdire la copie de documents sans permission écrite. Pour obtenir de plus amples renseignements : http://lois.justice.gc.ca/fr/showtdm/cs/C-42
A 3-D Indoor Location Tracking and Visualization
System Based on Wireless Sensor Networks
Mert Bal1,2, Henry Xue1, Weiming Shen1,2, Hamada Ghenniwa2
1 Centre for Computer-assisted Construction Technologies, National Research Council, London, Ontario, Canada 2
Dept. of Electrical and Computer Engineering, University of Western Ontario, London, Ontario, Canada [email protected]; [email protected]; [email protected]; [email protected]
Abstract— This paper describes a 3-D location tracking and visualization system using wireless sensor nodes in indoor environments. The system is based on a modified radio-location fingerprinting algorithm and it uses inexpensive, programmable wireless embedded platforms operating in a ZigBee wireless network protocol. The main emphasis of this study is on the ability to estimate the location of mobile wireless nodes in 3-D indoor spaces, without any costly infrastructure. The wireless nodes have been deployed in an experimental test bed, for location tracking and motion estimation. A K-nearest neighbor algorithm has been implemented for location estimation over a set of radio location fingerprints collected in a 3-D space. A 3-D visualization interface has been developed in VRML in order to display the real-time sensor positions and the data in the 3-D world. Preliminary experimental results show that the proposed scheme can achieve accurate and stable location tracking in indoor environments.
Keywords—Wireless sensor networks, ZigBee, 3-D localization, fingerprinting, visualization.
I. INTRODUCTION
Rapid growth of the MEMS (Micro-electromechanical systems) has enabled the developments of Wireless Sensor Network (WSN) technology, which has been drawing a lot of attention as a possible method to realize a wide variety of applications. The WSN is becoming a crucial technology, since it consists of a number of tiny, inexpensive, re-programmable, simple to network and potentially long-lasting wireless sensor nodes, capable of sensing and reporting the physical characteristics of the world for a variety of monitoring and control applications such as: tracking people, assets and equipment indoors [1]; disaster relief applications [2]; environment monitoring; building/home automation [3]; remote/preventive maintenance; and healthcare [4].
In most of these applications, a sensor node’s position is often the primary data that needs to be sensed [5]. A WSN, by default, cannot provide any information as to where an event has happened. To do so, usually, the reporting wireless node’s location has to be known. In other words, for tracking an object within a manufacturing plant, or for monitoring a patient in a hospital building, the automatic detection of the sensors’ location, also known as the Node Localization, is the core technology.
Wireless Node Localization can be defined as determining the location of a sensor node within the network with respect to origin. The techniques usually consist of the algorithms that estimate the locations of sensors with initially unknown location information by using knowledge of the absolute positions of a few sensors and inter-sensor measurements, such as distance and bearing measurements.
Node Localization in a WSN is a significant, key enabling technology, attracting considerable research interest. With the constrained resources of network sensors, as well as their high failure rate, many challenges exist in the automatic determination of the sensor’s location. Various application requirements, such as: scalability, energy efficiency, cost, accuracy, responsiveness and privacy, influence the research and development of sensor localization systems [6]. Moreover, the small amount of code space available in WSN nodes make the implementation of both the data service logic and the localization algorithm on a single node problematic, which forces the researchers to reduce the complexity of the localization techniques.
While much research has focused on developing localization algorithms and location-aware systems, the position computation problems are mostly formulated and solved in two dimensional planes. Less attention has been paid to the fundamental and challenging problem of real-time locating mobile objects in 3-D coordinate space, especially in indoor environments. Only a few researchers provide analysis and the benefits of the 3-D aspects of these solutions [7][8].
A few attempts to address 3-D localization indoors have typically done so using costly technologies such as the Ultra Wide Band (UWB) technology and WLAN and WiFi Technologies. There are a number of commercial systems based on these technologies for 3-D localization of objects and people in indoor spaces. For example, Time Domain and Ubisense provide a 3-D locating tracking system based on UWB technology for monitoring parts and people in factories [9], [10]. The real time locating systems (RTLS), based on various technologies, have become very popular in many areas. They are effective for the sole purpose of locating objects in indoor environments, and costly methods for 3-D localization in terms of hardware and deployment. AeroScout and Ekahau are major solution providers for locating assets using WiFi enabled RFID tags [11], [12].
In this paper our goal is not discussing all the commercial technologies for 3-D localization, but proposing a technology
having data networking capability in addition to location tracking, which is simpler and relatively cost-efficient than commercial solutions. In our research, we focus on ZigBee based wireless networks using embedded wireless platforms, also called Motes. ZigBee is a wireless networking technology built using the recent IEEE 802.15.4 communication standard and is characterized by its low cost, low power consumption at a low data rate (250 Kbps). A ZigBee sensor can be functional for many years on simple battery power. This is due to the implementation of the ZigBee protocol in which the sensors are mostly in deep sleep or idle mode to preserve power consumption [13].
Our goal is to complement the data networking capabilities of the ZigBee network with accurate 3-D location and tracking capabilities, thereby enhancing the value of such networks.
In this paper, we present an approach to 3-D node localization using ZigBee-based Wireless Sensor Networks with a sample deployment in our WSN Test Bed, which we developed for testing wireless localization algorithms within harsh and dynamic indoor environments.
The presented approach uses a modified-radio location fingerprinting algorithm, which uses Radio Signal Strength Indicator (RSSI) information gathered at multiple receiver locations in order to estimate a mobile object’s coordinates in 3-D space. The estimated locations of wireless sensors and the sensor data contained are presented by an interactive Virtual Reality visualization interface.
The remainder of this paper is organized as follows. In Section 2, we briefly present the related work in wireless node localization technologies. In Section 3, we discuss our overall research methodology. Section 4 presents a prototype implementation of the proposed approach and finally, conclusions are presented in Section 5.
II. RELATEDWORK
The effectiveness of wireless localization varies, depending on the parameters, such as: the physical phenomena used for location determination; the form factor of the sensing apparatus; power requirements; infrastructure versus portable elements; and resolution in time and space, etc. [14]. In general, the challenges and the performance of a WSN localization algorithm often depend on the application domain such as, indoors or outdoors, environmental conditions, physical distribution, topology etc. Due to the course of our intended application, we focus on the domain of location tracking indoors, such as, plants and factories, warehouses, public and service buildings.
A number of fundamental indoor location tracking techniques have been proposed in the literature, based on measuring the distance or angle between nodes in a network. The common methods are: the Angle of Arrival (AoA) [15], which detects the direction of the received signal in order to obtain range information; Time of Arrival (ToA) and Time Difference of Arrival (TDoA) [16], which use pulses of ultrasonic signals to determine the distance between two nodes. Ultrasonic systems, such as Cricket [17] and the Active
Bat [18] can achieve much higher accuracies using time-of-flight ranging. However, these systems require line-of-sight exposure of the receiver to ultrasound beacons in the infrastructure, and may require careful orientation of the receiver. It requires an extensive infrastructure and costly deployment in order to be implemented in large buildings. Infrared based systems, including the Active Badge [19]. can localize a user to a specific area with direct line-of-sight exposure to the IR beacon, but suffers errors in the presence of obstructions and differing light and ambient IR levels. A detailed review of various localization algorithms can be found in [5], [14] and [19].
The shortcomings, due to complexity of wireless hardware and additional infrastructure requirements, have made the Received Signal Strength Indicator (RSSI) technique the most popular method in distance estimation for wireless systems. The RSSI-based distance estimation is based on the physical fact of wireless communication that theoretically, the signal strength is inversely proportional to the squared distance between the transmitter and receiver.
RSSI may be considered as the simplest and cheapest method amongst the wireless distance estimation techniques, since it does not require additional, costly hardware for distance measurements. A known theoretical or empirical radio propagation model is used to convert the radio signal strength into distance between a radio transmitter and a receiver. Assuming that the fixed position of transmitter is known, the position of a mobile wireless receiver node can then be estimated by a least squares algorithm. However, in practice, the radio signals are highly variable and unstable under the influence of environment noises, obstacles, interference and the types of antenna. The signal strength is too sensitive to the harsh and dynamic environments, indoor environments due to multipath fading and interference which cause uncertainties in the radio communications amongst the wireless nodes. This condition makes it hard to model path loss and the RSSI mathematically [21]. This condition influences positioning accuracy.
An alternative approach of estimating position by signal strength is to use empirical measurements of received radio signals. By recording a database of radio signals, also called the ‘fingerprints’ along with their known locations, a wireless node, with an unknown position can estimate its position by acquiring a signature and comparing it to the known fingerprints in the database. A weighting scheme is used to estimate location when multiple fingerprints are close to the acquired signature. All of these systems require that the fingerprint database be collected manually prior to system installation, and rely on a central server to perform the location estimation.
Several systems such as, RADAR [22], DALS [23] have demonstrated the viability of this approach in wireless networks. RADAR has been developed and tested based on the fingerprinting approach for indoor environments. It uses the wireless network signals in order to estimate a mobile internet user’s location to within a few meters of his/her actual location. It has been one of the first implementations of radio location fingerprinting. With the inspiration of these approaches, the
MoteTrack has been developed, which employs a similar approach to tiny wireless motes. The idea behind MoteTrack is to improve the robustness of the system through a decentralized approach [24].
Recently, radio location fingerprinting has become a popular approach for commercial indoor localization systems since it provides, stable and reliable location estimates over short periods of time using minimal infrastructure. Currently, the technology has been commercially implemented by several vendors of RFID-based localization systems and RTLS.
III. RESEARCHMETHODOLOGY
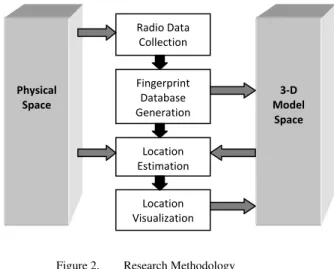
In this section we first describe the physical environment and the hardware used for our deployment, and all the phases of the 3-D location fingerprinting algorithm implemented including data collection, fingerprint database generation, location estimation and location visualization.
A. Wireless Sensor Network Test Bed
In order to realize the approach presented in this paper, the Wireless Sensor Network test bed has been developed in a former manufacturing lab, including machinery and manufacturing automation equipment in the facilities of the National Research Council Canada, Institute for Research in Construction in London, ON, Canada [25]. The harsh indoor environment of the laboratory replicates the intended application environment of WSN. The WSN test bed is expected to allow the flexibility to develop and to test certain sensor network services and applications prior to deployment; applications developed in the context of the test bed can be moved to the actual deployment environment.
For the development of the WSN test bed, a generic wireless sensor node platform, called a ‘mote’ has been used (see Figure 2). A mote without a power supply is typically several millimeters in length and width. External flash memory is also common to many nodes. Sensors and signal conditioning circuitry are external components, and thus maintain hardware generality. Several generations of mote platforms exist, ranging in size, power consumption, functionality and radio technology. We have chosen and implemented TelosB platform in our test bed [26].
The TelosB motes are tiny, versatile embedded platforms, equipped with ZigBee compliant radio transceiver, which allows low power radio transmissions and mesh networking amongst the nodes in the overall network. An on board flash memory and microprocessor allows performing local computations with the support of an analog to digital converter that allows reading data from various sensors.
Figure 1. TelosB wireless platform used in the WSN Test bed
B. 3-D Radio Location Fingerprinting
The approach proposed in this paper is an extension of the radio location fingerprinting algorithm, implemented in several phases that are executed and depicted in Figure 2.
Radio-frequency fingerprinting requires multiple radio transmitters and receivers deployed to provide overlapping coverage of an area, such as a floor in an office building. The sensor nodes, are located at a fixed infrastructure in order to model a physical space in terms of radio signal strength values by periodically broadcasting radio packets to the air. The fixed base station sensor nodes are called ‘fixed node’ in this paper. In our approach, we deployed multiple sensor nodes over the area such that we could collect radio signals in order to generate location fingerprints on a 3-D cubic grid space. The location fingerprints are used to estimate the positions in 3-D model space.
Radio Data Collection
Figure 2. Research Methodology
The fingerprinting approach consists of a setup or data collection process in which the signal strengths at each fixed sensor node are measured and stored. Each record has the format of {x, y, z, RSS1, ……. RSSN}, where (x, y, z) is the position in the 3-D space, and RSSi is the received signal strength in dBm at the i-th fixed node. N, the total number of fixed nodes, should be at least 4 to provide a reasonable localization performance in 3 dimensional spaces. To reduce the effects caused by noises and path loss, each RSSi is the average of multiple measurements collected over a time period. The collection of all measurements forms a 3-D radio signal strength matrix that consists of the featured signal strengths, or fingerprints, at each sampled position.
Following the setup process, a mobile sensor node may be localized using the signal strengths measured at each fixed node. For localizing a mobile sensor node, the algorithm searches the 3-D radio matrix collected in the data collection phase, and finds the fingerprint that best matches the signal strengths observed. That is, the mobile node compares the observed signal energy with the recorded, and picks the location (x, y, z) that minimizes the Euclidean distance as the location estimate. This technique is also referred to as nearest neighbour method. A slight variant of the technique involves finding the k nearest neighbours in signal space, and averaging
Fingerprint Database Generation Location Estimation 3‐D Model Space Physical Space Location Visualization SMC 2010
their coordinates to get the location estimate. The following explains the steps taken for the setup and location estimation processes using the fingerprinting technique.
1) Radio Data Collection
Radio data collection is the key step in the location fingerprinting algorithm. In this phase, the information about the radio signal as a function of the mobile node’s location is recorded. This phase has to be followed by an analysis in order to validate models for signal propagation and to construct the fingerprint database for position estimation in real-time. For realizing the 3-D data collection, we have deployed TelosB motes as fixed nodes in a cubical space.
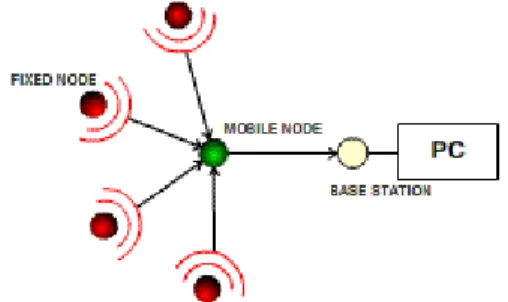
In our deployment we employ a mobile sensor node to receive broadcast packets periodically, measure the RSS value of each received packet and finally report the RSS value in dBm to the main base station that is connected to the data collection PC (See Figure 3).
The radio signal strength (RSS) information is recorded by using the ZigBee compliant CC2420 radio of the TelosB motes. The RSS is reported in units of dBm. A signal strength of s Watts is equivalent to 10*log10(s/0.001) dBm.
Figure 3. Topology of the Radio Data Collection Process
A Java-based application has been developed for controlling the entire data collection process. The application resides at the computer and simply manages and stores the collected RSS data and maps it to a point in the 3-D space. The user is requested to pick a point in the 3-D mesh prior to collecting data at that point.
As a result of the data collection process, a set of RSS data is collected in the mobile node. This set contains location and the RSS data that is measured from each fixed node. The set is further analyzed and put into the form of a fingerprint database and downloaded to the memory of the mobile nodes for location computation.
2) Location Estimation
The location estimation process is performed at every mobile node whose location needs to be known. The location computation takes place based on two sets of data; one set is an already constructed fingerprint database from the data collection phase; the second set is the RSS data measured by the mobile node upon receiving packets from every fixed node in the area of coverage (see Figure 4).
Figure 4. Location computation based on data sets.
To estimate the positions of the sensors, a K-Nearest Neighbour algorithm is applied to two sets of data. In order to formulate the location estimation process, we call the fingerprint database as a vector, which contains all of the average RSS from N fixed nodes at a particular location. The vector F is denoted as F = [f1, f2, f3…fN] at the position D = [d1, d2, d3…dN]. The second set of data is a vector denoted as R = [r1, r2, r3…rN]; each element in the vector is the independent RSS (in dBm) collected from fixed nodes in the location. The location d can be estimated by clustering the Euclidean distance |r - fi| between the measured fingerprint vector R and the location fingerprint vector fi with position di as follows:
To estimate the positions of a mobile sensor node in the 3-D space, mobile node compares every measured fingerprint with the ones contained in the fingerprint database using the K-Nearest Neighbour algorithm, which averages the coordinates of the fingerprint locations to get the location estimate. Averaging 2 to 4 nearest neighbours significantly improves the location accuracy.
C. 3-D Location Visualization
One of the most significant components of the proposed approach is the presentation of the location of sensors to the end users in a 3-D environment. For this purpose, we considered employing VRML (Virtual Reality Modeling Language), which is a powerful 3-D visualization tool for simple and web-based application development [27].
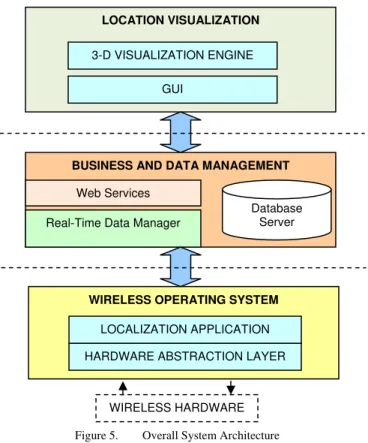
The 3-D Location Visualization system is an integrated framework with various layers of software components. It mainly consists of: i) Low-level wireless operating system Layer; ii) Middle-level business and data management layer; and iii) High-level location visualization layer. The structure of the overall system is shown in Figure 5.
Figure 5. Overall System Architecture
1) Low Level: Wireless Operating System Layer
The Wireless Operating System runs the low-level routines and algorithms at the wireless embedded platforms, having direct access to the microprocessor, radio, memory and other peripherals. This layer has been developed in the TinyOS operating system, an event-based non-blocking event scheduler for embedded systems, specifically developed for Wireless Sensor Network applications using motes [26].
TinyOS is an open-source platform, consisting of a library of modules coded in the NesC (Nested-C) programming language [28]. The wireless applications are fundamentally operated by signaling events, handling events, calling command functions and performing command functions between these modules. The wireless communication between nodes is managed with a carrier sense medium access data layer. Packets are encapsulated using an active message scheme [29].
In the proposed scheme, the wireless sensor nodes at each role (i.e. mobile node, fixed node) have their own algorithm and it is contained in the sensor’s code space. In addition, the base station node has been utilized for data collection from the overall sensor network. The information regarding the sensor data and the location estimate is carried to a centralized computer through the base station node. A base station node is physically connected to the computer and acts as a gateway. Typically, the base station is the same general hardware platform as the wireless sensor nodes. Router nodes bridge communication between the base station and sensor nodes that are beyond sufficiently reliable direct radio communication range.
2) Business and Data Management Layer (BDML)
The Real-Time Data Manager provides a software abstraction layer to communicate with the wireless platforms as well as to communicate with external applications through web services and a database server. At the current stage, this layer has been designed and developed in Java language to operate as a generic bridge between the wireless operating system and higher level applications. The Data Manager uses the serial port communication with a wireless mote and helps to log, display and manipulate the wireless data for testing and experimenting purposes. The web services interface of this layer provides the external applications a remote access to information provided by the wireless sensor network. Similarly, a database server is utilized in order to store persistent system information and to provide information to the external requests.
3) Location Visualization Layer
The Location Visualization Layer consists of a Java-based GUI, which allows users to validate the system operations. This application is intended for management of the human assisted operations of the overall system. The main component of the Location Visualization Layer is the 3-D visualization engine, which interprets the location information using 3-D Virtual Reality (VR) models of the environment. This feature helps in real-time monitoring, control and deployment of the wireless sensor nodes, hence supporting the real world applications of WSN. The 3-D real-time representation of the WSN data improves the usability of spatial information and, the visualization of reality compares to a simple and flat 2-D representation. Of all of the drawbacks of 2-D graphics, the most vital is the lack of capability to offer users a life-like representation of real environments [30]. VR is a good example of such a visualization technology since it provides a three dimensional realistic environment to provide a sense of reality and the impression of ‘being there’. VR has been widely referred and used in industrial applications [31], [32].
The 3-D Visualization Engine has been implemented in VRML Language and performs real-time data exchange with the BDML throughout web services. We periodically implemented the server application, which feeds the server database with the real time location data. The VRML interface communicates to the web database through the web services interface, in order to visualize the sensor locations.
IV. IMPLEMENTATION
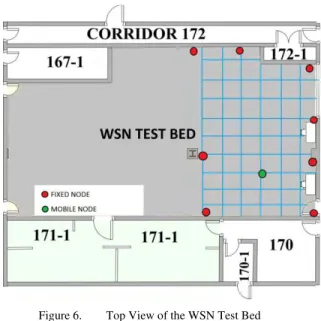
We have deployed the wireless sensors in the WSN Test Bed in order to test the 3-D wireless localization algorithm presented in this paper. We have utilized the ZigBee protocol, which is based on the IEEE 802.15.4 protocol in the 2.4GHz band. The layout of the Test Bed is shown in Figure 6. The dimension of the floor is approximately 13m by 15m and the height is 10m. We consider the test bed as a cubicle space and collected signal strength data at each node in the cubical mesh we constructed for generating fingerprinting database.
WIRELESS OPERATING SYSTEM BUSINESS AND DATA MANAGEMENT
Real-Time Data Manager
LOCATION VISUALIZATION 3-D VISUALIZATION ENGINE GUI Web Services Database Server LOCALIZATION APPLICATION
HARDWARE ABSTRACTION LAYER
WIRELESS HARDWARE
Figure 6. Top View of the WSN Test Bed
In the data collection phase, samples have been collected on a grid of 50 regularly spaced positions in order to form the 3-D radio signal strength matrix. Each sample in a data set has been collected at approximately a 0.20 second sampling interval. Twelve fixed nodes are distributed in the room in a cubical space. Figure 7 shows a snapshot of the 3-D model of our test bed in a web browser.
For location estimation, the nearest neighbours in signal space in terms of Euclidean distance and median distance have each been found. The coordinates of the four nearest neighbours are averaged to get the final location estimate of the mobile node.
Figure 7. 3-D Visualization Interface on a web browser
As a result of the experiments performed indoors, we have found that multiple RSSI values may exist at the same distance values, which makes it very difficult to obtain unique fingerprints using RSSI indoors. The influence of the multipath reflection greatly disturbs the location estimation process due to the change in the phase of the multi-path radio signal [33]. However, the algorithm has resulted with an average accuracy error of 1-2m at indoors. The reason is the location and density of the radio location fingerprints, collected during setup phase. The fingerprints collected from sender nodes, which are located at proper positions with minimal reflection, i.e. located at ground level, have increased the accuracy location estimation.
V. CONCLUSIONS
Node localization in WSN is a significant research area with a broad range of applications for indoor location tracking such as manufacturing plants; warehouses, residential and public buildings etc. Despite significant research developments in the area, there are still many unsolved problems due to harsh, dynamic environments. RSSI is an easy and less expensive way of predicting location in WSN, but it is often very problematic due to a harsh indoor environment with unpredictable electromagnetic interference, RF fading, and multipath interference.
In this paper, we have presented a 3-D indoor location tracking approach through ZigBee-based wireless sensor networks. Our approach uses the radio location fingerprinting technique, which is becoming very popular for industrial applications of location tracking, and extends it to a 3-D space with a prototype implementation for an indoor environment.
In this paper, we describe how to extend the basic fingerprinting approach for localization in 3-D indoor environments. We achieve this through constructing a 3-D signal strength matrix by extending the data collection process in 3-D. We have developed a set of custom low-level and high-level software applications for realization of the extended 3-D fingerprinting algorithm, visualization of sensor locations and integration of real-time sensor data to external applications.
We implemented, deployed, and evaluated our approach in our WSN test bed through a system using TelosB motes. The reason to choose this platform is to make use of the advantage of using small, inexpensive devices that can be embedded in the environment such as in walls, in equipment or people.
ACKNOWLEDGMENT
This work was partially supported by the AUTO21 Network of Centres of Excellence under the Intelligent Sensing and Control for Factory Automation project. (FC302 - FSC).
REFERENCES
[1] I.F. Akyildiz, W. Su, Y. Sankarasubramaniam, and E. Cayirci, “Wireless sensor networks: A survey,” Computer Networks J., 38(4), 393–422, 2002.
[2] Y. Li, Z. Wang, Y.Q. Song, “Wireless Sensor Network Design For Wildfire Monitoring,” Proc. of The Sixth World Congress on Intelligent Control and Automation, WCICA, Vol.1, pp. 109-113, Dallan, 2006. [3] M. K. Meyer, M. R. Brambley, “Pros & Cons of Wireless”, ASHRAE
Journal, pp. 54-59, Nov 2002.
[4] J. Yick, B. Mukherjee and D. Ghosal, “Wireless sensor network survey,” Computer Networks, 52(12), 2292-2330, 2008.
[5] D. Miorandi, E. Uhlemann, S. Vitturi, A. Willig, “Guest Editorial Special Section on Wireless Technologies in Factory and Industrial Automation—Part II,” Industrial Informatics, IEEE Transactions on , vol.3, no.3, pp.189-190, Aug. 2007.
[6] K. Muthukrishnan, M. Lijding, and P. Havinga, “Towards smart surroundings: Enabling techniques and technologies for localization,” in Proc. of the Int. Workshop on location and context awareness (Loca2005), 2005.
[7] W.Y. Chung and C.S. Yang, “Dynamic VRML-Based Navigable 3D Map for Indoor Location-Aware Systems,” Lecture Notes in Electrical Engineering, 21, 269-284, 2008.
[8] A.R. Jimenez, F. Seco, “Precise localisation of archaeological findings with a new ultrasonic 3D positioning sensor,” Sensors and Actuators A, 123–124, 224–233, 2005.
SMC 2010
[9] Time Domain, PLUS Ultra Wideband Real-Time Location,Available at: http://www.timedomain.com/plus.php (viewed, March 21st, 2010). [10] Ubisense, Ultra Wideband Location tracking, Available
at: http://www.ubisense.net/en/products (viewed March 20th, 2010).
[11] Aeroscout, WiFi-RFID System, Available at: http://www.aeroscout.com/content/wi-fi-rfid (viewed March 20th, 2010).
[12] Ekahau, WiFi Real Time Locating System (RTLS), Available at: http://www.ekahau.com/products/real-time-location-system/overview.html (viewed March 21st, 2010).
[13] ZigBee Alliance, Available at: http://www.zigbee.org (viewed, March 22nd, 2010).
[14] T. He, C.D.H., B.M. Blum, J.A. Stankovic, T. Abdelzaher, “Range-Free localization schemes in large scale sensor networks,” Proc. of the 9th Annual Int. Conf. on Mobile Computing and Networking, San Diego, 2003.
[15] R. Peng and M. L. Sichitiu, ”Angle of Arrival Localization for Wireless Sensor Networks,” Proc. of IEEE Communications Society, Conf. on Sensor, Mesh and Ad Hoc Communications and Networks, September 2006.
[16] A. Boukerche, H.A.B.F. Oliveira, E.F. Nakamura, A.A.F. Loureiro, “Localization Systems for Wireless Sensor Networks,” IEEE Wireless Communications: Wireless Sensor Networking, pp. 6-12, 2007. [17] N.B. Priyantha, A. Chakraborty, H. Balakrishnan, “The cricket
location-support system”. In: Proceedings of the 7th ACM MobiCom, 2000. [18] A. Ward, A. Jones, A. Hopper, “A new location technique for the active
office”, IEEE Personal Commun ications, 1997.
[19] R. Want, A. Hopper, V. Falcao, J. Gibbons , The Active Badge location system. Technical Report 92.1, Olivetti Research Ltd. (ORL), 1992. [20] J. Hightower, G. Borriello, “Location Systems for Ubiquitous
Computing,” Computer, 34(8), 57-66, 2001.
[21] K.W. Cheung, H.C. So, W.K. Ma, Y.T. Chan, “Received Signal Strength Based Mobile Positioning via Constrained Weighted Least Squares,” Proc. of Int. Conf. on Acoustics, Speech, and Signal Processing (ICASSP 2003), vol. 5, 2003.
[22] P. Bahl and V. Padmanabhan, “RADAR: An in-building RF-based user location and tracking system” Proc. of INFOCOM, pp. 775–784, March 2000.
[23] T. Christ, P. Godwin (1993) “A prison guard duress alarm location system”, In proceedings of IEEE ICCST, 1993.
[24] K. Lorincz and M. Welsh, “MoteTrack: a robust, decentralized approach to RF-based location tracking,” Personal and Ubiquitous Computing, vol.11, n.6, pp. 489-503, 2007.
[25] M. Bal, H. Xue, W. Shen, H. Ghenniwa,” A testbed for localization and tracking in wireless sensor networks”, 2009 IEEE International Conference on Systems, Man, and Cybernetics, San Antonio, Texas, October 11-14, pp. 3681-3686, 2009.
[26] J. Polastre , R. Szewczyk , D. Culler, “Telos: enabling ultra-low power wireless research,” Proceedings of the 4th international symposium on Information processing in sensor networks, Los Angeles, California, April 24-27, 2005.
[27] VRML, Virtual Reality Modelling Language, http://www.w3.org/MarkUp/VRML/ (Last viewed on March
22nd, 2010).
[28] D. Gay, P. Levis, R. von Behren, M. Welsh, E. Brewer, and D. Culler, “The nesC language: a holistic approach to networked embedded systems”, In Proceedings of SIGPLAN 2003 Conference on Programming Language Design and Implementation (PLDI), New York, NY, USA, pp.1–11, 2003.
[29] P. Buonadonna, J. Hill, and D. Culler, “Active message communication for tiny network sensors,” (viewed 30 March 2009), Available at: http://www.tinyos.net/papers/ammote.pdf.
[30] G.C. Burdea, “Invited Review: The Synergy Between Virtual Reality And Robotics,” IEEE Trans. on Robotics and Automation, 15(3), 400-410, 1999.
[31] M. Bal, H. F. Manesh, and M. Hashemipour, “Virtual reality-based requirements analysis (VR-RA) tool: a case study in die-casting industry,” Int J Comput-Integr Manufacturing, vol.21,no. 3, pp. 231-244, April 2008.
[32] M. Bal and M. Hashemipour, “Virtual factory approach for implementation of holonic control in industrial applications: A case study in die-casting industry,” Robotics and Computer-Integrated Manufacturing, vol.25, no.3, pp.570-581, June 2009.
[33] T. Rappaport, “Wireless Communications: Principles and Practice, 2nd edition,”, 2000.