HAL Id: hal-03107688
https://hal.inrae.fr/hal-03107688
Submitted on 12 Jan 2021
HAL is a multi-disciplinary open access
archive for the deposit and dissemination of
sci-entific research documents, whether they are
pub-lished or not. The documents may come from
teaching and research institutions in France or
abroad, or from public or private research centers.
L’archive ouverte pluridisciplinaire HAL, est
destinée au dépôt et à la diffusion de documents
scientifiques de niveau recherche, publiés ou non,
émanant des établissements d’enseignement et de
recherche français ou étrangers, des laboratoires
publics ou privés.
Food Systems: A Tool for Agroecology Performance
Evaluation (TAPE)
Anne Mottet, Abram Bicksler, Dario Lucantoni, Fabrizia de Rosa, Beate
Scherf, Eric Scopel, Santiago Lopez-Ridaura, Barbara Gemmil-Herren, Rachel
Bezner Kerr, Jean-Michel Sourisseau, et al.
To cite this version:
Anne Mottet, Abram Bicksler, Dario Lucantoni, Fabrizia de Rosa, Beate Scherf, et al.. Assessing
Tran-sitions to Sustainable Agricultural and Food Systems: A Tool for Agroecology Performance Evaluation
(TAPE). Frontiers in Sustainable Food Systems, Frontiers Media, 2020, 4, �10.3389/fsufs.2020.579154�.
�hal-03107688�
Edited by: Sudhakar Srivastava, Banaras Hindu University, India Reviewed by: Paola Migliorini, University of Gastronomic Sciences, Italy Johanna Jacobi, University of Bern, Switzerland Christopher Bacon, Santa Clara University, United States *Correspondence: Anne Mottet anne.mottet@fao.org
Specialty section: This article was submitted to Agroecology and Ecosystem Services, a section of the journal Frontiers in Sustainable Food Systems Received: 01 July 2020 Accepted: 10 November 2020 Published: 16 December 2020 Citation: Mottet A, Bicksler A, Lucantoni D, De Rosa F, Scherf B, Scopel E, López-Ridaura S, Gemmil-Herren B, Bezner Kerr R, Sourisseau J-M, Petersen P, Chotte J-L, Loconto A and Tittonell P (2020) Assessing Transitions to Sustainable Agricultural and Food Systems: A Tool for Agroecology Performance Evaluation (TAPE). Front. Sustain. Food Syst. 4:579154. doi: 10.3389/fsufs.2020.579154
Assessing Transitions to Sustainable
Agricultural and Food Systems: A
Tool for Agroecology Performance
Evaluation (TAPE)
Anne Mottet1*, Abram Bicksler1, Dario Lucantoni1, Fabrizia De Rosa1, Beate Scherf1,
Eric Scopel2, Santiago López-Ridaura3, Barbara Gemmil-Herren4, Rachel Bezner Kerr5,
Jean-Michel Sourisseau2, Paulo Petersen6, Jean-Luc Chotte7, Allison Loconto1,8and
Pablo Tittonell2,9,10
1Food and Agriculture Organization of the United Nations (FAO), Rome, Italy,2Centre de coopération internationale en
recherche agronomique pour le développement (CIRAD), Montpellier, France,3International Maize and Wheat Improvement
Center (CIMMYT), Texcoco, Mexico,4World Agroforestry Centre (ICRAF), Nairobi, Kenya,5Department of Global
Development, Cornell University, Ithaca, NY, United States,6Agricultura Familiar e Agroecologia (AS-PTA), Rio de Janeiro,
Brazil,7Eco&Sols Joint Research Unit, Institut de recherche pour le développement (IRD), Montpellier, France,8Laboratoire
Interdisciplinaire Sciences Innovations Sociétés (UMR LISIS 1326—CNRS, ESIEE, INRAE, UGE), Institut national de recherche pour l’agriculture, l’alimentation et l’environnement (INRAE), Université Gustave Eiffel, Marne-la-Vallée, France,
9Grupo Interdisciplinario de Investigación-Extensión en Agroecología, Ambiente y Sistemas de Producción (GIAASP),
Instituto Nacional de Tecnología Agropecuaria (INTA), San Carlos de Bariloche, Argentina,10Institute of Evolutionary Life
Sciences (GELIFES), Groningen University, Groningen, Netherlands
There is increasing interest in agroecology as a way to move toward more sustainable agriculture and food systems. However, the evidence of agroecology’s contribution to sustainability remains fragmented because of heterogeneous methods and data, differing scales and timeframes, and knowledge gaps. Facing these challenges, 70 representatives of agroecology-related organizations worldwide participated in the development of the Tool for Agroecology Performance Evaluation (TAPE), to produce and consolidate evidence on the multidimensional performances of agroecological systems. TAPE is composed of: Step 0, the preliminary step that includes a description of the main socio-economic and demographic characteristics of the agricultural and food systems and an analysis of the enabling environment in terms of relevant policy, market, technology, socio-cultural and/or historical drivers; Step 1, the Characterization of Agroecological Transitions (CAET), based on the 10 Elements of Agroecology adopted by FAO and its member countries, using descriptive scales to establish scores and assessing the degree of transition, with information from the farm/household and community/territory scale; Step 2, the Core Criteria of Performance listing the key dimensions considered relevant to address the Sustainable Development Goals (SDGs): Environment & climate change; Health & nutrition; Society & culture; Economy and Governance. Finally Step 3, a participatory validation of the results obtained from the previous steps with the producers and relevant stakeholders. TAPE can be used (i) to assess the extent of agroecological transition among agricultural producers in a community or a territory, (ii) to monitor and evaluate projects by characterizing the initial
and subsequent steps in an agroecological transition, and/or (iii) to evaluate widely diverse agricultural systems against agroecological elements and how they contribute to the achievement of the SDGs. Its application can support the transition of all forms of agricultural systems toward more sustainable practices and the formulation of adequate policies to enable this transformation. Preliminary results from pilot applications show that TAPE can perform in a variety of geographic regions and agroecosystems and that it allows assessment of performances of various criteria that move beyond classic indicators to begin to build a global evidence base for agroecology and support transformation to sustainable agricultural production and food systems.
Keywords: agroecolgy, sustainability assessment framework, indicators, multicriteria evaluation, farm, territory, participatory process
INTRODUCTION
The global food system is facing environmental, social, and health challenges. While nature and ecological principles were applied by family farmers for millenia, agriculture became increasingly dependent on external inputs, including synthetic fertilizers, in the last century, particularly in large scale production systems. Agroecology is an alternative and systemic approach that builds on local and ecological knowledge, enhances social capital and confronts the proliferation of agrochemical inputs (HLPE, 2019). This approach is at the same time a scientific field, a set of agricultural practices and a social movement (Wezel et al., 2009). Since its origins in the 1930’s when scientists started to use the term agroecology to refer to the application of ecological principles to agriculture, its scale and dimensions have grown tremendously (Altieri, 2002, 2018; Ollivier and Bellon, 2013). With an initial scope of studying the production system, agroecology extended to cover the larger agroecosystem and, more recently, to the level of a food system, including agri-food supply chains and consumption patterns (Gliessman, 2015). Due to this long history, tripartite origin, systemic scope and transformational aspiration, agroecology presents a promising approach for shifting toward more sustainable food systems.
As agroecology has been increasingly brought into the international dialogue on the future of food and agricultural production, there have been calls for building the evidence base of its performance across its multiple dimensions. Over the last decade, a growing body of literature has demonstrated the positive impacts of agroecology, on several aspects: environment (Francis et al., 2003; Gliessman, 2015; Modernel et al., 2018); food and nutrition security (Luna-González and Sørensen, 2018; Deaconu and Mercille, 2019; Kerr et al., 2019a) and on households’ incomes (D’Annolfo et al., 2017; Van der Ploeg et al., 2019).Yet these results remain fragmented due to heterogeneous methods and data, differing scales, contexts, and timeframes. Since agroecology is generating growing political interest for its potential to make our food systems more sustainable, there is a need for global and comparable evidence on its multidimensional performance at the different scales of agroecological practices that can be used to inform policy-making processes. This
evidence needs to be co-constructed with a diversity of actors, operating at different scales, timeframes, and contexts, and dovetailed into their existing work. It also should be able to contribute to evaluating a wide range of agricultural systems against the 10 Elements of Agroecology approved by FAO member nations (FAO, 2018a; Barrios et al., 2020). This need for evidence has been expressed at the intergovernmental level, by the 26th Committee on Agriculture of the United Nations Food and Agriculture Organization (COAG, 2018), and also by the High Level Panel of Experts of the multi-stakeholder Committee on Food Security (HLPE, 2019).
In response to this call, FAO coordinated the participatory development of the Tool for Agroecology Performance Evaluation (TAPE), whose general objective is to produce consolidated evidence on the extent and intensity of the use of agroecological practices and the performance of agroecological systems across five dimensions of sustainability: (i) environment, (ii) social and cultural, (iii) economic, (iv) health and nutrition, and (v) governance. These five dimensions were identified as priorities during the consultative process. They include the three pillars of the initial definition by the Brundtland Commission (economic, social, and environmental) as well as two additional dimensions of particular relevance for policy makers in the area of food and agriculture, which were also included by other frameworks for the assessment of agricultural sustainability: governance (see for example SAFA (FAO, 2014) and nutrition [see e.g., (Peano et al., 2014), RHoMIS (Herrero et al., 2017), or IDEA (Zahm et al., 2008)].
This paper was prepared by the FAO coordination team and a number of the members of the technical working group that supported the development of the TAPE. The paper presents TAPE and the methodological choices that were made through the process of co-development. These relate to: the scale of assessment, the diversity of production systems to consider at the global level, and the multicriteria and integrated nature of the evaluation. We argue that such a tool can contribute to the assessment of the sustainability of our agricultural and food systems in a multidimensional manner and in a variety of contexts. We also argue that its application can support the transition toward more sustainable food systems. We illustrate the use of the tool
for different types of applications, from project monitoring to regional assessments or comparative analysis, and in different geographical contexts.
METHODS
Process of Development and Participants
The development process of TAPE was coordinated by FAO and included (i) a review of existing frameworks and indicators for assessing sustainability in agriculture, (ii) a participatory and inclusive multi-stakeholder consultation phase based on a review and prioritization of over 70 indicators by more than 450 participants over 4 months and (iii) an international in-person workshop with 70 participants from academia, non-profit, government, social movement, private sector, and from international organizations. After this workshop, a technical working group of 16 people was formed, including scientists and civil society representatives working on agroecology in different parts of the world. The technical working group in collaboration with the FAO coordination team further developed an analytical framework upon which an operable tool could be built to assess performance indicators that go beyond standard measures of productivity (e.g., yield/ha) and that better represent the benefits and trade-offs associated with different types of agricultural systems (FAO, 2019a). This work benefited from the expertise of the technical working group members in assessing sustainability in agriculture and food systems and in implementing agroecology projects. This process contributed to their work by providing them with a global platform to showcase projects and results and with an opportunity to reflect on their approach of agroecology and better coordinate with other on-going initiatives. TAPE is currently being pilot tested in over 10 countries, including Cambodia, China, Laos, Vietnam, Mexico, Peru, Argentina, Nicaragua, Senegal, Mali, Tanzania and Spain. Its final version will include feedback from these pilot assessments. Pilot assessments require initial training of enumerators which have been carried out both in person and in remote form, with a duration varying from 8 h to 2 days.
Founding Principles and Key Attributes of
TAPE
Twenty founding principles were agreed upon during the participatory process of TAPE’s development, which cover: a) Processes: building on existing frameworks and datasets;
using approaches for both sector-specific and integrated production systems; testing the tool with partners involving producers;
b) Scope of the tool: globally applicable; producing evidence at various scales, using the farm/household as assessment unit but collecting information and being relevant at the community/territory level;
c) Relevance of the evidence produced: linking closely with the SDGs; informing global sustainability challenges; and d) Characteristics of the tool and methodological choices:
simplicity, requiring minimum data collection, but
extendable; scientifically robust but operationally flexible; characterizing agroecological transitions using the 10 Elements of Agroecology (FAO, 2018a) and evaluating the performance of the systems using objective indicators. Reviews of sustainability assessment frameworks usually conclude that there is no one-size-fits-all solution (Schader et al., 2014) and that the method that is most suitable to the context and the evaluation process should be selected (Cândido et al., 2015; De Olde et al., 2016). Our non-exhaustive review of existing frameworks and consultation with experts led to the definition of key attributes for TAPE to respond to the mandate given, which are summarized in Table 1. These key attributes also respond to the founding principles described above.
In particular, the Evaluation of Natural Resource Management Systems, or MESMIS by its Spanish acronym, inspired the team to take a stepwise approach for TAPE. MESMIS is a reference evaluation framework commonly used in Latin America, which provides principles and guidelines for the derivation, quantification and integration of context-specific indicators through a participatory process involving local actors. The MESMIS evaluation cycle features an inextricable link between system evaluation, system design, and system improvement (López-Ridaura et al., 2002).
The stepwise approach adopted in TAPE is summarized in
Figure 1. It is based on two central steps (1 and 2) that consist of assessing the level of agroecological transitions and quantifying impacts on the core criteria of performance. While Step 1, based on the 10 Elements of Agroecology, provides a diagnostic on where the system stands in terms of its transition toward sustainability, Step 2 measures in quali-quantitative terms the impact of agroecological systems on the various dimensions of sustainability. This duality is a response to one of the basic principles identified during the consultation phase. The two core steps are complemented by a preliminary description of the context (step 0), with the facultative inclusion of a typology of transitions (step 1 bis), and a final analysis and participatory interpretation of results (step 3). The 2 core steps (Step 1 and 2) can be undertaken with an electronic survey form, using KoBoToolbox1, a suite of free and open source tools
for field data collection specially developed for humanitarian work and challenging environments. This tool directly populates a central database. Step 1 and Step 2 can be undertaken simultaneously in the field and will take a maximum of 3 h, but they can also be carried out in two separate visits of ∼1 h and 2 h.
When assessing agroecological systems at farm scale, a sample of respresentative farms/households within the same territory or landscape across a spectrum of production systems should be included in the survey in order to create inference spaces on the relative performance of these systems (Section Scale of Assessment, Data Collection, and Sampling Methodology). If these units are homogeneous and meet other statistical robustness parameters, they may be aggregated to then provide
TABLE 1 | Main key attributes retained from a number of existing frameworks reviewed and main differences between those frameworks and TAPE. Framework Main key attributes retained Main differences
MESMIS—Marco para la Evaluacíon de Sistemas de Manejo de recursos naturales incorporando Indicadores de Sostenibilidad (GIRA-UNAM) (López-Ridaura et al., 2002)
• Participatory • Step-wise hierarchical • Flexible
• Starts with contextualization
• Indicators can be quantified by different methods vs. recommended harmonized protocols are provided in TAPE
GTAE—Groupe de Travail sur les Transitions Agroécologiques
(CIRAD-IRD-AgroParistech)—Memento pour l’évaluation de l’agroécologie (Levard et al., 2019)
• Simple and not unreasonably time consuming • Allows integration in broader systems of monitoring
and evaluation
• Most criteria are shared with TAPE and two criteria use the same methods
• Initial step of complete agrarian diagnostic not included in TAPE
• Some GTAE criteria are proposed as optional advanced criteria in TAPE as they require more time and resources
SOCLA—Sociedad Científica Latinoamericana de Agroecología, Method to assess sustainability and resilience in farming (Nicholls et al., 2004)
• Participatory and simple
• Soil health assessment used as core criteria in TAPE • Almost all other criteria are common
• In depth crop health assessment not included in TAPE, can be used as advanced criteria Sustainable Intensification Assessment
Framework (Musumba et al., 2017)
• No focus on particular practices • Addresses different scales (field/ animal,
farm/household, community/ territory) • 6 domains of sustainability are aligned with the 5
dimensions of TAPE
• Some of the criteria/indicators are included as advanced criteria in TAPE
LUME—a method for the economic-ecological analysis of agroecosystems (Petersen et al., 2020)
• Participatory
• Starts with contextualization • Qualitative and quantitative evaluations • Values the non-monetary economy
• Analyzes the economic performance of agroecosystems by combining degrees of autonomy and productivity of the production factors (land and labor)
• Specifies the degree of social integration of farming families in the territorial
socio-technical networks Measuring the impact of ZBNF, the Zero Budget
Natural Farming and (LVC, 2016)
• Participatory and possible self-assessment • Large number of common indicators /impact
• Method largely left to implementer to define while TAPE provides recommended protocols The Economics of Ecosystems and
biodiversity—(TEEB, 2018)
• Separates 2 steps: description of the system and analysis of the impacts
• 4 dimensions of impacts included (and TAPE adds a 5th)
• Economic assessment based on 4 capitals, which is not the entry point in TAPE
Sustainable Rural Livelihoods approach (Sourisseau, 2014)
• Includes an analysis of the context (institutions, household activities…)
• The qualification of assets provides an option to integrate the 10 Elements within TAPE
• Not participatory
Participatory methodologies from Malawi and Tanzania (Kerr et al., 2019c)
• Assessing systems in transition • Participatory and based on interviews
• Indicators left to implementer to define while TAPE provides recommended protocols SAFA–Sustainability Assessment of Food and
Agriculture systems (FAO, 2014)
• Includes 4 dimensions of sustainability (environment, social, economic and governance), and TAPE adds a 5th(health and nutrition)
• Aims to be global and applicable to all types of production systems
• Time consuming (21 themes and 58 sub-themes, 118 indicators) while TAPE is simple and not unreasonably time consuming
• Targets enterprises (farms or companies) while TAPE targets farms and communities Rural Household Multi-Indicator Survey
(RHoMIS) (Herrero et al., 2017)
• Works at household level
• Large number of common indicators in Step 2
• TAPE starts with an analysis of the enabling environment and follows with a diagnostic of the agroecological transition before looking at performances
(Indicateurs de Durabilité des Exploitations Agricoles or Indicatorsof Sustainable Farm Development (IDEA) (Zahm et al., 2008)
• Step-wise hierarchical • Specific quantitative indicators
• 28 out 41 IDEA indicators are shared with TAPE • Can be used as self-assessment tool
• Three main dimensions of sustainability in IDEA are included in TAPE + two additional ones • TAPE includes context, enabling environment and
level of transition before quantitative assessment
a “snapshot” at a territorial level of the overall performance of the systems.
Scale of Assessment, Data Collection, and
Sampling Methodology
While the elementary unit for agricultural management is the farm/household, the territory/community is the scale at which a number of processes necessary for the agroecological transition
take place (Gliessman, 2015). In TAPE, the farm/household is the elementary unit of measure, but as in any systems approach immediate lower (e.g., plot, herd) and higher (landscape, territory or community) levels need to be considered and results made relevant at such levels. In this article we focus mostly on asessments at farm/household level, as the current versions of the analytical tool and e-forms are ready, available and operable at this scale. Specific methods for better including
FIGURE 1 | The stepwise approach for implementing the Tool for Agroecology Performance Evaluation (TAPE) (FAO, 2019a).
agroecological transitions and performance at higher levels (community, region, etc.) are under construction to complement the current farm-level tool. Step 0 integrates context and enabling environment information from wider scales, such as the regional or national if relevant. Similarly, as for completing Step 1 (Characterization of Agroecological Transition—CAET), enumerators also need to take into account some features of the productive systems at the community or territorial level (especially for assessing the elements of Co-creation and Sharing of Knowledge, Circular and Solidarity Economy and Responsible Governance). Data collection for Step 2 (Core criteria of performance) is conducted at the farm/household level, with information specifically collected from individuals (both women and men), but results can be aggregated to the territory/community level, in particular in the case of the application of Step 1 bis, the typology of transitions to reduce the size of the sample of systems to be assessed based on the result of the CAET (Step 1).
Aggregation at higher scales requires carefully defined farm sampling methods, closely related with the objectives of the analysis (more information is provided in the
Supplementary Information). A stratified or purposive
sampling may be used. Farms and/or household units are sampled within the same territory to provide a territorial snapshot (i.e., making deductions about a particular territorial population using some form of sampling drawn from that population) under the assumption that units belonging to the same territory are more similar to each other than units in different territories. Therefore, it is hoped that the majority of differences between observations (variance) belonging to the same territorial group should come from their level of application of practices. This methodology can be adapted to any level of analysis;
in fact, the generic terms ’region’ or ’territory’ may refer here to different strata such as a municipality, a watershed, a province, an administrative region, or any other defined area.
DESCRIPTION OF ASSESSMENT STEPS
Step 0—Systems and Context
Recognizing that any assessment of performance should be placed in its specific context, Step 0 is a preliminary step that collects information from the territorial, regional and national levels. This step is first conducted as a desk review using a template with a common core set of questions that includes: a description of the main territory of interest in which TAPE will be used, demographic characteristics of farms/households in that territory, descriptions of the ecological environment, descriptions of the social and productive environment and of the market structure in the territory, and descriptions of the enabling environment for agroecology. The enabling environment can include a listing of public policies at national, state/province, and local levels that can support or hinder the transition to agroecology, and the existence of local actors, groups or networks and educational institutions that can support the agroecological transition of local producers. It can also include elements of local economy and power relations between actors that can influence opportunities for farmers or cooperatives. Beyond simply listing these attributes, stakeholders completing this step (e.g., enumerators, CSO workers, government agents, academics, etc.) can provide evidence, links, and secondary information (published literature and existing meta-data, such as reports by government and UN organizations, national statistics, CSO project documents etc.) to support this step. In addition to implementation via a desk review, this step can also include a
FIGURE 2 | The 10 Elements of Agroecology (FAO, 2018a).
TABLE 2 | Characterization of agroecological transitions (CAET): Descriptive scales and scores for the element “Diversity.”
Index 0 1 2 3 4 D IV E R S IT Y
Crops Monoculture (or no crops cultivated)
One crop covering more than 80% of cultivated area
Two or three crops More than 3 crops adapted to local and changing climatic conditions
More than 3 crops and varieties adapted to local conditions. Spatially diversified farm by multi-, poly- or inter-cropping
Animals (including fish and insects)
No animals raised One species only Several species, with few animals
Several species with significant number of animals
High number of species with different breeds well-adapted to local and changing climatic conditions Trees (and other
perennials)
No trees (nor other perennials)
Few trees (and/or other perennials) of one species only
Some trees (and/or other perennials) of more than one species
Significant number of trees (and/or other perennials) of different species
High number of trees (and/or other perennials) of different species integrated within the farm land
Diversity of activities, products and services
One productive activity only (e.g., selling only one crop)
Two or three productive activities (e.g., selling two crops, or one crop and one type of animals)
More than 3 productive activities
More than 3 productive activities and one service (e.g., processing products on the farm, ecotourism, transport of agricultural goods, training etc.)
More than 3 productive activities, and several services
semi-structured consultation with key stakeholders, in the form of a workshop for example.
Several key indicators of Step 0 are also collected at the producer level as part of the survey. These data include the location of the farm/household (with geolocation), size of the farm, basic demographics of the household, market access, etc.
The detailed templates for Step 0 are provided in
Supplementary Information.
Step 1 — Characterization of
Agroecological Transition (CAET)
Step 1 consists of characterizing the degree of transition to agroecology of agricultural systems (e.g., farms/households, communities/territories) based on the 10 Elements of Agroecology (Figure 2). It can be completed as a guided exercise with intermediaries or as through a self-assessment by producers after initial capacity building.
The 10 Elements are used as criteria to define semi-quantitative indices that take the form of descriptive scales with scores from 0 to 4. As an example, Table 2 provides the relevant indices for the element “Diversity,” which are: (i) Diversity of crops, (ii) Diversity of animals, (iii) Diversity of trees, and (iv) Diversity of activities, products and services. The scores of each index for this element range from 0 to 4, depending on how diversified the production is. The scores of the four indices are summed (e.g., 2+3+3+4 = 12) and the totals are standardized on a scale from 0 to 100% (12/16 = 75%) to obtain the general score for the element “Diversity.”
The same method is applied to all 10 Elements. While no prescriptive threshold is defined, systems with high scores across all 10 Elements are considered already well-progressed in their agroecological transition. Each element is described with three or four indices, for a total number of indices to be scored in the CAET of 36. Indices for the other nine elements are presented in Table 3 and descriptive scales are provided in
Supplementary Information. Step 1 requires a participatory
preliminary translation in the local context as the five different scale for each index should describe the current and possible future positions of agroecological systems in each territory. It can be completed as a self-assessment by producers or community leaders or as guided exercise led by technicians, CSO workers, extensionists, scientists or government agents. It requires about an hour to be completed.
When a large number of cases are assessed using the CAET within a relatively homogeneous territory or spatial scale, and are shown to be fairly homogeneous in their variances, it may be desirable (or necessary in some cases) to draw upon a subsample of systems (or case studies) before proceeding with the performance criteria (Step 2). Selecting these case studies may be done by means of a typology. Step 1bis is proposed as an optional step that consists of analyzing and categorizing the individual farms/households. Criteria used can be location in the landscape, main orientation of production or any relevant criteria to the analysis. The results of the CAET can also be used to define the typology. Similar profiles of CAET scores over the 10 Elements can be aggregated in clusters. Farms/households can be clustered along a gradient of agroecological transition according to their aggregate CAET score over the 10 Elements.
Step 2—Core Criteria of Performance
Step 2 aims to document the multiple outcomes of agroecology, as opposed to the often singular focus in much of agricultural research (e.g., yields). It consists of assessing the performance of the farms/households on the five key dimensions identified as priorities for agriculture and food systems to achieve the Sustainable Development Goals (SDGs). The key dimensions were identified during the International Expert Workshop on Multidimensional Assessment of Agroecology (8th−9th October 2018, Rome). They correspond to the priority areas of work for policy makers.
Step 2, similarly to Step 1, was designed to be applicable and relevant to all contexts, agroecological zones and production systems. It should also be simple enough to use in a limited amount of time and with limited resources. The criteria used
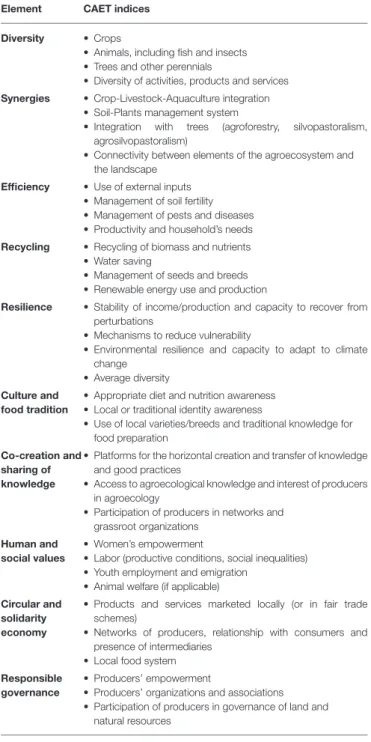
TABLE 3 | Indices used for each of the 10 Elements of Agroecology. Element CAET indices
Diversity • Crops
• Animals, including fish and insects • Trees and other perennials
• Diversity of activities, products and services Synergies • Crop-Livestock-Aquaculture integration
• Soil-Plants management system
• Integration with trees (agroforestry, silvopastoralism, agrosilvopastoralism)
• Connectivity between elements of the agroecosystem and the landscape
Efficiency • Use of external inputs • Management of soil fertility • Management of pests and diseases • Productivity and household’s needs Recycling • Recycling of biomass and nutrients
• Water saving
• Management of seeds and breeds • Renewable energy use and production
Resilience • Stability of income/production and capacity to recover from perturbations
• Mechanisms to reduce vulnerability
• Environmental resilience and capacity to adapt to climate change
• Average diversity Culture and
food tradition
• Appropriate diet and nutrition awareness • Local or traditional identity awareness
• Use of local varieties/breeds and traditional knowledge for food preparation
Co-creation and sharing of knowledge
• Platforms for the horizontal creation and transfer of knowledge and good practices
• Access to agroecological knowledge and interest of producers in agroecology
• Participation of producers in networks and grassroot organizations
Human and social values
• Women’s empowerment
• Labor (productive conditions, social inequalities) • Youth employment and emigration
• Animal welfare (if applicable) Circular and
solidarity economy
• Products and services marketed locally (or in fair trade schemes)
• Networks of producers, relationship with consumers and presence of intermediaries
• Local food system Responsible
governance
• Producers’ empowerment
• Producers’ organizations and associations • Participation of producers in governance of land and
natural resources
to assess the performance of systems should be able to generate harmonized data across countries, but should also be flexible enough to reflect specific characteristics and priorities in the local context. On the basis of the results of an on-line consultation and of the expert workshop and in order to comply with these requirements, a list of 10 core criteria was prioritized based on an initial list of almost 60 indicators. This list of 10 core criteria is presented in Table 4, as well as the proposed method for each of them and the main key dimension to which each contributes.
TABLE 4 | Ten Core criteria of performance of agroecology and their links to SDG indicators. Main dimension # Core criteria of
performance
Proposed method of assessment Source
Governance 1 Secure land tenure (or mobility for pastoralists)
Type of tenure over land (or existence and use of pastoral agreements and mobility corridors)
SDG 1.4.2, 5.a.1 and 2.4.1 sub-indicator 11 FAO, 2018b
Economy 2 Productivity Gross output value per hectare Gross output value per person SDG 2.4.1 sub-indicator 1FAO, 2018b 3 Income Revenue from plants, animals, other farm activities, subsidies, and rent of
land
- (operating expenses + depreciation + taxes + cost of labor + interests + costs for renting land) + subsidies
SDG 2.4.1 sub-indicator 2;Levard et al., 2019
4 Value added Gross value of agricultural production—(expenditures for inputs + intermediates consumptions + depreciation)
Levard et al., 2019
Health and nutrition 5 Exposure to pesticides Quantity applied, area, toxicity and existence of risk mitigation equipment/practices, other ecosystem-based IPM strategies used, farm-derived products used
Sub-indicator seven of SDG 2.4.1FAO, 2018b 6 Dietary diversity Minimum Dietary Diversity for Women, based on consumption of 10 food
groups in the past 24 h
FAO and FHI 360, 2016
Society and Culture 7 Women’s empowerment Abbreviated Women’s Empowerment in Agriculture Index (A-WEAI) IFPRI, 2012 8 Youth employment
opportunity
Access to jobs, training and or education; migration SDG 8.6.1ILO., 2018 Environment 9 Agricultural biodiversity Relative importance of crop varieties, animal breeds, trees and semi-natural
environments in production units
SDG 2.4.1 sub-indicator 8.1, 8.6, 8.7FAO, 2018b 10 Soil health SOCLA rapid and farmer friendly agroecological method to assess soil
health, based on 10 indicators
Nicholls et al., 2004
In order to aggregate the results for all 10 core criteria, a traffic light approach similar to the one used in other assessment methods is recommended with three levels: unsustainable (red), acceptable (yellow), and desirable (green). A proposal for the interpretation of results and possible thresholds used to define the three levels for each criteria are provided in
Supplementary Information.
Data collection for Step 2 should be conducted after Step 1 (CAET) or simultaneously if the enumerator is familiar with the questionnaire and can move easily between sections. Parts of the survey are conducted through interviews with the women in the household (women’s empowerment) and some data are collected disaggregated by sex (land tenure, dietary diversity, youth employment). Another part of the survey is conducted as a transect walk on the farm and surroundings (agrobiodiversity), which can also help to inform the core criteria and ground-truth the collected data (e.g., exposure to pesticides, secure land tenure, soil health). Each criterion is presented in detail in the following sub-sections. The suggested protocols and complete questionnaire for data collection can be found in
Supplementary information. Step 2 should take between 1 and
2 h to complete, depending on the size and complexity of the productive system.
The 10 core criteria do not aim at being exhaustive in assessing sustainability, for which more detailed and comprehensive frameworks already exist (cf. Table 1). Each criterion individually does not inform the whole dimension it addresses. Additionally, one criterion can address several dimensions. For example, secure land tenure is only one aspect of governance that
can support more sustainable food and agriculture systems. Other aspects of governance include existing policies (addressed in Step 0), access to genetic diversity (addressed by core criteria “agricultural biodiversity” under the main dimension environment) or to water, among others. Additional or advanced criteria may be added to the list depending on the context of the evaluation, the question to be answered by the research and/or the availability of methods and data. These may include water use (e.g., FAO, 2019b), greenhouse gas emissions (e.g.,
FAO, 2016a,b), decent employment (e.g., FAO, 2015a), and resilience to climate change (FAO, 2015b), thereby offering the enumerator or conductor of the research the ability to dive deeper into additional criteria of interest and to look for relationships between agroecology and other key attributes of agricultural systems.
Secure Land Tenure (or Secure Mobility for Pastoralists)
Equitable access to land and natural resources is key to social justice and gender equality, but also to providing incentives for the long-term investments that are necessary to protect soil, biodiversity and ecosystem services and increase resilience to system stressors. Agroecology is tied to the concept of food sovereignty (Pimbert, 2018), especially when it has been found to have significant political implications (Méndez et al., 2013). It aims to make producers autonomous and self-sufficient, and to define their own models of development. Agroecology plays a central role in rural social movements, particularly in the context of land redistribution. Therefore, it can be expected that in
regions where social movements are advocating for agroecology, the transition would be closely linked to a change in land tenure of farmers and/or secure mobility for pastoralists.
The criterion is based on the methodologies for SDG indicators 1.4.2, 2.4.1, and 5.a.1 (FAO, 2018b,c) which consider whether farmers have legal or secure claims to their land. It is completed with specific considerations for pastoralists, with data disaggregation for men and women. Specifically, it aims to measure legal and perceived rights to land by exploring the following aspects:
• Existence of legal recognition of access to land (mobility for pastoralists);
• Existence of formal document and presence of name on it; • Perception of security of access to land; and
• Existence of the right to sell, bequeath, and inherit land. Productivity
Measuring productivity provides information on the amount of resources necessary (i.e., production factors like land, capital and labor in classic economic terms, but also water or nutrients) to produce a given quantity or volume of product (Cochet, 2012; Sickles and Zelenyuk, 2019; Van der Ploeg et al., 2019). It is usually a measure of the relationship between the sum of all inputs and all outputs in physical terms (Timler et al., 2020). Improving the volume of production over time relative to the amount of inputs or resources used is an important aspect of performance. Improvements in agricultural productivity contribute to better food availability in a world with limited resources. They can also contribute to reduce environmental impacts of agriculture. While measuring productivity, it is important to consider the diversity of production systems and the need for accounting for all products and activities on farm.
The method proposed for measuring productivity with TAPE is the gross output value per hectare (based on SDG indicator 2.4.1 (FAO, 2018b) and in particular sub-Indicator 1) and the gross output value per person working within the productive system, in order to better account for productivity in extensive and often mobile systems such as pastoralism. This criterion therefore also informs SDG indicator 2.3.1 (Production per unit labor). The farm output corresponds to the total volume of agricultural output at farm level (crops, animals, trees, and animal products). Since the volume of agricultural outputs is not measured in commensurate units (e.g., not all outputs are measured in tons, and tons of different outputs represent different products), outputs are converted to monetary terms by multiplying them with the prices at the gate in local currency and converted to purchasing power parity (OECD, 2019). Alternatively, when dealing with farming systems specialized in food production, all outputs may be expressed as calories or grain equivalents or nutritional carrying capacity (number of people that can be fed per hectare with the available nutrient considered) (e.g., Timler et al., 2020). The farm agricultural land area is defined as the area of land used for agriculture within the farm (FAO and UNSD, 2012). The number of persons working on the farm is the total number of working persons, including family and paid labor, in full time equivalents.
Income
An important part of sustainability in agriculture is the economic viability of the system. This is driven to a large extent by profitability and the net income that the producer/household is able to earn from agricultural operations relative to the investment in land, labor and other assets. The profitability of the production system is one of the key measures on which many decisions are based and is considered a driver of agricultural policies.
Improving producers’ efficiency through the enhancement of biological processes and reduction of costs from external inputs can increase net income of producers and create more inclusive and innovative markets that reconnect producers and consumers in a circular and solidarity economy (Van der Ploeg et al., 2019). For example, adopting agroecological practices increased farm profitability in 66 percent of cases analyzed byD’Annolfo et al. (2017).
The method proposed is based on SDG indicator 2.4.1 (FAO, 2018c), and in particular the sub-Indicator 2 (Farm net income), and for SDG 2.3.2 (income of small-scale food producers) (FAO, 2019c) and on the evaluation of economic performance from
Levard et al. (2019). The family net agricultural income is calculated as follow:
Revenue from agricultural activities (quantity of crops, animals, animal products, and other activities sold multiplied by the price at the gate for these items):
+Subsidies
- Cost of inputs (seeds, fertilizers, pesticides, breeding stock, feed, veterinary products and services, energy)
- Taxes, cost of hired labor, interest on loans, cost of renting land and depreciation of machinery and equipment over time In this way, income is not a reflection of monetary availability only, because food that is produced and consumed by the household is also included. Similarly, special attention should be put on the value of inputs provided by the household, considering their opportunity cost. Moreover, a separated analysis should be done for the subsidies in order to analyze their relative importance in the total income of the family. The results should be converted into purchasing power parity (OECD, 2019). Value Added
While income is a basic indicator of how a system performs economically, it does not provide sufficient information on how a production system creates value for producers. As explained by
Van der Ploeg et al. (2019), value added is a central concept in agroecology because it contributes to income and is considered to be the gross value of production minus the costs of production. Agroecological producers seek to maximize the ratio between the value added and the gross value of production, rather than just trying to increase the gross value of production. From such a starting point, the logical guiding principle of conventional farming is to increase the total production realized per unit labor, which, in practice, translates into ongoing scale-enlargement and/or reducing labor input. On the contrary, agroecological farms tend to be more diversified than conventional ones, make labor in farming central, try to enhance as much as possible the
quality of internally available resources, and seek the balance between these and external inputs. Therefore, they tend to show higher levels of net added value.
The net value added of a productive system represents the creation of wealth obtained through the system itself (Levard et al., 2019). It is calculated by subtracting all the expenditures for inputs, the intermediate consumption, and the depreciation of machines and equipment from the gross value of the agricultural production. It excludes subsidies and does not deduct expenses related to taxes, hired labor and renting land or interests on loans, which makes it a distinct criterion from income. For example, producers in situations of high debts may have a low income because of high interest they have to pay every year but they may still generate important added value from their system. It is calculated as follow:
Gross output value of the agricultural production
- Cost of inputs (seeds, fertilizers, pesticides, breeding stock, feed, veterinary products and services, energy)
- Depreciation of machinery and equipment over time.
Exposure to Pesticides
Synthetic pesticides are extensively used in crop production to control harmful pests and prevent crop yield losses or product damage. Because of negative biological activity and, in certain cases, long persistence in the environment, synthetic pesticides can cause undesirable effects to human health and to the environment - soil, water, flora and fauna (World Health Organization, 2020). Producers and agricultural workers can be routinely exposed to high levels of pesticides, at usually a much greater rate than consumers (Praneetvatakul et al., 2013; Lekei et al., 2014; Gangemi et al., 2016). Producers’ exposure mainly occurs during the preparation and application of the pesticide and during the cleaning-up of application equipment. Producers who mix, load, and apply pesticides can be exposed to these chemicals due to spills and splashes, direct contact as a result of faulty or missing protective equipment, or even drift. However, producers can be exposed to pesticides even when performing activities not directly related to pesticide use, e.g., producers who perform manual labor in areas treated with pesticides can face major exposure from direct spray, drift from neighboring fields, or by contact with pesticide residues on the crop or soil. This kind of exposure is often underestimated.
Producers’ exposure to pesticides can be reduced through the elimination of the use of Highly Hazardous Pesticides (World Health Organization, 2010) and the correct use of the appropriate type of personal protective equipment in all stages of handling regulated pesticides and, overall, through reduced use of pesticides. Both men and women should be provided with this information and with the appropriate equipment and measures to reduce risks to their health (Waichman et al., 2007). Agroecology promotes different measures to reduce pesticide use, such as biological control, the integrated management of pests based on ecosystem approaches, the use of cover crops to reduce weed infestation, the integration of animals to remove weeds and/or pests etc. A fundamental measure of the benefits
of agroecology is therefore the degree to which it reduces the use of harmful, and often costly, pesticides.
The proposed method is based on the sub-indicator 7 of SDG 2.4.1 (management of pesticides) (FAO, 2018b), and more specifically on the quantity of bio-pesticides and synthetic pesticides applied, their level of toxicity (highly/moderately/slightly, according to Damalas and Koutroubas, 2016) and the existence of mitigation techniques (e.g., use of protection before and after spraying, signaling the sprayed areas) when applying the pesticides and for other people living and working around the interested area (Ross et al., 2015). The implementation of practices for the ecological management of pests that can substantially reduce the need of chemicals are also incorporated (PAN, 2015). More specifically, the recommended desirable score for this criteria corresponds to using organic pesticides and not using highly and moderately toxic synthetic pesticides, while using at least 4 mitigation techniques if synthetic fertilizers of low toxicity are used (see
Supplementary information).
Dietary Diversity
Today, there are still gaps in nutrient supply in some regions of the world, especially for nutrient-dense food groups (Herrero et al., 2017). To address the imbalances in our food systems and move toward a zero-hunger world addressing all forms of malnutrition (hunger, micro-nutrient deficiencies and obesity), increasing production alone is not sufficient. Re-balancing food habits, promoting diverse and healthy food production and consumption, and supporting the right to adequate food are all elements of an agroecological transition (FAO, 2018a). For example, species richness on farm, one measure of biodiversity, has been found to be highly correlated with micronutrient adequacy in human diets (Lachat et al., 2018).
Obtaining detailed data on household food access or individual dietary intake can be time consuming and expensive. It requires a high level of technical skill both in data collection and analysis. Dietary diversity is a qualitative measure of food consumption that reflects household access to a variety of foods and is also a proxy for nutrient adequacy of the diet of individuals. The index proposed for TAPE is the Minimum Dietary Diversity for Women (FAO and FHI 360, 2016). Because women often prioritorize the nutrition of other family members, especially children, and there is evidence showing the association between maternal and child diversity (Nguyen et al., 2013), they can be considered as a proxy for the nutritional status of individuals within the household.
The dietary diversity score consists of a simple count of how many food groups were included in the food consumed over the preceding 24 h. Foods are grouped in the following 10 groups: grains, white roots, tubers, and plantains; pulses (beans, peas, and lentils); nuts and seeds; milk and dairy products; meat (red), poultry, fish; eggs; dark green leafy vegetables; other vitamin A-rich fruits and vegetables; other vegetables; other fruits. These groups are standardized and are of universal applicability; as such they are not culture-, population-, or location-specific and can be collected in a gender-disaggregated manner in a short amount of time.
Women’s Empowerment
Women contribute ∼43% of all agricultural labor in low and middle-income countries (FAO and ADB, 2013). They also play a vital role in household food security, dietary diversity and health, as well as in the conservation and sustainable use of biological diversity (especially in regard to conservation and management of seeds, in building resilient livelihoods and in transforming food systems. But in spite of this, they face persistent obstacles, economic constraints, and remain economically marginalized and vulnerable to violations of their rights, while their contributions often remain unrecognized. For example, in a study by Smith and Haddad (2015), food quantity only accounted for an estimated 18% of reduced stunting, food quality contributed 15% and women’s education contributed 22% to the total reduction in stunting.
Women tend to have poorer access to productive assets, such as land, capital, inputs, technology, information and services. Therefore, their decision-making capacity remains limited, including in community decisions over natural resources. For example, in sub-Saharan Africa, agricultural productivity levels of female farmers are between 20 and 30% lower than those of male farmers, because of the gender gap in access to resources (FAO, 2011). Gender inequity in Malawi, for example is persistent in terms of access to extension, land and credit, despite women making up a significant proportion of the agricultural labor (Place and Otsuka, 2001; Farnworth and Colverson, 2016; Deininger et al., 2017). Globally, rural women experience poverty and exclusion disproportionately, and fare worse than rural men as well as urban women and men on every gender-sensitive indicator for which data are available. Women and girls also face a higher risk of undernourishment (FAO, 2020). Addressing pervasive gender inequality will generate multiple benefits in terms of food security and poverty alleviation, especially for the family unit (FAO, 2017a).
Through agroecological approaches, women can develop higher levels of autonomy by building knowledge, through collective action and creating opportunities for commercialization, and enhancing their negotiation and leadership skills (Oliver, 2016; Kerr et al., 2019b; Michalscheck et al., 2020). Opening spaces for women and girls to become more autonomous can empower them at household, community levels and beyond —for instance, through participation in producer groups, and increasing their access to agricultural services and rural institutions (FAO, 2018a).
The Women’s Empowerment in Agriculture Index (WEAI) is a survey-based index designed to measure the empowerment, agency, and inclusion of women in the agricultural sector (IFPRI, 2012). The WEAI has been used extensively since 2012 by a variety of organizations to assess the state of empowerment and gender parity in agriculture, to identify key areas in which empowerment needs to be strengthened, and to track progress over time. The methodology proposed for TAPE is an adaptation of the Abbreviated version of the Women’s Empowerment in Agriculture Index (A-WEAI) (IFPRI, 2015), which measures the roles and extent of women’s engagement in the agriculture sector in five domains of empowerment:
(1) decisions about agricultural production, (2) access to and decision making power over productive resources, (3) control over use of income, (4) leadership in the community, and (5) time use. The questionnaires is completed with the main female in the household and it also measures women’s empowerment relative to men within their households, by providing answers to questions about decision making or asset management such as “Myself or both my husband and I” or “My husband or someone else.”
Youth Employment Opportunities
In many countries, rural youth face a crisis of employment. Globally, some 620 million young people are neither working nor studying, and 1.5 billion are working in agriculture and in self-employment (World Bank, 2013). About 37% of migrants are below 30 years old (UNDESA, 2019). High rates of unemployment and underemployment are among the root causes of distress out-migration from rural areas (FAO, 2016c). In Africa, 325 million young people (from 15 to 24 years old) will be looking for jobs by 2050 (Christiaensen, 2020).
Approaches to agriculture that are based on knowledge and skilled labor, such as agroecology, can provide a promising solution as a source of decent jobs, by offering rural employment and opportunities that meet the aspirations of rural youth and contribute to decent work (FAO, 2018a). For example,
Dorin (2017)showed that innovations requiring investments that save labor may not be seen as desirable where labor is more readily available than monetary resources, making labor-saving technologies less advantageous.
A common indicator for measuring the creation of decent jobs for youth in rural areas has not been established yet. The method proposed for TAPE is an index similar to SDG indicator 8.6.1 (ILO., 2018) and based on the proportion of youth (aged 15–24 years) in the household enrolled in education, employment or training and the proportion of young people who have migrated or that wish to migrate. To the extent possible, the collection of this data should be sex-disaggregated to better highlight the differences between boys and girls of different ages (e.g.,Michalscheck et al., 2018). Scores and weights to aggregate all indicators into one score are provided in
Supplementary information.
Agricultural Biodiversity
Biodiversity for food and agriculture includes the domesticated plants and animals raised in crop, livestock, forest and aquaculture systems, harvested forest and aquatic species, the wild relatives of domesticated species, other wild species harvested for food and other products, and what is known as “associated biodiversity,” the vast range of organisms that live in and around food and agricultural production systems, sustaining them and contributing to their output (FAO, 2019d). Meeting the challenges of climate change, improving nutrition and health, and achieving a transformation toward more sustainable and equitable production systems all require the conservation of agricultural biodiversity.
Areas of the world with higher agricultural diversity produce more nutrients (Herrero et al., 2017). Very small, small and
medium-sized farms, found mostly in traditional and mixed production systems, produce more food and nutrients in the most populous (and food insecure) regions of the world than large farms in modern food systems (Pengue and Gemmill-Herren, 2018). In addition, 5 billion people are estimated to live in traditional and mixed food systems relying on a diversity of plants, animals and activities, which is about 70% of the world’s population (Ericksen, 2008; UNEP, 2016; HLPE, 2017; Pengue and Gemmill-Herren, 2018). Numerous studies have found a positive relationship between diversified farming systems and human nutritional outcomes for smallholder farms (Jones et al., 2014; Powell et al., 2015; Bellon et al., 2016; Demeke et al., 2017). Mixed crop-livestock farming systems that occur in all agro-ecological zones, are estimated to cover 2.5 billion hectares globally, and to produce 90% of the world’s milk supply and 80% of the meat from ruminants (Herrero et al., 2013).
Various elaborated methods to assess agricultural biodiversity were developed in different contexts (Teillard et al., 2016; Leyva and Lores, 2018; PAR, 2018; BI, 2019). The proposed methodology follows the approach of sub indicator 8.1, 8.6, and 8.7 of SDG indicator 2.4.1 (FAO, 2018b, which rely on an inventory of all species, varieties, and breeds used. The proposed methodology corresponds to a composite indicator taking into account the diversity of species, varieties and breeds and their relative importance. It is based on a Gini-Simpson index of diversity for crops (including cultivated trees) and animals, and on an index assessing the presence of natural vegetation, trees, pollinators, and other beneficial animals. The data are collected during a transect walk on the farm during the survey. The Gini-Simpson index of diversity is calculated with the following formula:
1 − D = 1 − 6 p2i
in which pi is the relative importance of each variety or breed
used for production (also called abundance) and i the proportion of agricultural land (or number of animals) found in the ith species. D is subtracted to 1 in order to have 100% as the highest diversity score and 0 as the lowest.
More information on how to calculate the proportions of each crop variety and livestock breed, and how to include pollinators and natural vegetation is available in the
Supplementary Information.
Soil Health
Soil underpins agricultural output and ecosystem functioning. Sustaining the quantity and quality of organic matter in agricultural soils is a key element of sustainability in agriculture (FAO, 2017b). Soil health includes the stabilization of soil structure, the maintenance of soil life and biodiversity, retention and release of plant nutrients and maintenance of water-holding capacity, thus making it a key criterion not only for agricultural productivity but also for environmental resilience (FAO, 2005).
A number of practices used in agroecological systems can contribute to improving soil health, for example, minimal mechanical soil disturbance, organic fertilization from animal manure or compost, permanent soil cover (organic matter
supply and thus increase in water retention capacity through the preservation of crop residues and cover crops or animal manure), crop rotation for biocontrol and efficient use of the soil profile, rotational grazing management, and minimal soil compaction.
Several methodologies for assessing soil health have been developed, some more sophisticated (e.g., Pheap et al., 2019; Thoumazeau et al., 2019), and others more farmer friendly (UTT, 2014; MAONIC, 2019). The method proposed was developed inNicholls et al. (2004)and then disseminated by the Sociedad Científica Latinoamericana de Agroecología (SOCLA). The 10 proposed soil health indicators can be applied and interpreted jointly by farmers and researchers. The method is conducted at the same time as the transect walk for assessing agricultural biodiversity. The SOCLA 10 indicators of soil health are: soil structure; degree of compaction; soil depth; status of residues; color, odor, and organic matter; water retention; soil cover; signs of soil erosion; presence of invertebrates; and microbiological activity.
Each indicator is valued separately, and a value is assigned between 1 and 5, according to the attributes observed in the soil (one being the least desirable value, three a moderate or threshold value and 5 the most preferred value). Every indicator is provided with a description for supporting the evaluator. For instance, in the case of the indicator of soil structure, a value of 1 is given to a “dusty soil, without visible aggregates,” a value of 3 to a “soil with some granular structure whose aggregates are easily broken under soft finger pressure,” and a value of 5 to a “well-structured soil whose aggregates maintain a fixed shape even after exerting soft pressure.” The details of the descriptions of the 10 indicators are provided in Supplementary Information. Once all soil indicators are assessed, individual indicators can be presented in a radar type graph or an average score of soil health can be calculated.
Step 3—Participatory Analysis of Results
The diagnostic based on the 10 Elements of agroecology (Step 1) and the analysis of performance based on the core criteria (Step 2) are used to reveal the strengths and weaknesses of the systems assessed and to explain their performance in the context of the enabling environment from Step 0. For example, a system with high synergies between plants and animals and high levels of recycling in Step 1 may still perform poorly in terms of income (Step 2) if it has limited access to markets (Step 1 “Circular and solidarity economy” and Step 0).
Step 3 should be conducted in a participatory manner with the community or territory identified in Step 0 and in which the farm surveys were conducted in order to (1) verify the adequacy and performance of the framework; (2) confirm/interpret the analysis to make it context-relevant (including the sampling and up-scaling from farm to territory and to adjust the thresholds used on Step 2 for the traffic light approach); and (3) design/discuss possible ways forward to enhance the enabling environment and support the transition, potentially utilizing the tool to monitor progress. This step can also include the following points to contextualize the interpretation of results:
• The review of CAET results (Step 1) and a proposal for weighting the various indices within each element to emphasize critical aspects in the analysis to ensure contextualized relevance;
• The review of the performance criteria results (Step 2) and a review of the thresholds applied to each of the criteria for the “traffic light” approach;
• The review of the aggregation of farm/production unit level results for an analysis at territorial level as well as of the sampling method chosen.
PRELIMINARY RESULTS
TAPE is being piloted in several geographic regions and production systems in order to assess its relevance and validate the underlying methodological choices. Further data consolidation and data collection to populate the global database are needed but several conclusions can already be drawn from these pilot studies. Here we take some of these ongoing efforts in the field to illustrate two possible applications of TAPE: (1) assessing the degree of agroecological transition in a given territory (for example to assess the impact of a policy or a project) and (2) evaluating the multi-dimensional performance of agroecological farms (e.g., to compare farming systems across regions or territories). These two types of application are not exhaustive. TAPE can be applied to reach different objectives, including, for example, for project formulation or corporate assessments in private companies, and more results will be available as pilots are completed. More lessons learnt will also be available after completion of Step 3 (participatory validation of results), as well as more insights on possible weightings of elements and indices in Step 1 and thresholds for the traffic light approach in Step 2.
Assessing Agroecological Transitions
Figure 3A shows the application of the Step 1 of TAPE
to assess the degree of agroecological transition in a family farm in Cuba, comparing three stages: conventional monoculture of tobacco; intermediate transition status with increased diversity in production, synergies within the agroecosystem and use of self-produced inputs; and the last stage of this transition. Results presented in Lucantoni (2020) show that the transition, supported by a specific public policy, had positive impacts on food security, income, biodiversity, soil health, youth employment, and exposure to pesticides.
Figure 3B shows the application of Step 1 of TAPE to
a smallholder farm in Central Angola, before and after the implementation of a 4-year project aimed to improve producers’ livelihoods and nutrition by reducing dependence on synthetic fertilizers, improving soil health and reintroducing animals in the agroecosystem. The CAET spider charts show that average scores for the 10 Elements have all improved, ranging between 10 and 30% before the project and between 30 and 50% after the project. This illustrates how TAPE can be used for project monitoring and evaluation.
Results from the application of Step 1 and 1bis (typology) in 25 farms in Patagonia (Argentina) show that mixed crop-livestock systems have a higher level of diversity, synergies and resilience (Figure 3C). Mixed and crop production systems score better in terms of circular and solidarity economy due to better connection with short value chains. Farms specialized in livestock production show higher average scores in recycling but lower in co-creation and sharing of knowledge, because these systems are normally situated further from urban areas, with less organizations for local support and hence limited access to new agroecological knowledge (Álvarez et al., 2019; De Pascuale Bovi et al., 2019). Almost all the farms were already engaged in an agroecological transition even though the environment was not favorable. These results showed the role of local cultural heritage and traditional management practices for agroecological transitions, especially in the absence of specific support for agroecology.
Evaluating the Multi-Dimensional
Performance of Agroecological Farms
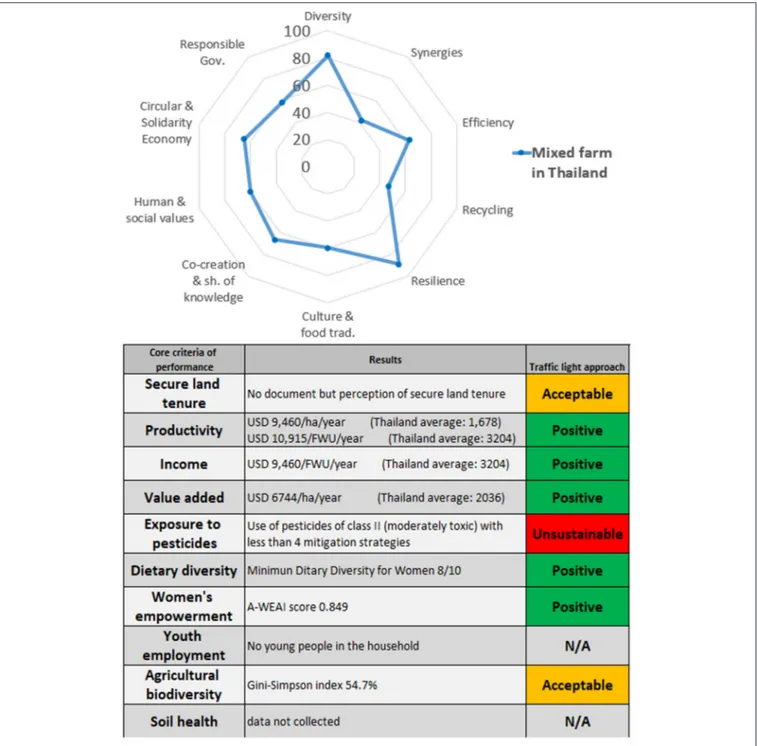
Steps 1 and 2 were applied to an integrated farm in Thailand. Results in Figure 4 show that the high level of diversity (rice, vegetables and fish production as well as its activity as a training center), together with the relatively high score in circular economy (e.g., products sold directly to neighboring households through social media), explain the high level of productivity but also of income and added value compared to the country average. However, limited synergies and recycling were found between the different sub-systems, which explains the relatively low score in agricultural biodiversity (significant share of the farmland is in rice monocropping) as well as the high exposure to pesticides.
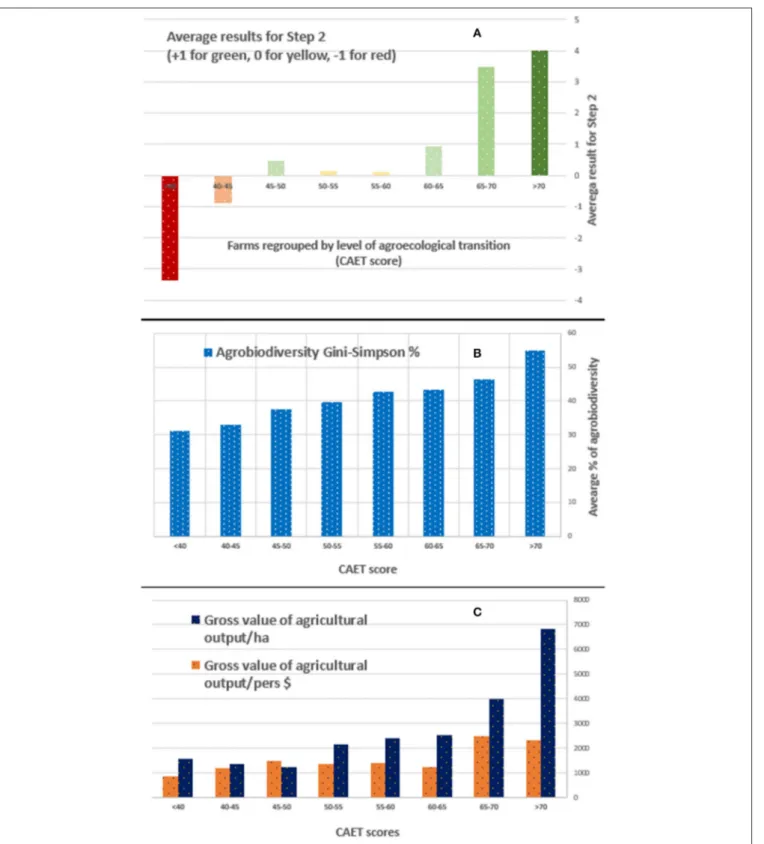
Steps 1 and 2 were also applied to 228 farms in Cambodia. Preliminary results show that higher average scores in Step 1 (CAET) are linked to more positive results from Step 2 (Figure 5A). Step 2 results are presented using the traffic light approach where green scores +1, red −1 and yellow 0, for a total ranging from 10 to −10 (y axis). Figure 5B shows that productivity per hectare and per person seems to be higher for farms with higher scores in Step 1 (i.e., those that are further in their transition to agroecology based on the 10 elements). Figure 5C shows the same trend for agrobiodiversity. Such results illustrate the strong coherence between the two steps of the method and the coherence of the 10 Elements of agroecology in order to achieve a sustainable production. Logical links between the 10 elements of Step 1 and the 10 criteria of Step 2 also contribute to explain these results. Deeper analysis as recommended for Step 3 (participatory interpretation of results) is needed to clarify.
DISCUSSION
Building on existing indicators and sustainability evaluation frameworks, and capitalizing on the experience of a vast network of participating organizations worldwide, the Tool for Agroecological Performance Evaluation (TAPE) is presented as a simple, operable, yet comprehensive quali-quantitaive approach
FIGURE 3 | Results of the CAET (Step 1) from (A) a family farm in western Cuba at different stages transitioning to agroecology (Lucantoni, 2020); (B) a smallholder farm of Central Angola, before and after a project for sustainable rural development and improved nutrition and (C) 25 farms in Patagonia (Argentina) after using the Step 1-bis Transition Typology (Álvarez et al., 2019).
to assess the degree of transition of farms and communities to agroecology, and measure their impact on key attributes of systems necessary to the achievement of the UN Sustainable Development Goals (SDGs): a healthy environment, people’s health and nutrition, societal and cultural values, economic development and sound governance systems.
The application of TAPE will generate harmonized and global evidence, whether from new data collection or from existing datasets revisited with or completed for TAPE. This global database, available on a United Nations server, will be used by FAO and partners to develop a number of studies and recommendations for policy makers at various scales of
FIGURE 4 | Results of Step 1 and Step 2 applied to a farm in Thailand.
aggregation. The intention is to further this research agenda by beginning to provide data on (i) the characterization of agroecological transitions (CAET, Step 1) and (ii) the contribution of such transitioning farms to more sustainable food and agriculture systems (Step 2) and being able to connect these data with inferences about the enabling contextual environment defined in Step 0. This will allow addressing questions such as how many farms are engaged in an agroecological transition; how far have they progressed in the transition; what are the
combinations of practices that are most common; are there regional, territorial clusters that can be linked to economic, social and environmental impacts at national and regional scales?—all relevant questions for baseline characterization and monitoring and evaluation of the impact of national or regional policies designed to enable agroecological transitions. The geospatial data that is collected through TAPE could be linked to existing national and international datasets and eventually be integrated into participatory foresight models (Cradock-Henry et al., 2020)
FIGURE 5 | TAPE results from 228 farms in Cambodia. (A) Average score from the traffic light approach (Step 2) per quintiles of CAET (Step 1). (B) Average Gini-Simpson index for agricultural biodiversity (Step 2) per CAET quintiles (Step 1). (C) Average gross value of production per hectare and per person (from Step 2) by CAET quintiles (Step 1).
that are increasingly being used for policy making. The original contribution of TAPE in this regard is that it can be applied to all types of production systems and territories, which means that
through progressive data collection, we will begin to be able to visualize these transitions as they unfold over time and help direct producers and policy makers toward sustainability.