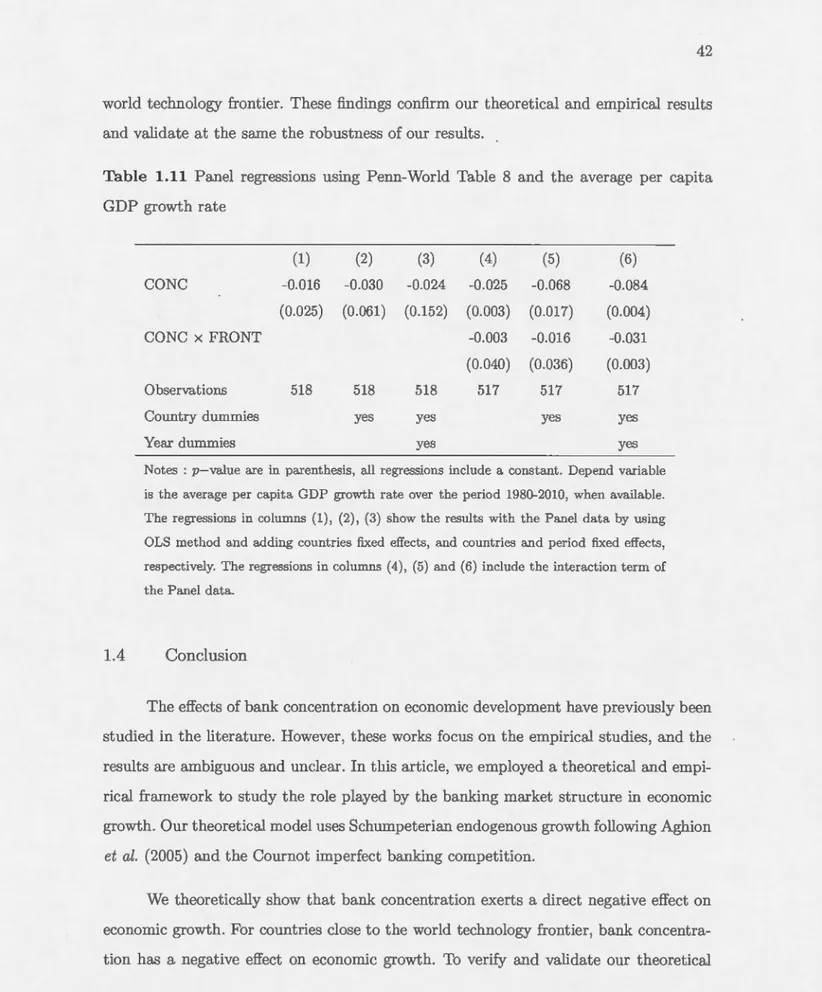
UNIVERSITÉ DU QUÉBEC
À
MO TRÉALTHE ROLE OF THE BANKil G SECTOR A D FI A TCIAL MARKETS ON
ECO OMIC DEVELOPMENT
THESIS PRESENTED
AS PARTIAL REQUIREME T FOR THE PH.D IN ECONOMICS
BY
BOUBACAR SIDDY DIALLO
UNIVERSITÉ DU QUÉBEC À MONTRÉAL Service des bibliothèques
Avertissement
La diffusion de cette thèse se fait dans le respect des droits de son auteur, qui a signé le formulaire Autorisation de reproduire et de diffuser un travail de recherche de cycles supérieurs (SDU-522 - Rév.01-2006). Cette autorisation stipule que «conformément à l'article 11 du Règlement no 8 des études de cycles supérieurs, [l'auteur] concède à l'Université du Québec à Montréal une licence non exclusive d'utilisation et de publication de la totalité ou d'une partie importante de [son] travail de recherche pour des fins pédagogiques et non commerciales. Plus précisément, [l'auteur] autorise l'Université du Québec à Montréal à reproduire, diffuser, prêter, distribuer ou vendre des copies de [son] travail de recherche à des fins non commerciales sur quelque support que ce soit, y compris l'Internet. Cette licence et cette autorisation n'entraînent pas une renonciation de [la] part [de l'auteur] à [ses] droits moraux ni à [ses] droits de propriété intellectuelle. Sauf entente contraire, [l'auteur] conserve la liberté de diffuser et de commercialiser ou non ce travail dont [il] possède un exemplaire.»
UNIVERSITÉ DU QUÉBEC À MO TRÉAL
LE RÔLE DU SYSTÈME BA CAIRE ET DES MARCHÉS FINANCIERS DANS LE DÉVELOPPEME
T
T
ÉCONOMIQUETHÈSE PRÉSENTÉE
COMME EXIGENCE PARTIELLE DU DOCTORAT EN ÉCONOMIQUE
PAR
BOUBACAR SIDDY DIALLO
REMERCIEME ITS
Mes remerciements vont à Dieu pour m'avoir accordé anté et force nécessaires pour mener à bien cette thèse. Je tiens à remercier chaleureu ement mon directeur de recherche, Wilfried Koch, PhD. Il a été pour moi un soutien indéfectible durant le long processus d'élaboration de cette thèse tant sm le plan psychologique, éducatif que financier. Sa rigueur et sa méthodologie d'encadrement ont été les leçons de toute une vie. J'ai appris à ses côtés comment initier une recherche et surtout à développer les qualités d'un bon chercheur. Je le remercie de façon particulière pom la confiance et le soutien qu'il m'a généreu ement offerts et je lui suis infuüment reconnaissant de m'avoir poussé sans relâche dan.· la voie de la précision et du travail bien fait durant la rédaction de cette thèse. Mes sincères remerciements vont aux professeurs et membres du jmy : Louis Phaneuf, Benoit Carmichael et Pavel Sevcik pour leur. commentaire pertinents qui m'ont permis d'augmenter la valeur ajoutée de la thèse.
Cette thèse a été également rendue à terme grâce au soutien de ma famille : ma mère, mon père, et mon épou e. Cette dernière a été constamment là pour m'encomager et me outenir pendant les périodes difficiles. Mes pensées vont également à mon oncle asser qui a nous quitté en début d'année, ainsi que mes trois frères, Mouctar, Yacine et El. Hadj.
Je remercie tout le corps professoral du département des Sciences économiques. J adresse, plus particulièrement, mes sincères remerciements aux profe eurs Kristian Behrens, Claude Fluet, Steve Ambler Douglas Hodgson, et Max Blouin.
Je remercie Mesdames : Martine Boisselle, Germain Francine, Julie Hudon, Lor-raine Brisson, Jasée Parenteau, et Jacinthe Lalande pour leur disponibilité et leur aide durant mon doctorat. Merci également au CIRPÉE et au d 'partement d s Sciences
IV
économiques pom le soutien financier dont j'ai pu bénéficier dès la premièrere année de mon doctorat.
En terminant, je ne manquerai pas de remercier mes amis Ndack Kane, Yorou Tchaka.ndo, Sêgnon Aguey, Ibrahima Berté, Salah Eddine El Omal'i et Thiémokho Diop pour tous les bons moments passés ensemble et les débats passionnants que nous avons eus durant toute la période doctorale, ainsi que mes amis Isabelle Harrisson, Jeffrey l'vfalecki et Hassatou Diallo pour la relecture.
TABLE OF COI TENTS
LIST OF TABLES vu
ABSTRACT . . xi
INTRODUCTIO 1
CHAPTER I
BANK CONCENTRATION AND SCHUMPETERIAN GROWTI-I: THEORY
AND INTERNATIONAL EVIDENCE 8
1.1 Introduction . . . . . . 9
1.2 Theoretical framework 14
1.2.1 A simple Schumpeterian theoretical framework 1.2.2 Banking sector . . . .. .. .
1.2.3 Dynamics and bank concentration
14
17
22 1.3 Bank concentration and convergence : Cross-country and panel evidence 231.3.1 Specification and data . .. .. . 1.3.2 Cross-country regression results . 1.3.3 Panel results . . .
1.3.4 Robustness checks 1.4 Conclusion . . . . CHAPTER II
BANKING REFORMS, DISTA CE TO FRONTIER AND GROWTH: THEORY 23 28 31 35 42 AND EVIDENCE 53 2.1 Introduction. 2.2 Theoretical Framework .
2.2.1 A simple Schumpeterian theoretical framework 2.2.2 Banking Sector ..
2.2.3 Innovation Sector .
2.2.4 Equilibrium and the number of banks with free entry 2.2.5 Dynamics and banking reforms . . . .. . .
54 60 60 63 66 67 69
Vl
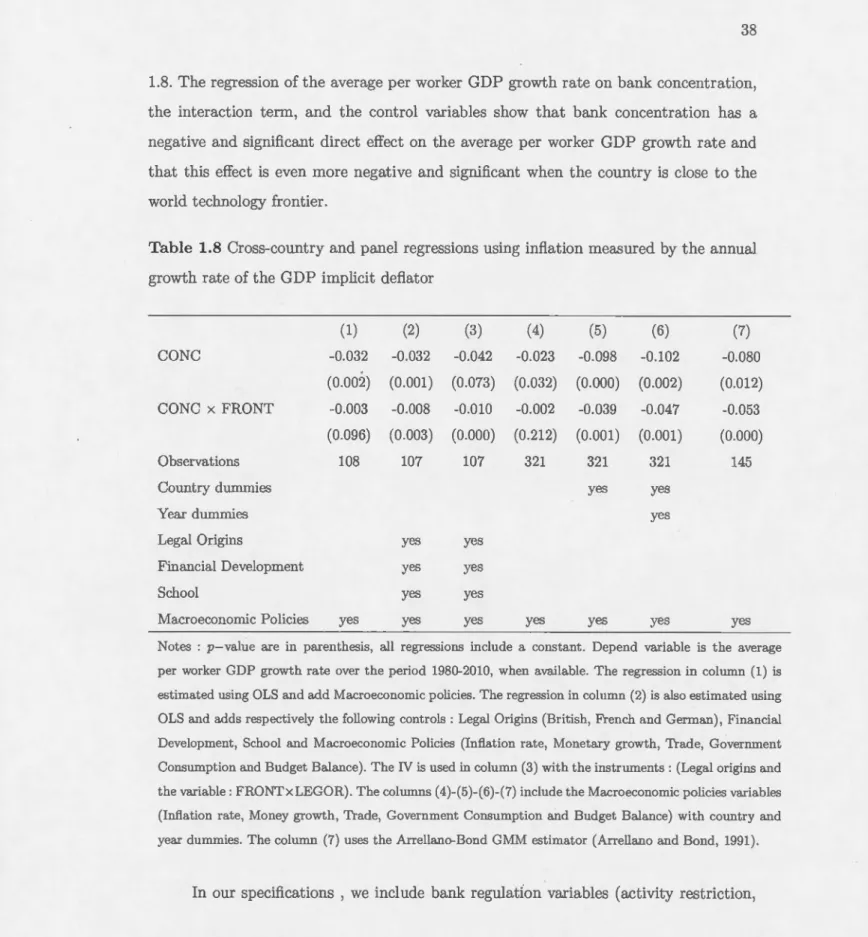
2.3 Methodology and Empirical Evidence 70
2.3.1 Data . 70 2.3.2 Cross-country Evidence 74 2.3.3 Panel Evidence . "78 2.3.4 Robustness checks 84 2.4 Conclusion 91 CHAPTER III
FIN AN CIAL DEPENDE TCE A D GROWTH DURING CRISES: WI-IEN DOES
BANK EFFICIENCY REALLY MATTER? 94
3.1 Introduction. . . . . . . 95
3.2 Methodology and Data. 98
3.3 Results . . . . . . . 104
3.4 Concluding remarks 120
LIST OF TABLES
Tableau Page
1.1 Descriptive statistics 25
1.2 Correlations Matrix 27
1.3 Cross-country regres ions 30
1.4 Panel regressions without control variables . 32
1.5 Panel regressions \vith control variables 34
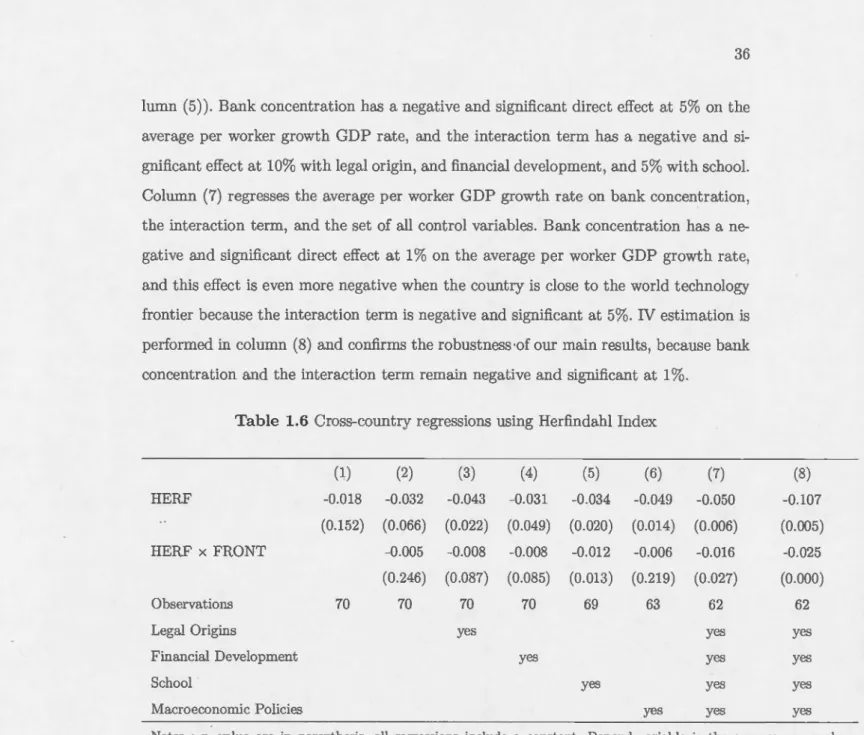
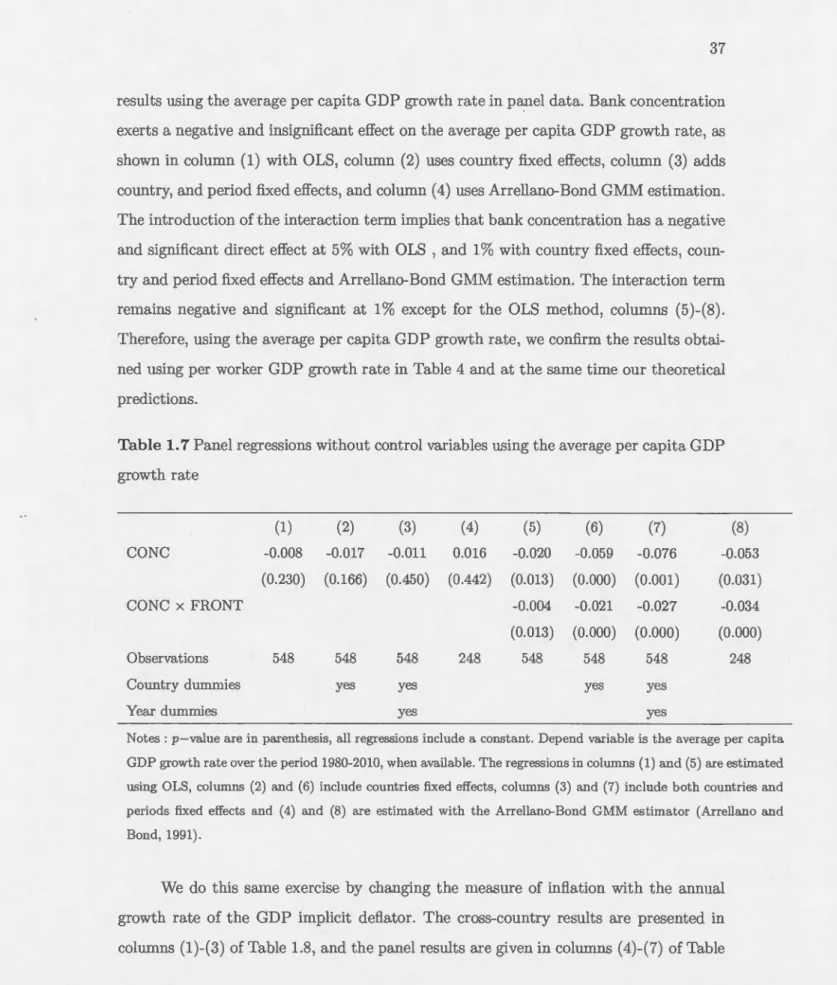
1.6 Cross-country regressions using Herfindahl Index 36 1.7 Panel regressions without control variables using the average per capita
GDP growth rate . . . . . . . . . . . . . . . . . . . . . . . . . 37 1.8 Cross-country and panel regressions using inflation measured by the
an-nuai growth rate of the GDP implicit defiator 38
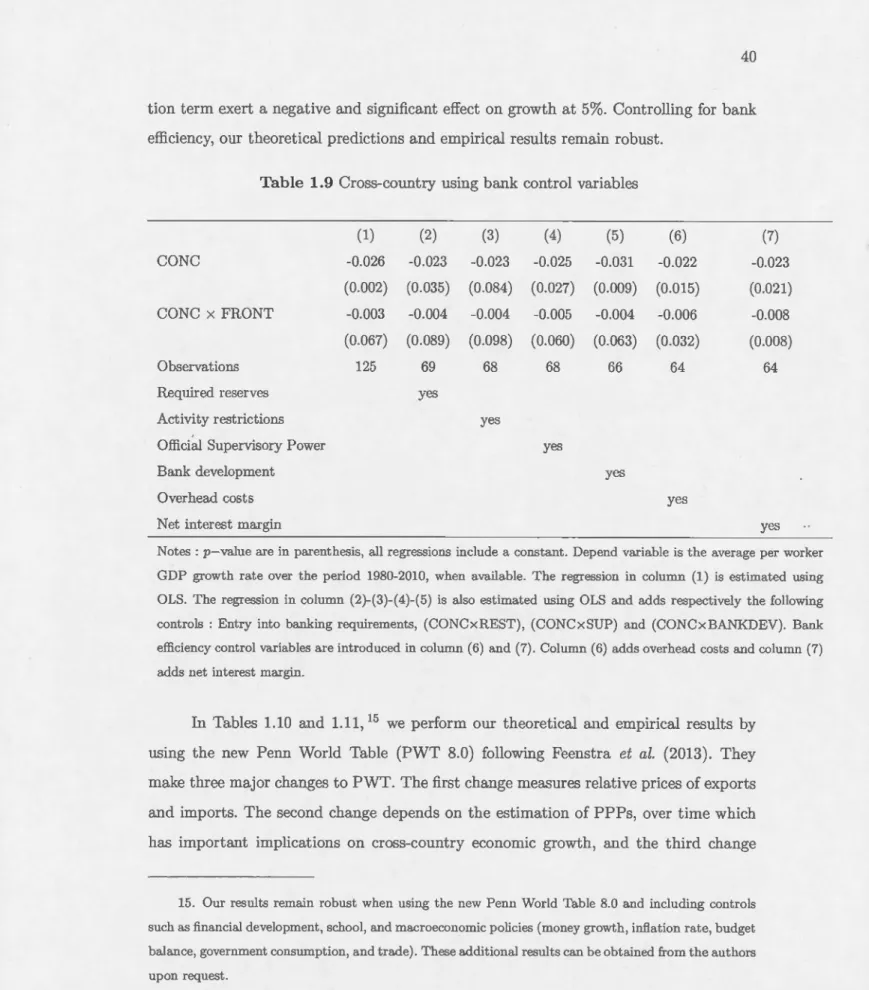
1.9 Cross-country using bank control variables 40
1.10 Panel regressions using Penn-World Table 8 and the average per worker GDP growth rate . . . . . . . . . . . . . . . . . . . . . . . . . . . 41 1.11 Panel regressions using Penn-\Vorld Table 8 and the average per capita
GDP growth rate . . 42
2.1 Descriptive statistics 71
2.2 Correlations 1\ilatrix 73
2.3 Banking Reforms, Distance to F'rontier and Growth using Cross-country analysis . . . . . . . . . . . . . . . . . . . . . . . . . . . . 77 2.4 Banking reforms, Distance to Frontier and Growth using panel
specifica-tions with control variables . . . . . . . . . . . . . . . . . . . . . . 80 2.5 Banking reforms, Distance to Frontier and Growth using panel
specifica-tions with control variables . . . . . . . . . . . . . . . . . . . 83 2.6 Banking Reforms, Distance to Frontier and Growth using Cross-country
Vlll
2.7 Banking Reform , Distance to Frontier and Growth using panel data and excluding OECD countries . . . . . . . . . . . . . . . . . . . . . . . . 88 2.8 Banking Reforms, Distance to Frontier and Growth using Cross-country
analysis using GDP per capita 90
2.9 Numerical solutions 93
3.1 Summary statistics . 103
3.2 Summary statistics continued 104
3.3 Financial dependence, growth, bank efficiency, financial development and bank concentration as controls . . . . . . . . . . . . . . . . . . . . . 106 3.4 Financial dependence, growth, banking efficiency and bank competition,
supervision as controls . . . . . . . . . . . . . . . . . . . . . . . . . . 109 3.5 Financial dependence, growth, bank efficiency and macroeconomie va
-riables as controls . . . . . . . . . . . . . . . . . . . . . . . . . 112 3.6 Financial dependence, growth, bank efficiency and govenunent
interven-tions as controls . . . . . . . . . . . . . . . . . . . . . . . . . . . . . 114 3.7 Financial dependence, growth bank efficiency and banking crises as coi1trolsll6 3.8 Financial dependence, growth and bank efficiency using weighted least
squares and rank order, growth opportunities and bank size and
capita-lization . . . . . . . . 119
3.9 Bank efficiency scores. 124
3.10 Bank efficiency scores. 125
3.11 External financial dependence 1980-1989 across U.S. industries. 126 3.12 External financial dependence 1980-1989 across U.S. industries. 127
lX
RÉSUMÉ
Cette thèse étudie le rôle du ·ystème bancaire et des marchés financiers dans le développement économique. Elle e t constituée de trois articles cientifiques :
Le premier article utilise un modèle de croissance endogène du type Schumpétérien et un marché bancaire évoluant dans un environnement de concurrence imparfaite à la Cournot. ous montrons que la concentration bancaire a un effet négatif sur la croissance économique. De plus, cet effet est d'autant plu négatif pour les pays proches de la frontière technologique mondiale. Pour valider nos résultats théoriques nous utilisons des estimations économétriques avec des données en coupe transversale et en panel pour un ensemble de 125 pays sur la période 1980-2010. Nous montrons que la concentration bancaire diminue le taux de croissance annuel moyen du PIB par travailleur. Cet effet est d'autant plus négatif pour les pays proches de la frontière teclmologique mondiale. Nos résultats empiriques sont robustes à 1 utilisation du taux de croissance annuel moyen du PIB par tête et à l'introduction de variables macroéconomiques (taux d'inflation, taux de croissance de la masse monétaire, balance budgétaire, dépenses gouvernementales, et commerce), éducation, crédits privés et origines légales comme contrôles.
Dans notre econd article de thè e, nou endogéneisons le nombre de banques. Pour cela, nous utilisons un modèle bancaire en concurrence bancaire imparfaite avec différenciation horizontale à la Salop (1979). Ce modèle nous permet ensuite d'étudier les effets des réformes bancaires sur la croissance économique. Les réformes bancaires sont mesurées par les coûts de transports qui séparent une banque et un entrepre -neur représentatif. À l'aide de la libre entrée dans le secteur bancaire, nous montrons que effets des réformes bancaires sur la croissance économique dépendent du niveau du développement économique. Plus sp 'cifiquement, nous montrons à l'aide des institutions dites appropriées, qu'il existe un seuil de développement économique à partir duquel les réformes bancaires sont bénéfiques pour la croissance économique. Ainsi, les réformes bancaires ont un effet positif sur la croissance économique pour les pays proches de la frontière technologique mondiale. Pour valider nos prédictions théoriques, nous
effec-x
tuons des études empiriques pour 78 pays sur la période 1980-2010. ous montrons que les effets des réformes bancaires sur la croissance économique dépendent du niveau de développement technologique. De plus, les réformes bancaires ont un effet positif et si-gnificatif pour les pays proches de la frontière technologique mondiale. Ce résultat reste valide à l'introduction de variables de contrôle et à l'utilisation de différentes techniques d'estimation économétriques.
Le troisième article de cette thèse étudie empiriquement les effets positifs de l'efficience bancaire sur la croissance économique en temps de crise économique. En effet, nous utilisons la crise financière et économique de 2009 comme un choc du côté de l'offre de crédits et nous montrons par la suite que les pays avec des systèmes bancaires efficaces résistent mieux et croissent plus vite. Cette efficience bancaire relaxe les contraintes de crédits pour les industries qui ont le plus besoin de financement externe. ous utili ons une méthode économétrique appelée Data Envelopment Analysis (DEA) pour mesurer l'efficience bancaire et des estimations économétriques en coupes pays et industries. Nos résultats montrent que Peffi.cacité bancaire a un effet positif et significatif sur le taux de croissance réel pour les industries qui ont le plus besoin de financement externe. Cela implique qu'un système bancaire efficace permet aux industries qui ont le plus besoin de financement externe d'avoir plus de crédits en période de crise économique. o résultats restent robustes à l'utilisation de différentes mesures de dépendance financière.
Mots clés : Croissance schumpétérienne, frontière technologique, concentration bancaire, réformes bancaires, institutions appropriées, efficience bancaire, dépendance financière, frictions financières.
ABSTRACT
In this thesis we study the role of the banking sector and financial markets on economie development. It con ists of three scientific papers :
In the first paper, we investigate the relationship between economie growth and
bank concentration. We introduce imperfect competition within the banking system
according to the Schumpeterian growth paradigm, and we theoretically and empirically show that the effects of bank concentration on economie growth depend on proximity to the world technology frontier. The the01·y predicts th at bank concentration has a
negative and ignificant direct effect on economie growth, especially for countries close to the frontier. We empirically verify our theoretical predictions by u ing cro s-country and panel data for 125 countries over the period 1980-2010.
In the second paper, we endogenize the number of bank. and we theoretically and
empirically analyze the effects of banking reforms on gTowth according to the level of technological development of a country. Using a Schumpeterian growth paradigm and
monopolistic competition between differentiated products of the banking system, we
show that there is a thre hold of technological development from which banking refonns exert a positive effect on economie growth. To validate our theoretical predictions we
use cross-country and panel estimates over the period 1980-2010 for 78 countries. We find that banking reforms enhance the average per-worker GDP growth for countries close to the world technology frontier.
In the last paper, we use the recent financial crisis
as
a shock to the supply of credit, and we ana.lyze the effect of bank efficiency on value add d growth of firms in industries that are most dependent on external finance. Our main results how thatbank efficiency rela.xed credit constraints and increased the growth rate for financially
dependent industries during the crisis. This finding remains robust the introduction of control variables namely financia.l development bank concentration and competition, bank size and capitalization, bank upervision net interest margin overhead co ts, banking crises, monetary policy government intervention measures and macroeconomie variables interacted with external financial dependence. It also remains robust to the use of severa! m asures of external financial dependence and econometrie method .
KEYWORDS : Schumpeterian growth technological frontier, bank concentra
-tion, banking reforms, appropriate institutions, bank efficiency, financial dependence,
INTRODUCTIO
Le débat entre développement financier et croissance économique ne date pas d'au-jourd'hui, pom s'en rendre compte Schumpeter (1911) évoquait déjà ce lien. Il suggérait que le développement financier à travers un système bancaire efficace augmente la crois-sance économique. Puisque plus les banques sont efficaces, plus elles prêtent et financent les projets les plus rentables et novateurs. Cette situation augmente la productivité des entreprises et il s'ensuit une croissance économique élevée. Dans la foulée de cet article de Schumpeter, les études sm le rôle positif du développement financier sur la croissance n'ont cessé de croître. C est le cas notamment de Goldmisth (1969) qui utilise pom la première fois des estimations empiriques. À l'aide des données en coupe transversale sur la période 1860-1963, il découvre que la croissance moyenne est positivement corrélée à la taille du sectem financier. Pom pallier les lacunes posée par les estimations de Goldsmith (1969), qui n'introduisait aucune variable de contrôle, les articles de King et Levine (1993a., 1993b) apportent un nouvel éclairage sur ce passionnant débat. Ainsi, à.
l'aide d'une régression de la. croissance moyenne du PIB par tête sur plusieurs variables de l'indicateur du développement financier et des variables de contrôle (le revenu initial pa.r tête, des mesures d'éducation, des indicateurs de stabilité politique et économique), ils démontrent que le développement financier est un bon indicateur prévisionnel du taux de croissance par tête. lls mesurent le développement financier à l'aide de trois méthodes différentes, la première consistant à prendre le ratio entre les dettes liqtüdes du système financier et le PIB, la. seconde utilisant le ratio de crédit des banques de second rang sur les crédits bancaires plus les titres domestiques de la. Banque Centrale et enfin la dernière tenant compte du ratio des crédits accordés aux entreprises privées sur le PIB (Produit Intérieur Brut). Ils montrent ainsi que le développement financier est un bon indicateur pour mesmer l'accumulation du capital physique et du change-ment technologique pour un ensemble de 77 pays sur la. période 1960-1980. Bencivenga. et
2
Smith (1991) montrent que l'existence des banques fiables permet de bien gérer l'épargne des ménages et ainsi leur apporter un niveau de vie important grâce aux rendements bancaires significatifs. Plus récemment Levine (2005) dans le Handbook of Economie Growth, résume cette revue de littérature comme suit : Les pays dans lesquels le système financier fonctionne : à savoir les marchés et les intermédiaires financi rs, pos èdent des taux de croissance plus rapide, ces résultats restent consistants à l'introduction de biais de simlùtanéité. li explique également qu'un bon fonctionnement du système financier desserre les contraintes de financement externes et permet aux firme. de pouvoir em-prunter facilement et de produire plus. Aghion et aL (2005) dans leur article célèbre publié dans Quaterly Journal of Economies utilisent un modèle de croi sance endogène du type schumpétérien et un modèle bancaire avec contraintes de crédit pour analyser la relation entre le développement financier et la croissance économique. Ils montrent que la contrainte de crédit e t un facteur important pour expliquer la convergence ou la divergence entre les pays. Plus particulièrement, ils montrent, théoriquement et em-piriquement , que le développement financier a un impact sur la croissance économique selon que le pays est proche ou est éloigné de la frontière technologique. Ils obtiennent des résultats qui cla'3sent les pays en trois catégories. La première catégorie concerne des pays qui convergent à long terme vers l'état stationnaire il s'agit de pays qui ne ubissent pas de contraintes de crédit et donc le développement financier n'a aucun impact ni sur la croissance ni sur le niveau du PIB à l'état stationnaire. La deuxième est une catégorie de pays dont le développement financier est moyen. Dans ces pays le développement financier n'a aucun impact sur la croissance, mais il affecte le niveau du PIB à l'état stationnaire. Pour la dernière catégorie, il s'agit de pays qui divergent à long terme. La contrainte de crédit dans ces pays est très forte et le développement financier est faible, il y a donc un effet négatif et significatif sur la croissance économique.
L'objectif principal de cette thèse est d'apporter une contribution scientifique pertinente à ce débat. Ainsi, nous étudions l'importance du développement financier et le rôle du système bancaire dans le développement économique en tenant compte de la structure microéconomique du marché bancaire. La thèse est constituée de trois articles
3
scientifiques pertinents. En effet, dans le premier article, nous analysons théoriquement et empiriquement les effets de la concentration bancaire sur la croissance économique. Dans le second article, nous étudions à l'aide d'un mod' le théorique et empirique les effets des réformes bancaires sur la croissance économique en fonction du niveau du développement technologique. Et enfin, dans le dernier article nous mesuron les effets positifs de l'efficience bancaire sur la croissance économique durant la crise économique de 2009.
L'intérêt démontré pour ces questions s'explique pour plusieurs raisons. Premièrement,
plusieurs des études susmentionnées utilisent des estimations empiriques pour mesurer les effets du développement financier sur la croissance économique. Deuxièmement, ces études ne tiennent pas compte de la structure microéconomique du marché bancaire à savoir : la concentration, la concmrence et l'efficience bancaires. Troisièmement, la littérature existante sur le lien entre la croissance et la strucuture microéconomique du bancaire trouve des résultats contradictoires et ambigus. De plus, rar·es sont ces études qui utilisent des modèles théoriques pour analyser les effets de la structure du marché bancaire sur le développement économique. En effet, Ceterolli (2002) étudie empirique-ment les effets de la concentration bancaire sur la croissance. Il utilise la méthode offerte par Raja.n et Zinga.les (1998) avec des données en coupe pays-indu tries pour montrer que la concentration dans le sectem· bancaire augmente le taux de croissance pour les industries qui ont le plus besoin de financement externe. Cependant, il trouve que cet effet est très faible pour les pays avec un niveau de développement financier faible. Beek et al. (2004) utilisent la même méthodologie et démontrent que la concentration dans le secteur bancaire augmente les contrainte de crédit pour les firmes. Deidda et Fattouh (2005) utilisent un modèle de croissance endogène du type AK et un marché bancaire en concurrence imparfaite, et montrent que la concentration bancaire exerce deux ef-fets opposés sur la croissance économique. Pom les États-Unis, Goldberg et al. (2000) montrent que la concentration bancaire affecte positivement le niveau des crédits ac-cordés aux petites et moyennes firmes dar1s les zones urbaines, mais négativement dans les zones rurales.
4
Le premier article de cette thèse utilise un modèle de croissance endogène du type schurnpétérien et un marché bancaire évoluant dans 1.111 environnement de concurrence imparfaite à la Cournot. Le choix pour un modèle de croissance endogène du type
schumpétérien s'explique par le fait que les modèles de croissance néoclassique et les
modèles de croissance endogène à la Romer soulèvent plusieurs questions. Dans le cadre
néoclassique, les modèles parlent d'un progrès technologique exogène qui explique la
croissance sans pour autant justifier clairement l'origine de ce progrès technique. Dans
les modèles à variétés de biens de Romer, c'est la pos ibilité de création de nouvelles variétés de biens intermédiaires par le canal de l'innovation qui augmente le PIB. Ces
modèles ne tiennent pas compte de l'obsolence des inputs intermédiaires les plus anciens.
De ce fait, une disparition de ceux-ci diminue automatiquement le PIB. Dans le modèle
de croissance schumpétérie1me que nous présentons, la qualité du bien a w1e importance
cruciale pour la croissance économique. Les premières tentatives d'utilisation de ce type de modèles sont dues à Aghion et Howitt (1992) qui utilisent les outils de l'économie
industrielle pour mesurer le degré de concurrence pour la productivité. La modélisation
dans un cadre de concurrence imparfaite à la Cournot nous permet d'introduire les
effets de la concentration bancaire mesurée par l'indice de Herfindahl sur la croissance
économique.
Nos premiers résultats montrent que la concentration bancaire a un effet négatif
sur la croissance économique. De plus, cet effet est d'autant plus négatif pour les pays proches de la frontière technologique mondiale. Ce résultat s'explique en partie par le
fait que la concentration bancaire diminue les montants accordés aU-x entrepreneurs
parce qu'elle augmente les taux d'intérêts des emprunts. Ainsi, il en résulte une baisse de l'innovation et donc de la croissance économique. Nous observons des opportunités d'innovation plus importantes pour les pays proches de la frontière technologique, une hausse de la concentration bancaire diminuant les montants alloués à l'innovation, il
s'ensuit une baisse importante de la croissance économique pour ces pays. Pour valider
nos résultats théoriques, nous utilisons des estimations économétriques avec des données
1980-5
2010. Nous démontrons que la concentration bancaire diminue le taux de croissance
annuel moyen du PIB par travailleur. Cet effet est d'autant plus négatif et significatif pour les pays proches de la frontière technologique mondiale. Nos résultats empiriques sont robustes à l'utilisation du taux de croissance annuel moyen du PIB par tête et à l'introduction de variables macroéconomiques (ta.ux d'inflation, taux de croissance de la masse monétaire, balance budgétaire, dépenses gouvernementales, et commerce), éducation, crédits privés et origines légales comme contrôles et à 1 'utilisation de plusieurs techniques économétriques.
Dans notre second article, nous endogénéisons le nombre de banques qui est une donnée exogène dans le premier chapitre. Pour cela, nous utilisons un modèle ban-caire en concurrence imparfaite avec différenciation horizontale à la Sa.lop (1979). Ce modèle nous permet ensuite d'étudier les effets des réforme bancaires sur la croissance économique. Les réformes bancaires sont mesurées pru· les coûts fixes d'entrée. À l'aide de la libre entrée dans le secteur bancaire, nous montrons que les réformes bancaires affectent la croissance économique. Les intuitions de ce réstùtat s'expliquent par le fait que les réformes bancaires par la libre entrée facilitent l'accès aux crédits pour les in-novateurs en diminuant les taux d'emprunts. Des réformes bancaires en profondeur, par exemple la libre entrée dans le secteur bancaire, permettent au pays de croître et d'avoir des taux de croissance élevés. Pour valider nos prédictions théoriques, nous ef-fectuons des études empiriques pour 78 pays sur la période 1980-2010. Nous montrons que les réformes bancaires affectent sur la croissance économique selon le niveau du développement économique. De plus, les réformes bancaires qnt un effet positif et signi-ficatif pour les pays proches de la frontière technologique mondiale. Ce résultat reste valide à l'introduction de variables de contrôle et à l'utllisation de différentes techniques d'estimation économétriques.
Le troisième article de notre thèse étudie empiriquement les effets positifs de l'efficience bancaire ur la croissru1ce économique en temps de crise économique. Nous utilisons la crise financière et économique de 2009 comme un choc du côté de l'offre de crédits et nous montrons par la suite que les pays avec des systèmes bancaires efficients
6
résistent mieux et croissent plus vite. ous utilisons une méthode économétrique appelée
Data Envelopment Analysis (DEA) pour mesurer l'efficience bancaire et des estimations économétriques en coupes pays et industries. Pour la première fois, nous analysons
le lien entre le développement financier et la croissance éoonomique en utilisant une vraie mesure de l'efficience bancaire ou du développement financier. Ceci nous permet de nous différencier de la littérature existante qui utiHse le niveau de crédits privés sur le PIB comme mesure du développement financier. L'utilisation des données pays
-industries nous permet entre autres de contrôler pour les variables omises et de traiter en profondeur la question liée à l'endogénéité. Notre échantillon final est composé de 37 pays et de 36 industries pour un total de 2611 observations. Nou. utilisons ensuite la méthode de Rajan et Zingales (1998), en régressant le taux de croissance annuel en termes réels de la valeur ajoutée de l'industrie j et du pays k sur les variables muettes pays et industries, l'interaction entre la dépendance financière de l'industrie j et l'efficience bancaire du pays k et différents types de variables contrôle du pays k.
Nous montrons que l'efficience bancaire relaxe les contraintes de crédits pour les industries qui ont le plus besoin de financement externe. De plus nos résultats montrent
que l'efficience baJ1caire a un effet positif et significatif sur le taux de croissance réel pour les industries qui ont le plus besoin de financement externe. Cela implique qu'un système bancaire efficient permet aux industries qui ont le plus besoin de finaJ1cement externe
d'avoir plus de crédits en période de crise économique. Pour dissocier les effets réels de
notre mesure de l'efficience bancaire sur la croissaJ1Ce à d'autres variables, nous
intro-duisons différents types de vaJ·iables de contrôle. Nous contrôlons pour le développement
financier du pays en introduisant 1 'interaction entre la capitalisation boursière, la
ca-pitalisation totale et la dépendance financière. Notre résultat reste valide, et montre que l'efficience baJ1caire facilite l'accès aux crédits pour les industries qui ont le plus besoin de financement externe. Nous contrôlons également pour la concentration et la concurrence baJ1caires, la supervision bancaire, le PIB réel, le commerce, l'inflation le taux de change, la politique monétaire, les mesures gouvernementales annoncées pour contrer la crise économique (actifs annoncés, actifs utilisés, garanties bancaires, support
7
en liquidités), la taille du marché bancaire, la capitalisation bancaire et les crises ban -caires. Nos résultats restent également robustes à l'utilisation de différentes mesures de dépendance financière. Les prochaines sections présentent en détail les trois chapitres de la thèse.
Mots-clés : Croissance schumpétérienne, frontière technologique, concentration bancaire, réformes bancaires, institutions appropriées, efficience bancaire, dépendance financière, frictions financières.
CHAPTER I
BANK CO CE TRATIO AND SCHUMPETERIAN GROWTH: THEORY
A D I ITER ATIO AL EVIDE TCE
Abstract
This paper investigates the relationship between economie growth and bank concen-tration. We introduce imperfect competition within the banking system according to the Schumpeterian growth paradigm, and we theore"tically and empirically show that the effects of bank concentration on economie growth depend on proximity to the world technology frontier. The theory predicts that bank concentration has a negative and si-gn.ificant direct effect on economie growth, especially for countries close to the frontier. We empirically verify our theoretical predictions by using cross-country and panel data for 125 countries over the period 1980-2010.
KEYWORDS : Schumpeterian gwwth, bank concentration, technological fron-tier.
9
1.1 Introduction
The role of financial development in economie growth, first outlined by Schum-peter (1912) as allowing for botter capital allocation, is now at the heart of economie growth literature. The first serious attempt to empirically estimate the relation, bet-ween financial development and economie growth dates back to Robert King and Ross
Levine. Indeed, King and Levine (1993a.) used a cross-country perspective and found
that varions measures of the level of financial development are strongly associated with real per capita GDP gTowth, the rate of physical capital accumulation, and improve-ments in the efficiency with which economies employ physica.l capital. King and Levine (1993b) show that the level of a country's financial development helps predict its rate of
economie gTowth for the following 10 to 30 years. Since then, a large body of literature,
exhaustively reviewed by Levine (2005), has estimated this relation using numerous
robustness checks to corroborate the intuition of Schumpeter (1912).
In thi paper, we propose to evàluate the effect of bank concentration on economie growth, both theoretically and empirically, using the Schumpeterian growth paradigm. The literature devoted to the effects of bank concentration on economie growth has led to different and ambiguous results. Our purpose in this article is to clarify this relation
by answering the two following main questions : What are the effects of bank
concentra-tion on economie growth in a theoretical aJ1d empirieal framework? How do these effects evolve for a given country according to its proximity to the world technology frontier?
The answer to both of these questions allows us to take a position in the existing litera
-ture mainJy to provide a botter understanding of the effects of maJ·ket power and bank
concentration on economie growth through a theoretical model validated by empirical
estimates. We use an endogenous growth model, namely the Schumpeterian growth
pa-radigm inspired by Aghion et al. (2005), where the engine of growth is considered to be innovation. Another merit of this model is that it takes înto account the effects of convergence and divergence between countries as opposed to neoclassical growth models and first generations of endogenous growth models such as AI< or varieties of int
erme-10
diate goods of Romer (1990). Final output technology combines labor and intermediate inputs, and these intermediate inputs are produced by innovators (entrepreneurs) who enjoy monopoly power because they operate the technology that is closest to the fron-tier. Endogenous gwwth and convergence to the fronber are driven by innovation in the intermediate ector, which is performed by entreprenems needing external finance. Innovators (entrepreneurs) face a cost (th us they borrow), w hi ch depends on the success probability and is proportional to the technological level of the frontier. If successful, they enjoy profits which are proportional to the frontier technology. Innovators do not take the interest rate as given but interact strategically with banks. Hence, expected pro-fitabiHty from R&D depends on the amount inve ted in three ways : negatively because it is a cost, positively because it increases the probability of entrepreneurial innovation, and it reduces the interest rate on loans. To measme the effects of bank concentration on innovation in our model, we use imperfect Cournot competition in the banking sec-tor. The banking s ctor is composed of n identical banks, which collect deposits and offer loans to entrepreneurs. The deposits sector is assumed to be perfect competition, while the loans . ector bas evolved according to imperfect Cournot competition. This last assumption allows us to capture the effects of bank concentration measured by the Herfindahl index on economie growth.
The effect · of bank concentration on economie growth have been studied by Deidda and Fattouh (2005) using an AK endogenous growth model. They .find that reduction in the level of concentration in the banking industry exerts two opposite effects on economie growth. On the one hand, it induces economies of specialization, which enhances intermediation efficiency and thereby economie growth. On the other hand, it results in the duplication of fixed costs, which are detrimental to efficiency and growth. Our article does not explore the channel of capital accumulation as did Deidda and Fattouh (2005) or Ba.dunenko and Romero-Avila (2013), who found that a sub-stantial part of the productivity growth attributable to physical capital accumulation should be associated with the allocative efficiency role of financial development using nonparametric production frontier and adding .financial development. Our empirical
re-11
sults are robust, through the use of bank efficiency (net interest margin and overhead costs), as , uggested by Badunenko and Romero-Avila (2013) for financial efficiency,
in columns (6) and (7) of Table 1.9. In this article, we demonstrate that the effect of bank concentration on economie gwwth is due to tlu·ee channels. The first channel i captured by the loan rate tlu·ough imperfect Cournot competition in the banking sys-tem; the second channel is measured by the probability of entrepreneurial innovation through the Schum.peterian endogenous growth model; and the last channel deal.· with the proximity to the world technology frontier to explain the effects of convergence among countries through bank concentration. Several empirical studies show that high bank concentration increases the cost of the credits, as suggested by Hannan (1991), who finds strong evidence that concentration is associated with higher interest rates across U.S. banking markets. Cetorelli (2002) explores the effect of the banking market structure on the market structure of industrial sectors. He finds that banking concen
-tration enhances industry market concentration, especially in sectors highly dependent on external finance. However, these effects are weaker in coLmtries characterized by
hi-gher overall financial development. Empirically, Beek et al. (2004) u e a cro s-country approach with firm-level data and investigate the effects of bank competition on firm financing constraints and access to credit. They show that bank concentration increases financing constraints and decrease the likelihood of receiving bank financing for small and medium-size firms, but not for large firms. Petersen and Rajan (1995) show that the competition in credit markets is important in determining the value of lending re
-lationships and they find empirical evidence that creditors are more likely to finance credit-constrained firms when credit markets are concentrated because it is easier for these creditors to internalize the benefits of assisting the firms. Goldberg et al. (2000) how across local U.S. banking markets that concentration affects small business lending positively in urban markets and negatively in rural markets. Vve add a novelty to these studies by theoretically testing the effects of bank concentration on the costs of credit; our fir t theoretical result show that bank concentration increases the co t of credit for entrepreneurs and at the same time exerts a direct negative effect on economie growth through innovation.
12
Wc theoretically show that the probability of entrcpreneurial innovation is a
de-creasing function of bank concentration as measured by the Herfinda.hl index. This result allows us to verify the empirica.l results obtained in the literature on the relationship
between bank concentration and the creation of new firms. Sorne authors use empirical
investigation to illustrate the effects of bank concentration on the formation of firms, such as Black and Stra.l1a11 (2002), who find evidence across U.S. states that higher concentration re ults in less new finn formation, especially in states and periods with regulated banking markets. Howevcr, Cetorelli and Ga111bcra (2001) study the empirical
relevance of the banking market structure on growth and show that bank concentration
promotes the growth of the industria.l sectors that are more in need of external finru1ce
by facilitating credit access to younger firms. They also find a general depressing effect on growth associated with a concentrated banking industry, which impacts all sectors and firms indiscriminately.
In arder to answer the second question of om article, we measure the effects of
bank concentration on the probability of entrepreneuria.l innovation according to the
proximity to the world technology frontier for a given country. We theoretically show
that bru1k concentration has a significant, direct effect on economie gTowth and that
this effect is even more negative and significant when the country is close to the world
technology frontier. These results contradict th ose of Deidda and Fattouh (2005), who
empirically find that bank concentration is negatively associated with industrial growth only in low-income countries, while there is no such association in high-income countrie .
Despite the negative effect of bank concentration on economie gTOwth through financing
constrajnts, Beek et al. (2004) found that the connection between bank concentration and financing constraints is reduced in cotmtries >vith an efficient legal system, good
poverty rights protection, less corruption, b tter developed credit registries, and a large
mru·ket share of foreign banks, while a greater extent of public bank owner hip exacer-bates the relation. In addition, these results do not explore the effects of bank concen-tration on the convergence a111ong countries in a theoretical fraJ.Tiework, and the results
re-13
gulation variables ( activity restriction, required reserves, bank development, and official supervisory power) as in Beek et al. (2004). The results are presented in columns
(2)-(5) of Table 1.9. We significantly expand on such findings using panel and cross-country data of 125 countries over the period 1980-2010 to show that bank concentration has a negative and significant direct effect on the average per \VOrker GDP growth and that this effect is even more negative and significant when the country is close to the world technology frontier. These findings remain robust to the use of the average per capita GDP growth rate, as shown in Table 1.7. In addition, our results are robust due to the use of multiple measures of bank concentration, multiple measures of GDP growth (Penn World Table 7.1 and Penn World Table 8.0), and the introduction of se-veral types of control variables : financial development, school, macroeconomie policies (money growth, inflation, budget balance governrnent consurnption, and trade), bank regulation (activity restriction, required reserves, bank development, and official super-visory powers), bank efficiency (net interest margin and overhead cost. ), institutional policies (British, French, and German legal origins) and multiple econometrie methods, such as ordinary least squares (OLS), Instrumental Variables (IV) and Arrellano-Bond generalized method of moments (GMM) estimation.
In summary, our paper introduces several crucial novelties to the existing litera-ture. First, while most papers use empirical cross-country estimates to test the effects of bank concentration on economie growth, our paper uses a theoretical model to mea. ure the effects of bank concentration according to the proximity to the world technology frontier for a given country, as well as empirical estimates to validate our theoretical rnodel. Second, to our knowledge, our theoretical model and empirical estimates are the fh·st in the literature to establish the link between bank concentration and economie growth according to a Schumpeterian growth para.digm. Finally, our sample includes developed, developing, and emerging countries. To test the robustness of our results, we use several estimation methods and several types of control variables. The remain-der of the paper is organized as follows. Section 1.2 outlines the basic structure of the theoretical rnodel, section 1.3 confronts the theoretical predictions by using empirical
14
inve tigation, and ection 1.4 summarizes the findings.
1.2 Theoretical framework
1.2.1 A simple Schumpeterian theoretical framework
We use the theoretical Schumpeterian gTowth paradigm developed over the past decade by Howitt and Mayer-Foulkes (2004), Aghion et al. (2005), and Acemoglu et al. (2006). Time is considered discrete, and there is a continuum of individuals in each country. There are J countries, indexed by j = 1, ... , J, which do not exchange goods and factors but are technologically interdependent in the sense tha.t they use technological ideas developed el ewhere in the world. Each country has a fixed population, L, which
we normalize to one L
= 1,
so that aggregate and per capita quantities coïncide. Each individual lives two periods and is endowed with two unit of labor services in the first period and none in the second. The utility function is assumed to be linear in consumption, so that U = c1 +f3
cz,
where c 1 and c2 represent consumption in the first and second periods of !ife, respectively andf3
E (0, 1) is the rate at which individuals discount the utility consumption in the second period relative to that in the first.Production of final good. Consider a cow1try j, where in that follow we drop country -index without Joss of generality, where there is only one general good Yt, taken as the numéraiœ produced by specialized intermediate goods and labor as
yt = L1-o:
fol
At(ll) 1-o:Xt(v)<J<dll with 0<a
<
1 (1.1)where Xt(ll) is the country input of intermediate good li such that liE [0, 1], and At( li) is the technological productivity pa.rameter associated with it. The final good is used for consumption, as an input into entrepreneurial innovation and the production of intermediate goods. Producers of the general good act as per·fect competitors in all markets, so that the inverse demand for intermediate goods and labor are given by
{
Pt(ll)
= ŒXt(ll)a
-l At(ll)l-o: for all sectors v E [0, 1](FOC) (1.2)
15
Production of intermedia.te goods. For ea.ch intermediate good v, there is an innova.tor who enjoys a. monopoly power in the production of this intermedia.te good and produces a unit of the intermediate good by using 1 unit of the final good. The finn maximizes its profits given by
(1.3) The first order condition allows us to find the equilibrium quantity of intermediate good
2
v of quality At(v) given by Xt(v) = o:~-n At(v). The equilibrium priee of the intermediate good vis given by : Pt(v)
= a-1,
so that the equilibrium profit of intermediate firm is written as~
7rt(v) = (1-a)al-<>At(v) = nAt(v) (1.4) l+a
where 1r
=
(1- a)a1-"' so that the profit earned by the incumbent in any. ector v will be proportional to the productivity parameter in that sector.Net output and growth rate. Substituting the equilibrium quantity Xt(v) into the final good production function (1.1) shows that the equilibrium gross output of the general good is proportional to the average productivity parameter, defined as At=
fol
At(v)di.J,so that
(1.5) as well as wages
(1.6) 2a
where w
=
(1 - O')a1-a-. Finally, let Yinet represent the net output, defined as gross output minus the cost of intermediate goods, which enters in the production of the general good. Thus :{1
~Yinet = yt- Jo Xt(v)dv = (1- a)(1
+
a)a1-<>At (1. 7) Therefore, the growth rate of net output is the same for the average productivity para-meter : 1+
9t= AAt
. Vve focus on this last formula to determine the growth propertiest-1 of a particular country.
16
Technologica.l change. Following Aghion et al. (2005), in each intermediate good sector v, a continuum of persons with an entrepreneurial idea is born in the period t capable of producing an innovation in the period
t
+
1, and if successful becomes the vth incumbent at t+
1. We denote f.i.t+l (v) as the probability of entrepreneurial innovation, the level of technology of intermediate goods sector v in the periodt
+
1 , At+l(v) according to the following process :{ At+l At+l(l/) = At(v)
with probability f.i.t+l(v) with probability 1 -f.i.t+l(v)
where At+l denotes the world technology frontier, which grows at the constant rate
g
>
O. The expected level of productivity of sector v thus evolves according toAt+l(v)
=
f.kt+l(v)At+l+
(1-f.kt+l(v))At(v) (1.8) In equilibrium, as we show below, the probability of entrepreneurial innovation will be the same in each sector : f.i.tH (v)=
f.kt+l· Replacing and integrating this equation on both sides, the average productivity becomesAt+l
=
f.kt+111t+l+
(1- f.kt+l)At (1.9) Let us denote at_=
~t
as the proximity to the world technology frontier of the averageAt
productivity of a country. Its dynamics is given by the following law of motion : 1
at+1
=
f.kt+l+
1
+
g (1 - f.kt+l)at (1.10)Demand for loans. At the beginning of the second period, a household has the op-portunity to become an entrepreneur (innovator) where the cost of innovation is given byl
Zt2"1(v)
=
1/Jf.i.t+l(v)<i>At+l (1.11)
where Zt+l (v) is the total investment in terms of the final good,
1
p
>
0 is a parame ter that affects the cost of innovation, and we assume that <jJ ;::::: 2 in order to wruTant the1. For</;= 2, the cost of innovation is: ZAt+l(v) = ~J.I.t.+1(v)2 t+l
17
existence of the equilibrium probability to innovate. The total investment is adjusted to the world technology frontier At+l to take into a.ccount that it becomes more expensive
to maintain an innovation rate f.ht+1(v) as the technological frontier a.dvances.
The households eam a wage at the end of the first period, Wt given by (1.6), which they ave in the bank with a return rate rv,t· They borrow the amount (Zt+l(v)- (1
+
·rv,t)wt) = Tt+l(v) from the bank becau ethe wage received is not ufficient to initiate an innovation. Therefore, in equilibrium, f-i.t+l(v) will be chosen by the innovators so asto maximize the expected net profits as
max 1l'At+l(v)f-i.t~l(v)- (1
+
rt+l) [Zt+l(v)- (1+
rv,t)Wt]- (1+
rv,t)Wt {J.Lt+l (11)}[f-i.t+I(v)7r-'l/J(1
+
·rt I)J.ht+l(v)<P] At+l(v) + rt+l(1+
·rv,t)Wtwhere rt+l is the loan rate. So, in equilibrium, the probability of entrepreneuria.l inno-vation is the same in ea.ch sector :
(1.12) Sub tituting equation (1.12) into equation (l.ll) and using Zt+l (v) - (1
+ rv
,t)Wt = Tt+I(v) allows us to find the demand for loans for innovators, which decrea.ses with the loan rate (rt+1 ), and the innovation cost parameter ('1/J), which increases with the world technology frontier (At+ 1) and net profits ( 1!'). Denoting that the wa.ge is proportional to local procluctivity such that Wt=
wAt, as displayed in equation (1.6), the demand for loans, ·identical in each sector, is given by(1.13)
1.2.2 Banking sector
We model the ba.nking sector in the context of Cournot competition for loans, and we assume perfect competition for deposits, (as initially propo. ed by 1onti (1972) and
18
Klein (1971) and reviewed in Freixas-Rochet (2008). The banking sector is composed of
n identica.l banks indexed by i
=
1, ... , n. Bank i pays linear transaction costs betweenloans and deposits C(Dt+l(i), Tt+l (i))
=
')'DDt+I(i)+
!T'Zt+l(i), where ID: 'YT E [0, 1]are cost para.meters associated with the deposits and loans activities, respectively. In
the period t
+
1, the bank chooses Tt+1 ( i) and Dt+l ( i) so as to maximize its profitsgiven by
rrf+l (i)
~
(r,+J(i)l't+lt,
1;+1 (k) -'lT
)
Tt+1 (i) - T Bw (i) - (rD,t+1+
~
D
)Dt+,(i) (1.14)and subject to the following constraints :
tb
Tt+I(i)
=
'1/J[
4>1,b
(l~rt
+
1
)
]
</>-1
At+l- (1
+
rv,t)WAtBt+I(i)
=
Rt+l('i)+
Tl+I(i)-Dt+l(i) (1.15) Rt+I(i) = eDt+l(i)In these constraints, Tt+l (i) is the de.mand for loan of the bank i, and Bt+1 (i) is the net
position of bank i on the inter bank market according to the sum of the reserves Rt+l ( i)
and loans, minus deposits. Rt+1(i) is the reserves of bank i, equal to a proportion
e
ofdepo its. The interbank rate (T) and the coefficient of compulsory re erves (e) may be
used as policy instruments by which the Central Bank tries to influence monetary and
credit policies, as noted by Freixas and Rochet (2007). Substituting the constraints, the
problem becomes subject to </> Tt+1 = '1/J [
c/J'I/J(
1: rt+l)] <t>-1 At+l- (1+
rv,t)WAtThe banks have the same linear cost function and the same demand for loan.<; ; thus a.
unique equilibrium is given by Tt+l(i)
=
T~;1, so that the first order conditions are(FOC) {
rD,t+l
=
rD=
T(1 - e) - / Dr~+l Tt+l/-Lt+lH
+
rt+lf-Lt+l=
T+
/T19
The first condition shows that the deposits return rate is constant, and depends positi-vely on the interbank rate (T) but negatively on the coefficient of reserves (8) and the deposits management costs (10 ). The second condition allows us to find the loan rate according to the elasticity of the demand for loans :
r t+lf-Lt+l - ( T
+
/T) rt+lf-Lt+lH
E (1.17)
where ~ is the inverse of the elasticity of the demand for loans, and H is the Herfindahl index. This condition shows the well-known Lerner index, which represents the market power of the bank. The inverse of the elasticity of the demand for loans is given by 2
E
7
/J(cp-
1)(1 + rt+1
)
2
w(qJ - 1)(1 + ro,t)(1+
rt+l? 1ïrt+l - 1ï'1't+1 [<i>7P
(l~rt
+
l
)
J
.P
~l
at(1.18) 1
where W =:
1
~
9
.
vVe assume that rt+l<
{w [T(1-e)+
(1- ID)] at}l-if> (*
)
2-if>
~
-
1, 3 to ensure that the Lerner index is positive. Using equations (1.12), (1.17), and (1.18) allows us to find the implicit relation between the Joan ra.te rt+1, the proximity to the world technology frontier at, and the Herfindalù index H such that 4We derive, from this expression, the effect of the proximity to the world technology frontier on the loan rate rt+l·
Proposition 1. If
cp
2: 2, then the loan rate rt+1 is a decreasing function of the proxi-. . 8rt+l
mzty to the world technology frontzer at :
-8-at -
<
0.Proof See Appendix C.
•
2. See Appendix A. 3. See Appendix B. 4. See Appendix C.
20
If the cost of innovation is convex, and the Lerner index is positive, the imp
li-cation for proposition 1 is that countries close to the world technology frontier have
higher wages, implying that the entrepreneurs in the innovation sector are self-financing a significant amount of their project and therefore paying a smaller amount to the bank. Thus, the loa.n rate for innovators is reduced when the country is close to the technological frontier.
The following proposition establishes the link between loan rate and bank conce n-tration. It shows theoretically that an increase in bank concentration increases the cost of credit for innova.tors.
Proposition 2. If rjJ 2: 2 and Tt+l
< {w
[T(1-e)+
(1 -ID)] at}l-<i> (~
)
2
-</>
~
- 1, then the loan rate rt+l is an increasing function of bank concentration H measured by theart+l
H erfindahl index :
0 H
> 0.
Proof See Appendix C. •
The intuition of the proposition 2 is as follows. Under the convexity of the cost of
innovation and the positivity of the Lerner index, an increase in the Herfindahl index
increases the market power of banks and increases at the same time the loan rate for
entrepreneurs.
Using equations (1.12), (1.17), (1.18), ·and the implicit relation (1.19), we derive
the equilibrium probability of entrepreneurial innovation f.tt+l according to the loan rate
r't+l, the proximity to the world technology frontier at, and the Herfinda.hl index H,
given by5
(1.20)
21
The condition cp 2: 2 en ures that the probability of entrepreneurial innovation is strictly positive (J.Lt+l
>
0) and less thau one (J.Lt+l<
1). 6 The following proposition shows that countries close to the world technology frontier have a higher probability to innova te.Proposition 3. If cp 2: 2, the pmbability of entrepreneurial innovation J.Lt+l is an . ÔJ.Lt+l
>
0increasing function of the proximity ta the world technology fr-antier at . âa1- .
Proof See Appendix C.
•
In proposition 1, we have shown that countries closer to the technology frontier have lower loan rates through higher wages. The decr ased loan rates promote access to credit for innovators, increasing the probability of entrepreneurial innovation. An increase in the probability of entrepreneurial innovation has a po itive and significant effect on the productivity of the economy.
The next proposition provides our fust prediction; lt implies that bank concen-tration bas a negative direct effect on the probability of entrepreneurial innovation.
2-1/J
Proposition 4. If cp 2: 2 and rt+l
<
{
w
[T(1 - B)+
(1 - ID)] ai} l-1/J (*
)
~
-
1, the probability of entreprenez•rial innovation is a decreasing function of the bankconcentra-. . ÔJ.Lt+l
twn H measured by the Herfindahl mdex : âH < O.
Proof See Appendix C.
•
Proposition 4 is quite intuitive and cornes from proposition 2. The market power of banks increases loan rates, which reduces the amounts of loans for innovation, thereby decreasing the probability of entrepreneurial innovation.
Finally, the following proposition i the most important prediction of our theore-tical model. It shows that bank concentration has a negative and significant effect on
22
the probability of entrepreneurial ümovation, and that this effect is increasingly nega-tive as the country approaches the world technology frontier. This result is validated by empirical estimates using cross-country and panel data, which we present in section 3 of the article.
Proposition 5. If
cp~
2 and rt+l<
{w [T(1- B)+ (1
-1'D)] at}1-<l> (~)
2-<1>~
-1, then the bank concentration has a negative effect on economie growth for countries close to. cPJ.l.t+l
the world technology jront2er: âHâat <O.
Proof See Appendix C.
•
Combining propositions 3 and 4 gives us proposition 5. The intuition of propo-sition 5 is as follows. The market power of banks by increasing the Herfindahl index has a negative effect on the probability of entrepreneurial innovation for a country close to the frontier. To our knowledge, this theoretical result is the first in the literature to establish the negative effect of bank concentration on growth through innovation for countries close to the world technology frontier. The raison d'être of thi finding is that countries close to the world technology frontier have more opportunities to innovate, whicb positively and increasingly affects economie growth. The increase of market po-wer in the banking sector by the ri e in bank concentration leads to the reduction of the amounts allocated to innovators, resulting in the reduction of economie growth for these countries.
1.2.3 Dynamics and bank concentration
Substituting the expression of the probability of entrepreneurial innovation into the equation (1.10) allows us to find the dynamics of the proximity to the world tech-nology frontier :
23
where the equilibrium probability of entrepreneurial innovation is given by
Proposition 6 shows that a given country reaches a unique and positive value of its proximity to the world technology frontier and that this equilibrium is stable. The
steady, tate depends on the bank concentration of the country through t~e equilibrium
probability to innovate as already suggested by propositions 4 and 5 Proposition 6. If
rp
>
2, then :1. F(at;) is z-Lipschitzian and contracting, where z
=
(4>-
2
~~l+g)
[
</>1/.>
(r~-rr)r-
4>
<
1. 2. The pmximity to the world technology frontier of a given country converges in thelong run to the unique steady-state value a*, where a* is given by
Proof See Appendix D.
a*= (1
+
g)p,*< 1
1-L*+
gMain predictions : Our theoretical model predicts two implications :
1. Bank concentration has a negative effect on economie growth;
(1.22)
•
2. For countries close to the world technology frontier, bank concentration has a negative effect on economie gmwth.
1.3 Bank concentration and convergence : Cross-country and panel evidence
1.3.1 Specification and data
In this section, we support om theoretical predictions with evidence. Our
24
J(
Growthi,t =
a+
(h CONC
i,t +5zCONCi,t x FRO Ti,t+
~,Bkxk,i,t+Çi+(t
+Ei,t (1.23)k=l
where i and t denote country and period · a, Çi, and (t denote respectively the intercept, country, and time fixed effects; and Xi,t = [xl,i,t, ... , XK,i.,t] is a set of K control variables defined below. We therefore test the link between growth and bank concentration using
panel data for 125 countries over the period 1980-2010 where data are averaged over five 5-year periods between 1980 and 2010. 7 Growthi,t is the average per worker GDP
growth rate over each 5-year period using per worker GDP data from Penn vVorld Table 7.1 (Aten et al., 2012). 8 The proximity of the country i to the world technology
frontier, defined as the maximum of initial per worker real GDP's at the beginning of
each sub-period, subsumed as at in the theoretical model and denoted FRONTi,t in our
econometrie specification, is measured as the logarithm of the ratio of the initial per
worker real GDP of country i over the 5-year period to the initial per work r real GDP of the United States. 9
CO rci,t is the bank concentration, which is equal to the . hare of assets of the
7. The first period covers the years 1980-1985; the econd period covers the years 1986-1990; the third period covers the years 1991-1995 and so on. The last period covers the years 2006-2010.
8. We use RGDPWOJ< as a measure of real GDP. PWT 7.1 i. publicly available at
https: 1 !pwt. sas. upenn. edu/. Our re. ults rem ain robust using RGDPCH, i.e. per capita GDP instead of per worker GDP. See Table 1.7 for more details. Vve also use the new Penn World Table 8 taken from Groningen Growth and Development Center, publicly available at
http: 1 /www. rug. n1/research/ggdc/data/penn-world-table. For details see, Table 1.10 and 1.11. 9. We do not put the proximity to the worldwide technological frontier FRONT;,t in om eco-nometrie specifications beca.use we find a strong correlation equals to 0.93 between the interaction term CONC;,tXFRO 1T;,t and the proximity to the world teclmology frontier FRONTt,t, which lead to obvious multicollinearity problems. To treat this problem, we ·share our ample into two groups of countries, the first group is composed of countries above the median of the proximity to the world technology frontier, and the second gToup i composed of countries below. For details, see column (3) of Table 1.3.
25
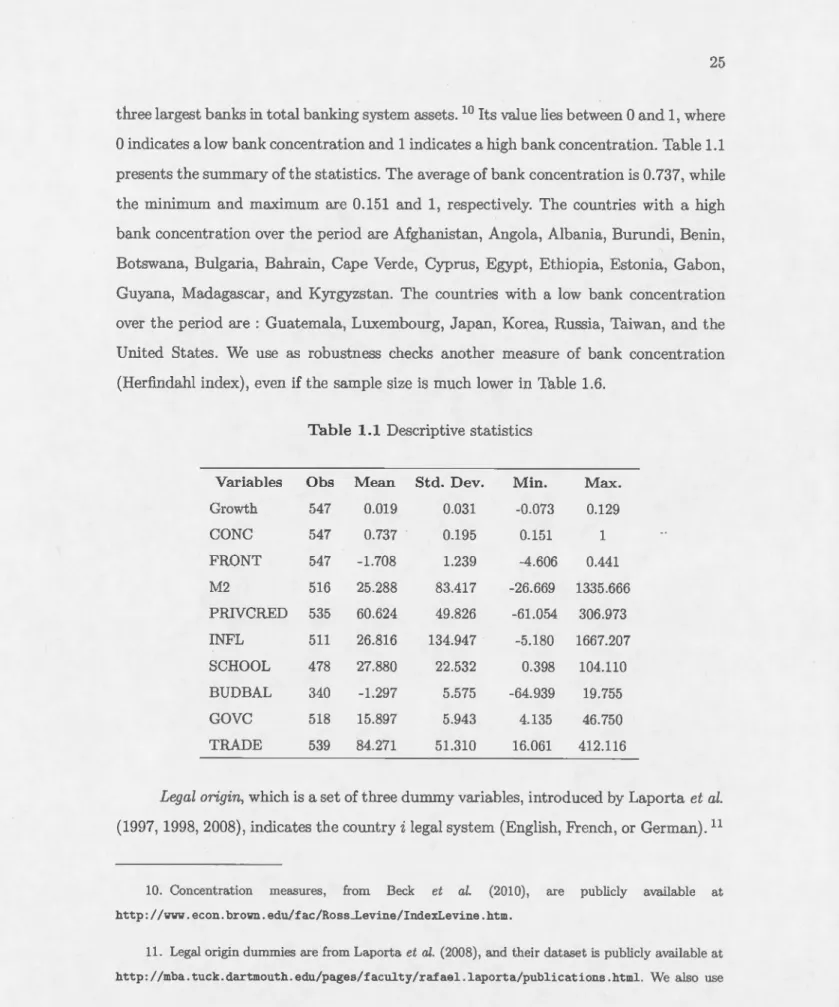
three la.rgest banks in total ba.nking system a.ssets. 10 Its va.lue lies between 0 and 1, where 0 indicates a low bank concentration and 1 indicates a. high bank concentration. Table 1.1 presents the summary of the statistics. The average of bank concentration is 0.737, while the minimum and maximum are 0.151 and 1, respectively. The countries with a. high bank concentration over the period are Afghanistan, Angola, Alba.nia., Burundi, Benin, Botswana., Bulgaria, Ba.hrain, Cape Verde, Cyprus, Egypt, Ethiopia., Estonia., Gabon, Guyana, Madagascar, and Kyrgyzstan. The countries with a low bank concentration over the period are : Guatemala, Luxembourg, Japan, Korea, Russia, Taiwan, and the United States. We use a.s robustness checks another mea.sure of bank concentration (Herfindahl index), even if the sample size is much lower in Table 1.6.
Table 1.1 Descriptive statistics
Variables Obs Mean Std. Dev. Min. Max.
Growth 547 0.019 0.031 -0.073 0.129 CONC 547 0.737 0.195 0.151 1 FRONT 547 -1.708 1.239 -4.606 0.441 M2 516 25.288 83.417 -26.669 1335.666 PRIVCRED 535 60.624 49.826 -61.054 306.973 I IFL 511 26.816 134.947 -5.180 1667.207 SCHOOL 478 27.880 22.532 0.398 104.110 BUDBAL 340 -1.297 5.575 -64.939 19.755 GOVC 518 15.897 5.943 4.135 46.750 TRADE 539 84.271 51.310 16.061 412.116
Legal origin, which is a. set of three dummy variables, introduced by Laporta. et al. (1997, 1998, 2008), indica.tes the country i legal system (English, French, or German). 11
10. Concentration measures, from Beek et al. (2010), are publicly available at
http://www.econ.brown.edu/fac/Ross_Levine/IndexLevine.htm.
11. Legal origin dummies are from Laporta et al. (200 ), and their da.t~ et i publicly a.vallable at http: 1 /mba. tuck. dartmouth. edu/pages/facul ty /rafael.laporta/publications. html. We also use