HAL Id: halshs-02300746
https://halshs.archives-ouvertes.fr/halshs-02300746
Preprint submitted on 29 Sep 2019HAL is a multi-disciplinary open access archive for the deposit and dissemination of sci-entific research documents, whether they are pub-lished or not. The documents may come from teaching and research institutions in France or abroad, or from public or private research centers.
L’archive ouverte pluridisciplinaire HAL, est destinée au dépôt et à la diffusion de documents scientifiques de niveau recherche, publiés ou non, émanant des établissements d’enseignement et de recherche français ou étrangers, des laboratoires publics ou privés.
The effects of comprehensive performance measurement
systems on information overload, job-relevant
information, role clarity and procedural fairness
Chong Lau, Brigitte Oger
To cite this version:
Chong Lau, Brigitte Oger. The effects of comprehensive performance measurement systems on infor-mation overload, job-relevant inforinfor-mation, role clarity and procedural fairness. 2019. �halshs-02300746�
The effects of comprehensive performance measurement systems on information overload,
job-relevant information, role clarity and procedural fairness
Chong M. Lau
Professor of Accounting
Curtin University of Technology Australia
Chongman.Lau@curtin.edu.au and
Brigitte Oger
Associate Professor
Sorbonne Business School The University of Paris 1, France
Brigitte.Oger@univ-paris1.fr
Correspondence author and address: Professor James Lau
School of Accounting
Curtin University of Technology GPO Box U1987
Perth, WA 6845, Australia Tel: 61 8 9266 2294
The effects of comprehensive performance measurement systems on information overload,
job-relevant information, role clarity and fairness
ABSTRACT
If performance measurement systems are to be accepted by employees, they need to be perceived as clear and fair by the employees. There is much debate on whether the use of comprehensive performance measurement systems (CPMS), comprising both financial and nonfinancial measures, is clear and fair as such systems may be associated with increased information overload. This research investigates if CPMS increase information overload; and if information overload decreases role clarity and procedural fairness. It also investigates if CPMS are associated with increased job relevant information; and if job relevant information increases role clarity and procedural fairness. Based on a sample of responses from French managers, the Partial Least Squares results indicate that CPMS are positively associated with both information overload and job relevant information. However, while job relevant information is positively associated with both role clarity and procedural fairness, information overload is not associated with both role clarity and procedural fairness. These results suggest that CPMS enhance subordinates’ perceptions of clarity and fairness through increased job relevant information; and these effects are not neutralized by the detrimental effects of information overload.
Keywords: Comprehensive performance measurement systems, job relevant information, information overload, role clarity, procedural fairness.
INTRODUCTION
Recent research on performance measurement systems has focused increasingly on the use of a comprehensive set of measures (both financial and nonfinancial) as measures of organizational and employee performance. While the use of such comprehensive performance measurement systems (CPMS) is not new, the growing popularity of such systems has given rise to much debate on their merits and beneficial consequences (Fisher 1992; Ittner and Larcker 1998; Banker, Potter and Srinivasan 2000; Surysekar 2003; Lau and Sholihin 2005; Van der Stede, Chow and Lin 2006; Lau and Moser 2008).
Traditional performance measurement systems comprise primarily financial measures. CPMS comprise both financial measures and nonfinancial measures. CPMS such as the Balanced Scorecard (Kaplan and Norton, 1996, 2001) use nonfinancial measures as supplements to the traditional financial measures. However, Kaplan and Norton (1996, p.4) suggest that the Balanced Scorecard is “more than ad hoc collections of financial and nonfinancial measures.” They state that the Balanced Scorecard “should contain outcome measures and the performance drivers of those outcomes, linked together in cause and effect relationships”. They further suggest that the Balanced Scorecard should be linked to the corporate strategy and use as a means to communicate the corporate strategy to employees. Hall (2008, p.144) similarly define CPMS broadly as comprising three important characteristics including (a) providing a broad set of measures related to the important parts of the organization, (b) the integration of measures with strategy and valued organizational outcomes, and (c) the integration of measures across functional boundaries and value chain.
This research investigates the relationships between comprehensive performance measurement systems (CPMS) and two employee’s (subordinate’s) outcomes, namely, role clarity and procedural fairness. It proposes that CPMS are significantly related to subordinates’ perceptions of role clarity and procedural fairness. The research question is how these effects occur. Do CPMS affect subordinates’ perception of role clarity and procedural fairness through (a) job relevant information, or (b) information overload or (c) both job relevant information and information overload.
These relationships also address two other research questions relating to the use of comprehensive performance measures. The first is whether CPMS have functional effects. Specifically, do such systems significantly engender job relevant information; and whether job relevant information, in turn, has positive effects on employees’ perceptions of role clarity and procedural fairness. The other research question is whether CPMS have unintended dysfunctional consequences. Specifically, do such systems significantly affect information overload; and whether information overload, in turn, has negative effects on employees;’ perceptions of role clarity and procedural fairness. The empirical evidence pertaining to these two research questions would enable this research to ascertain if the beneficial effects of CPMS are neutralized by the
detrimental effects of such systems.
These research questions are important. Given the increasing popularity of CPMS systems among both management accounting researchers and practitioners, it may be timely and very useful to ascertain if the popularity of such systems can be justified based on a systematic evaluation of both their beneficial and detrimental consequences within a single model. There is considerable research evidence to support the contention that performance measurement systems can affect employee outcomes including employee attitudes and performance. Some such effects may be functional while others may be dysfunctional. It is therefore reasonable to suggest that most performance measurement systems may have both inherent functional and dysfunctional effects. Research to ascertain both the functional and dysfunctional effects of performance measurement systems may provide useful empirical evidence to assist practitioners in their choice of the optimal performance measurement systems for their organizations.
Recent management accounting studies have also paid increasing attention to the importance of explaining the mechanisms by which performance measurement systems affect employees’ outcomes through a number of intervening variables including psychological empowerment (Hall 2008), performance feedback (Hartmann and Slapnicar 2009), organizational justice (Burney, Henle and Widener 2009) and organizational politics (Lau and Scully, 2015). This present study therefore continues and complements
this steady stream of research by the inclusion of two intervening variables. The inclusion of information overload as an intervening variable may be particularly useful as this variable has not only not been studied previously in this research area, but it may also help to address the gap in the literature which has generally investigated the functional effects and overlook the negative consequences of performance measurement systems. For example, Burney and Widener (2007) found that strategic performance measurement systems had positive effects on role clarity through job-relevant information. However, their model does not consider if such positive effects are neutralized by any dysfunctional effects such as information overload which may affect role clarity negatively.
The two employee outcomes used in this research are (a) role clarity (ambiguity) and (b) procedural fairness. These two variables are used as they may be crucial in influencing employee judgments and acceptance of their organization’s performance measurement systems. A crucial component of an organization’s managerial control system is its performance measurement system. The design and the mechanisms by which the system measures, evaluates and rewards an employee’s performance may have profound effects on the employee’s attitudes and performance. Consequently, employeess are likely to be very sensitive to how their performance is measured and evaluated. The two key considerations of importance to employees are whether the measurement and evaluation criteria are (a) clear and unambiguous (role clarity), and (b) procedurally fair. Unless performance measurement systems are perceived by employees as clear and unambiguous and procedurally fair, they will not be accepted by employees and, hence, will not work.
Role clarity (ambiguity) is crucial because unless performance measurement systems are clear and unambiguous, they cannot measure employee performance in a meaningful manner. Rizzo, House and Lirtzman (1970, p. 151) contend that “(role) ambiguity should increase the probability that a person will be dissatisfied with his role, will experience anxiety, will distort reality and will thus perform less effectively” (parenthesis added). Similarly, unless performance measurement systems are perceived as procedurally fair, they will not be acceptable to employees. Kaplan and Atkinson (1998, 682) suggest as follows: “There are important behavioral considerations that performance measurement systems must reflect. First and above all, the individual must believe that the system is fair… absent this belief, the motivational potential of incentive compensation will be lost” (emphasis added).
Figure 1 depicts the mediation model used in this study. The first and fundamental premise is that a CPMS is positively related the two constructs of employees’ perceptions of job relevant information and information overload. Second, the model proposes that job relevant information is positively related to role clarity and procedural fairness. Next, the model proposes that information overload is related to role clarity and procedural fairness. Overall, the model suggests that a CPMS affects role clarity and procedural fairness. Some of the effects are indirect through an increase in job relevant information, which, in turn, improves role clarity and fairness perceptions.
_______________________ Insert Figure 1 here _______________________
HYPOTHESIS DEVELOPMENT
Comprehensive performance measurement systems and job relevant information (H1)
Kren (1992, p. 512) defines job relevant information as information “which helps a manager to improve his or her action choice through better-informed effort ... provide the manager with a better understanding of decision alternatives and actions needed to reach objectives”. He suggest that job relevant information can improve performance “because it allows more accurate predictions…gain specific insights into more effective approaches to complex projects”.
According to Hall (2008, p.144), a CPMS has three important attributes. First, it is a broad set of measures related to the important parts of the organization. Second, the measures are integrated across functional boundaries and value chain. Third, the measures are integrated with the organization’s strategy and with valued organizational outcomes. These three attributes of CPMS is likely to generate job relevant information.
First, a broad set of measures related to the important parts of the organization suggests that multiple measures are used. It seems reasonable that the use of multiple measures is likely to generate far more job relevant information for the users than the use of only a single or few measures (Feltham and Xie, 1994; Burney and Widener, 2007). The use of a broad set of measures is also likely to incorporate both financial and nonfinancial measures. Nonfinancial measures may be rich in job relevant information. Organizational activities are generally nonfinancial in nature. The use of nonfinancial measures to measure nonfinancial activities enhances the accuracies of measurement as it avoids the need to translate nonfinancial activities into financial measures. Nonfinancial measures also enable many nonfinancial activities, which are difficult to measure by financial measures, to be measured. Consequently, more job relevant information is likely to be generated when a broad variety of measures are employed in measurement systems.
Second, as a CPMS comprise measures that are integrated across different functional areas and across the value chain, the information generated by such measures is likely to be rich in content as the information is derived from diverse sources. This helps to align individual, organizational and cross-departmental initiatives to achieve common goals (Hall. 2008). Consequently, there is likely to be more job relevant information in such information.
Third, as a CPMS comprises measures that are integrated with the organization’s strategy and valued organizational outcomes., they are likely to contained more job relevant information because the measures that are integrated with the organizational strategy are not only rich in content, they are also forward looking containing information pertaining to the future which Kaplan and Atkinson (1998, p. 380) described as “drivers of future financial performance”. Kaplan and Atkinson (1998, p. 376) also suggest that a CPMS can be “a communication, informing, and learning system.” When measures are integrated with the organization’s strategy, the measures effectively articulate and communicate the organization’s strategy to the subordinates.
Finally, Burney and Widener (2007) suggest that performance measurement systems that are integrated with the organization’s strategy are not only a source of job relevant information, but they may also motivate employees to seek additional job relevant information. Their rationale is based on the premise that a CPMS clarifies cause-and-effect relations thereby improving employees’ commitments to organizational goals and the motivation to search for additional information to meet organizational goals. Accordingly, the following hypothesis is proposed:
H1: The use of a comprehensive performance measurement system is positively related to job relevant information.
Comprehensive performance measurement systems and information overload (H2)
Schick, Gordon and Haka (1990, p.199) define information overload as occurring “when the information processing demands on an individual’s time to perform interactions and internal calculations
exceed the supply or capacity of time available for such processing” (italics added). This imbalance between
the demand of time and the supply of time to process information may be caused by (a) the quantity of information available and (b) the diversity of information. Bawden et al. (1999, p.251, 252) suggest that “a major contributing factor, if not the only significant factor in information overload is too much
information.” Kock (2000, p. 258) suggest that “the number of information exchange interactions is one
of the antecedent of information overload”.
As discussed previously, a CPMS has a broad set of measures which are (1) related to the important parts of the organization, (2) integrated across functional boundaries and value chain, and (3) integrated with the organization’s strategy and with valued organizational outcomes (Hall, 2008). These characteristics suggest that a CPMS may be associated with a large quantity of information as well as a wide diversity of information, both of which are associated with information overload.
First, as a CPMS comprises a broad set of measures which are related to several important parts of the organization, a CPMS is likely to generate a large quantity of information. More importantly, as the measures are broad and are related to multiple parts of the organization, the information based on such measures are likely to be diverse. Bawden et al. (1999, p.251, 252) argue that “an increasing diversity of
information can also lead to overload…partly by virtue of a consequent increase in volume, information on
any given topic, may come from varying perspectives, but also because of an intellectual difficulty in fitting it within a cognitive framework appropriate for the use of the user.”
Second, as a CPMS comprises measures which are integrated across functional boundaries and
value chain (Hall, 2008), the information generated by such measures are likely to be substantial as well as
diverse as it incorporates information from several functional areas and various components of the organization’s value chain. As both the nature as well as the format of the information may vary across different functional areas, a disproportional amount of the user’s time may be needed to process and absorb such information.
Third, as a CPMS comprises measures which are integrated with the organization’s strategy and valued organizational outcomes, the information generated by such measures is likely to be substantial, very diverse and highly complex and sophisticated. Users are likely to find such information difficult to absorb and understand. Eppler et al. (2004, p.330) suggest that high frequency and high intensity of information are the cause of information overload. Consequently, the organizing, the processing and the absorption of CPMS information may be a very time consuming exercise for the users. Based on the above arguments, CPMS is likely to be positively associated with information overload. Accordingly, the following hypothesis is proposed
H2: The use of a comprehensive performance measurement system is positively related to subordinates’ perceptions of information overload.
Job relevant information and role clarity (H3)
Rizzo, House and Lirtzman (1970, p. 156) state that role clarity (ambiguity) is concerned with “certainty about duties, authority, allocation of time and relationships with others; the clarity or existence of guides, directives, policies”. They add as follows: “every position in a formal organizational structure should have a specified set of tasks or position responsibilities. Such specification of duties, or formal definition of role requirements, is intended to allow management to hold subordinates accountable for specific performance and to provide guidance and direction for subordinates.”
The primary influence on role clarity is the amount of information available to the subordinates. In this regard, Rizzo et al. (1970, p.151) argue that low role clarity (or high role ambiguity) is a state caused by “lack of the necessary information to a given organizational position.” (parenthesis added). Burney and Widener (2007, p.50) similarly argue that “the extent to which readily available information, a resource, is available to a manager can positively affect the extent to which managers understand their duties.” Since job relevant information refers to information which helps employees to understand decision alternatives
and actions to reach objectives Kren (1992), an increase in job relevant information is an increase in the
amount of information available to the employees, and consequently, is likely to enhance their role clarity.
When employees are provided with more information and feedback on their tasks, their responsibilities and how their tasks and roles are related and integrated, they are likely to have a greater understanding of their roles. Consequently their role clarity is likely to be enhanced. In this regard, Kren (1992, p.513) states that “JRI (job-relevant information) and role ambiguity are similar constructs in that the latter reflects the extent to which managers understand their duties and responsibilities while the former is a measure of the information available to managers to accomplish job-related tasks”. Accordingly, the hypothesis is as follows:
H3: Job relevant information is positively related to subordinates’ role clarity.
Job relevant information and procedural fairness (H4)
Job relevant information may be positively associated with procedural fairness. Procedural fairness refers to the perceived fairness of the technical aspects of procedures. Leventhal (1980) propose several fairness criteria. These include accuracy, consistency, suppression of bias, representation (participation), correctability (rights to appeal) and ethicality. Colquitt’s (2001) instrument to measure procedural fairness comprises seven items that address these fairness criteria.
Increased job relevant information is likely to be associated with increased procedural fairness for the following reasons. First, with a greater amount of job relevant information, information regarding the work environment (e.g., task completion, feedback, performance measurement and appraisals) is likely to be more complete and, hence, more accurate. Accuracy of information is a key fairness criterion. Employees are likely to perceive greater accuracy in the information content of their roles, their tasks and their responsibilities. Second, job relevant information refers to the provision of task related information and task related feedback to enable employees to have a better understanding of their tasks, their responsibilities and how their tasks and roles are integrated with the other parts of the organization (Kren (1992). With increased understanding of their tasks and task related responsibilities, employees are likely to be more informed and hence are in a much better position to participate and be involved in decision affecting their tasks and job responsibilities. Increased participation by employees in the organization decision making process is a key determinant of increase perception of procedural fairness. Third, when employees have an increased amount of job relevant information and hence are better informed, they are likely to be in a much stronger position to prevent the attempts of others to gain advantage by unfair means. They are also in a better position to identify bias, inconsistencies and any unethical acts on the parts of others. Lau and Amirthalingam (2014, p.94) suggest that “by engendering a greater understanding of tasks and work situations among employees, job-relevant information exposes the organizational decision-making processes to scrutiny and hence reduces dishonesty and secrecy’. When such situations occur, they are also in a better position to seek the means to appeal and correct such unfair acts of others. These are likely to result in a perception of greater procedural fairness among the employees. Overall, this discussion suggests that when employees have access to a greater amount of job relevant information, they are likely to perceive greater procedural fairness in their workplace.
H4: Job relevant information is positively related to subordinates’ procedural fairness.
Information overload, role clarity and procedural fairness (H5 and H6)
As information overload is associated with more information than the capacity of the user to process, it may have negative outcomes. Eppler and Mengis (2004 p.326) observe that “the performance of an individual correlates positively with the amount of information he or she receives up to a certain point. If
further information is provided beyond this point…the burden of a heavy information load will confuse the individual, affect his or her ability to set priorities and make prior information harder to recall”. Klapp (1986) suggests that “a large amount and high rate of information act like noise when they reach overload, a rate too high for the receiver to process efficiently … increasing error and other costs making information poorer”. Schneider (1987, p. ???) similarly argue that with information overload, “the inability to process information creates a situation of self-generating escalation as it increases the inability to select out the relevant information and subsequently increases the distraction by irrelevant and interfering cues…this failure to establish and act upon priorities results in competing response tendencies and increases goal conflict… goal direction and unity of effort begin to falter contributing to the loss of coordination and control”
Information overload may therefore have the potential to influence role clarity. Kahn, Wolfe, Quinn, Snoek and Rosenthal (1964) found that when organizational complexities exceed the capacity of employees to comprehend their work situations, employee role clarity may decrease. Since low role clarity may have negative consequences, it may ultimately be associated with perceptions of low procedural fairness in the workplace.
The literature on information overload is, however, equivocal on the effects of information load on employee outcomes. While the above discussion suggests that information overload may be associated with detrimental consequences (Kahn, Wolfe, Quinn, Snoek and Rosenthal, 1964; Rizzo et al., 1970, Eppler and Mengis, 2004), other researchers have argued that information overload may not necessarily be associated with negative consequences (Butcher, 1998; Edmunds and Morris, 2000; Kock, 2000). Bawden Holtham and Courtney (1999, pp.250-251) argue as follows: “information overload has been a phenomenon noted for a considerable time and treated as an increasingly serious difficulty for information provision…However, it should be noted that there has always been a countervailing view that overload is an exaggerated difficulty, one is overload to the extent that one wishes to be overloaded”. Butcher (1998, 53-54) similarly states that the main reasons why managers obtain collect so much information is “to indicate a commitment to rationalism and competence which they believe improves decision making. They seek information to check out the information already acquired; they need to be able to demonstrate justification of decisions.” Finally, Connolly (1977) suggests that “an individual would need to gather more information than strictly necessary to reach some given level of confidence.”
On an empirical basis, Kock (2000, p.262) found that there is no clear relationship between information overload and the efficiency or quality of tasks. O’Reilly, III (1980) results indicate that subjects who are comparatively overloaded with information expressed greater satisfaction with both the job and communication in general which demonstrate that information overload is not necessarily dysfunctional. According to him (1980, 688-689), “participants in organizations…are usually pursuing a number of tasks simultaneously. It is not always clear what information will be needed or when it might be needed. Hence, the nature of the job may require incumbents to gather large amount of information with the possibility that a portion of it might important at some future time. This may result in a tendency to ask for more information than is strictly needed in an effort to avoid mistakes and reduce uncertainty.” Based on the discussion above, it appears that there is no clear and unequivocal evidence in the literature to suggest that information overload is negatively associated with employees’ outcomes including perceptions of role clarity and procedural fairness. Accordingly, the hypotheses in relation to the two employee outcomes investigated in this research are as follows:
H5: Information overload is not related to subordinates’ role clarity.
H6: Information overload is not related to subordinates’ perceptions of procedural fairness.
As discussed previously, procedural fairness is based on several fairness criteria including accuracy, consistency, suppression of bias, representation (participation), correctability (rights to appeal) and ethicality. With high role clarity, that is, when managers have a clear understanding of their roles in their organizations, are certain about their duties, authority, allocation of time and relationships with others (Rizzo et al., 1970), they are likely to perceive their work situations in a favorable manner. Consequently, they are likely to perceive their organization’s systems and procedures as accurate. Moreover, in organizational settings with clarity or existence of guides, directives, policies to guide actions and decisions, inconsistencies, bias and unethical behavior are likely to be highly visible and easily detected. Consequently, managers are also likely to perceive consistency in the application of systems and procedures and the suppression of bias and unethical behavior in their workplace. Perceptions of procedural fairness is therefore likely to be high. The hypothesis is as follows:
H7: Role clarity is positively related to subordinates’ perceptions of procedural fairness.
Mediating effects of job relevant information and information overload
The discussions in the prior sections suggest that job-relevant information and information overload may mediate the relationships between (a) CPMS and role clarity and (b) between CPMS and procedural fairness. Hair, Hult, Ringle and Sarstedt (2014, 222) state that the tests for mediation should answer this question “ Is the indirect effect via the mediator variable significant after this variable has been include in the PLS path model?” Since Hypothesis H1 states that CPMS is related to job-relevant information and Hypothesis H2 states that job relevant information is related to both role clarity and procedural fairness, the following hypotheses are proposed:
H8a: The relationship between CPMS and role clarity is significantly mediated by job-relevant
information.
H8b:The relationship between CPMS and procedural fairness is significantly mediated by
job-relevant information.
Hair et al. (2014, 223) state path coefficients must be significant for mediation to be considered significant. As the discussions in the prior sections suggest that information overload may not be related to role clarity and procedural fairness, the following hypotheses are proposed:
H9a: The relationship between CPMS and role clarity is not significantly mediated by
information overload.
H9b:The relationship between CPMS and procedural fairness is not significantly mediated by
RESEARCH METHOD Sample selection and data collection
An online questionnaire survey along with emails was used for data collection. The sample includes 174 managers (employees with managerial responsibilities) located in Paris and the surrounding districts. These managers had recently completed an Executives Master course at a French university located in Paris.
The participants were assured that all responses will be treated in the strictest confidence and that the questionnaire needed about 15 minutes to be filled. The questions were designed to be answered by managers from any functional areas. As the measurement instruments used in the questionnaire were originally developed in the English language, there was a need to translate them into the French language. This involved three steps. First, the English version was translated into French by one of the researchers who is a French national, fluent in English and employed as an academic in Sorbonne Graduate Business School. Second, the French version was translated back into English by a professional translator who is a native English speaker. Third, the translated English version was compared with the original English version to resolve some minor differences and amendments were made to the French version. The amended French version was used for the survey.
Two months after the first email to the managers, a follow-up email was sent to each manager and a second follow-up email another month later. For the 174 managers contacted, a total of 84 questionnaires were filled. However, only 54 responses are useable because the other did not complete the focal items fully. This constitutes a response rate of 31 percent which compares very favourably with the usual low response rate of most online surveys not only in France but elsewhere for accounting research involving employees with managerial responsibilities. It is estimated in Survey Monkey that a response rate of 30% may be considered as satisfactory..
The demographic data are as follows. The mean age is 37; the participants have a mean of 5.6 years of experience in their current areas of responsibility and a mean of 20.6 employees under their responsibility. These demographic characteristics indicate that the respondents were generally experienced managers from various functions and had responsible positions in their organizations.
Measurement of variables
Comprehensive performance measurement system: The instrument for this variable was developed by Hall
(2008). It comprises nine items. Four of these items were derived from an instrument developed by Chenhall (2005). The other five were developed by Hall (2008). The items relate to the extent to which the performance measurement systems provide a variety of information (financial and nonfinancial) that influence the respondent’s’ action. This instrument was selected over other instruments (e.g., Hoque and James, 2000) that rely on specific performance measures which may not be used by the respondents’ organizations.
Information overload: This variable was measured by an instrument developed by Robert and O’Reilly,
III (1974) and also used by O; Reilly, III (1980). The instrument comprises three items on a 7-point Likert scale. Respondents were required to state the frequency to which they had more information than they could handle; the frequency to which overload of information arose; and the frequency to which the information they receive was more than enough to meet their information requirement.
Job relevant information: The instrument for this variable was developed by Kren (1972) and used by prior
management accounting research including Burney and Widener (2007) and Leach-Lopez, Stammerjohan and McNair (2007). It has three items. Respondents were required to state if they had adequate information to make optimal decisions, able to obtain strategic information necessary to evaluate important decisions, and if they were clear about what was necessary to perform well on their jobs.
Role clarity (ambiguity): This variable was measured by the instrument developed by Rizzo, House, and
Lirtzman (1970). It has been used extensively in prior organizational research (Jackson and Schuler, 1985; van Sell Brief and Schuler, 1981). It comprises six items. Respondents were required to indicate if they have clear job goals and objectives, explanations, responsibilities expectations and authority.
Procedural fairness: The procedural fairness literature suggests that procedural fairness may be influenced
by the technical aspect of procedures (e.g., freedom from bias, accuracy, representative) as well as the interpersonal aspect of procedures (whether individuals are treated politely and with dignity). As this research investigates the cognitive and information aspect of performance measurement systems, measuring the technical aspect of procedural fairness is more relevant than the interpersonal aspect of procedural fairness. Consequently, the instrument developed by Colquitt (2001) was chosen over other instrument as it was designed to capture the technical aspects of the procedures rather than the interpersonal nature of the procedures. It comprises seven items. Respondents were required to state the extent to which they were able to express their views, have influence over their performance evaluations, able to appeal the outcomes, and if the procedures used were applied consistently, free from bias, based on accurate information, upheld ethical and moral standards.
RESULTS
Data analysis is based on structural equation modelling (SEM). SEM techniques include (a) covariance-based SEM (CBSEM) technique (e.g., AMOS), and (b) variance-based techniques as represented by Partial Least Square (PLS). As these two families of SEM are complementary rather than competitive, the choice may be based on the specific research situation.
As our sample comprise 54 useable responses, we select PLS for hypothesis testing because it is based on minimal assumptions about the data distribution and sample size and hence is more appropriate for our data set (Henseler et al. 2009; Lohmoller 1989; Wold 1985). According to Henseler, Ringle and Sinkovics (2009, p.297), the PLS technique has the ability to estimate path models when sample sizes are small and when distributions are highly skewed or the independence of observations is not assured. They state as follows: “although the CBSEM and PLS path modelling methodologies differ from a statistical point of view, PLS estimates may represent good proxies of the CBSEM results. If CBSEM premises are violated, such as distributional assumptions, minimum sample size, or maximum model complexity, …PLS path modelling may represent a reasonable methodological alternative for theory testing.” The PLS technique has also been widely used in marketing as well as in management accounting research (e.g., Hall, 2008; Hartmann and Slapnicar, 2009; Lau and Scully, 2015). This technique uses a measurement model and a structural model.
Measurement model
The measurement model explains the relationships between observed items and latent variables. It is useful for evaluating individual item reliability, internal consistency reliability, convergent validity and discriminant validity for all constructs.
Individual item reliability is assessed first based on the individual item’s outer (factor) loadings. For individual item reliability to be considered as satisfactory, an outer loading of greater than 0.708 is needed for each item of the construct as low outer loadings add very little to the explanatory power as well as potentially biasing the estimates of the parameters linking the constructs (Chin, 1998; Hulland, 1999). The threshold of 0.708 (rounded to 0.7) is based on the premise that the latent variable should explain at least 50 percent of each indicator’s variance (0.7082 = 0.5)(Hair et al. 2014, p.107).
The results of the initial measurement model based on all 28 items indicate that the outer loadings for five items are below 0.7. These five items include one item from information overload (IOL 2), one item from role clarity (RC3), and three items from procedural fairness (PF, 4, PF5, PF6). Hair et al. (2014)
suggest that indicators with weaker outer loadings should generally be dropped. Consequently, these items are removed from further analysis. The results of the second measurement model indicate that the outer loadings of the remaining 23 items are in excess of 0.7 except for one item for the role clarity. This item (RC6) has an outer loading of 0.680 which is very close to meeting the acceptable threshold of 0.7. Consequently all remaining items are retained for further analysis. This leaves the study with 23 items for the five constructs including CPMS (9 items), job relevant information (3 items), information overload (2 items), role clarity (5 items), and procedural fairness (4 items). Table 1 presents the outer loadings of the measurement model for these 23 items. The results indicate that the outer loadings are between 0.680 and 0.934. Hair et al. (2014, 102) state that all outer loadings should also be statistically significant. The results in Table 1 indicate that all outer loadings are statistically significant at 0.001.
_______________________ Insert Table 1 here _______________________
The internal consistency reliability of each construct is evaluated next based on both the Cronbach’s alpha and the composite reliability. Table 1 indicates that the Cronbach’s alphas for all constructs are well above the recommended threshold of 0.7 (0.851 to 0.956) except for information overload which is 0.592. While the Cronbach’s alpha of 0.592 is not too far from the threshold, it is nevertheless important to assess the internal consistency reliability again based on the composite reliability of the constructs. Table 1 indicates that the results for the composite reliability are all well above the recommended threshold of 0.7 (Vandenbosch. 1996; Hair et al. 2014). They range between 0.899 and 0.962. The composite reliability for information overload is 0.826 which well cleared of the 0.7 threshold. Overall, these results suggest that internal consistency reliability is satisfactory for all constructs.
Convergent validity is assessed next. The assessment is based on the average variance extracted (AVE) which is defined as “the grand mean value of the squared loadings of the indicators associated with the construct.” (Hair et al. 2014, p.101). The recommended threshold for AVE is 0.5. According to Hair et al. (2014, p.101), an AVE value of 0.50 or higher indicates that, on average, the construct explains more than half of the variance of its indicators.” The results in Table 1 indicate that the AVEs are well above 0.5 for all constructs. They range between 0.692 and 0.792. These results suggest that convergent validity of the construct is satisfactory.
_______________________ Insert Table 2 here _______________________
Finally, discriminant validity is assessed. Hair et al. (2014, 105) define discriminant validity as “the extent to which a construct is truly distinct from other constructs by empirical standards.” Two tests are used to assess this form of validity. The first test involves an examination of the outer loading for cross loadings of the indicators. For discriminant validity to occurs, Hair et al (2014) suggest that the outer loading of an indicator on its construct should be greater than all its loadings on the other constructs. The results in Table 2 indicate that the outer loadings (in bold) for each indicator on its construct are greater than all its other outer loadings on all the other constructs. These results indicate the absence of any cross loading. In addition, a second test known as the Fornell-Larcker test is also undertaken. This test involves a comparison of the square roots of the AVEs of each construct with the latent variable correlations. The results for this test presented in Table 3 indicate that the square roots (in bold) of the AVEs of all constructs are greater than the correlations of the associated latent variables. Based on the results of the two tests, the discriminant validity for all constructs is satisfactory.
_______________________ Insert Table 3 here _______________________
Structural model
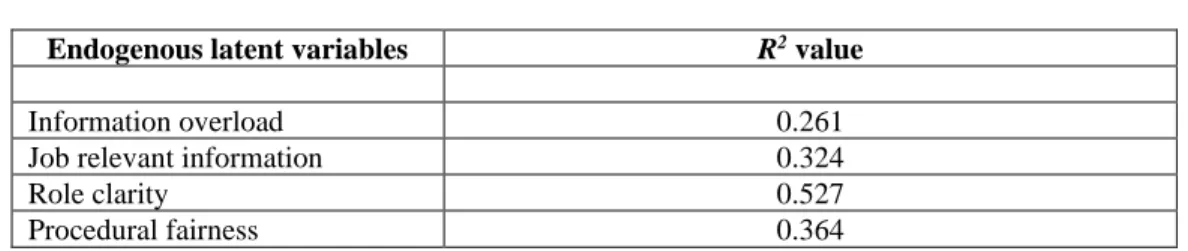
The structural model results are presented and interpreted next. This model assesses relationships between latent constructs. The results are evaluated as follows. The coefficients of determination (R2) (Urbach and Ahlemann 2010) are assessed first. The R2 is based on the relationship between a latent construct’s explained variance and its total variance (Chin 1998; Ringle and Hansmann 2004). It is a prediction-oriented measure which depicts the predictive power of the structural model. The results of the coefficient of determination (R2) are presented in Table 4. They indicate that the R2 for role clarity as explained by CPMS, job relevant information and information overload is 52.7%. The R2 for procedural fairness as explained by CPMS, job relevant information, information overload and role clarity is 36.4%. These results indicate a relatively strong result (Cohen 1988; Ringle and Hansmann 2004) and compares favorably with other management accounting studies of around 15% (e.g., Emsley 2005; Kren 1992; Mia and Chenhall 1994)..
_______________________ Insert Table 4 here _______________________
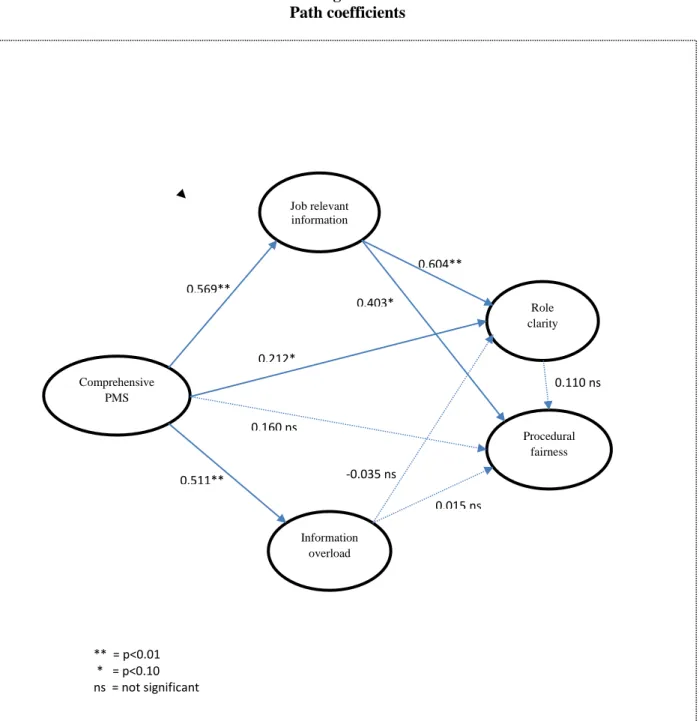
The strength and direction of the path coefficients between the latent variables are evaluated next. Path coefficients represent the hypothesized relationships among the constructs (Hair et al. 2014). The statistical significance of the path coefficients is assessed based on their empirical t-values which are obtained by a bootstrapping routine with PLS. Following the suggestion of Hair et al. (2014) that the number of observations for each bootstrap sample should be equal to the original sample, the number of bootstrap cases is equal to the 54 valid observations of our research. The 5,000 subsamples recommended by Hair et al. (2014) to ensure stability of results are also used for the bootstrapping routine. The t-statistics results are presented in Table 5. The p-value for each path coefficient is derived from the table of critical values and presented in both Table 5 and Figure 2.
_______________________ Insert Figure 2 and Table 5 here
_______________________
First, the relationship between CPMS and role clarity is assessed (see Panel A in Table 5). The results in Figure 2 and Table 5 indicate that the link between CPMS and role clarity is 0.212 and marginally significant at p-value < 0.10. CPMS therefore has a direct effect on role clarity.
Next, the indirect effects are evaluated. For the relationship between CPMS and job relevant information, the path coefficient is positive at 0.569 and significant (p-value<0.01). Job relevant information, in turn is significantly related to role clarity (p=0.604, p-value<0.01). The indirect effect is 0.343 computed as (0.569 x 0.604). Based on the Sobel test, the result in Table 6 indicates that this indirect effect is highly significant at p-value<0.001. These results indicate that CPMS has both direct effect as well as an indirect effect (via job relevant information) on role clarity.
_______________________ Insert Table 6 here _______________________
For the relationship between CPMS and information overload, the path coefficient is 0.511 and is significant at p-value<0.01. However, for the relationship between information overload and role clarity, the path coefficient is only -0.035 and is not significant. The indirect effect is a mere -0.018 computed as (0.511 x -0.035) and is not significant (p<0.389, Sobel test). These results highlight the differences in the impact of CPMS on role clarity through the two mediating variables. Hence, while CPMS has significant and positive impact on both job relevant information and information overload, only job relevant information has an effect on role clarity. This means that CPMS enhances job relevant information which helps to improve role clarity. In contrast, while CPMS also increases information overload, the increase in information overload does not translate into a decrease in role clarity. In other word, the beneficial effects of CPMS in improving subordinates’ role clarity by the generation of a greater amount of job relevant information are not neutralized by the effects of the increase in information overload.
With respect to procedural fairness, the relationship between CPMS and procedural fairness (see Panel B in Table 5) is not significant (p= 0.160). CPMS therefore has no significant direct effect on procedural fairness. However, the results indicate that job relevant information has a positive and significant effect on procedural fairness (p=0.403, p-value<0.05). Hence, the indirect effect of CPMS on procedural fairness is 0.229 computed as (CPMS-JRI-PF = 0.569 x 0.403). Based on the Sobel test, the result in Table 5 indicates that this indirect effect is significant at p-value<0.029.
With regard to the indirect effects via information overload, the results in Figure 2 and Table 5 indicate that the relationship between information overload and procedural fairness is a mere 0.015 and is not significant. Similarly, the indirect effect of CPMS on procedural fairness via information overload is a negligible 0.008 computed as (CPMS – IOL – PF = 0.511 x 0.015) and is not significant at p-value<0.456 (see Table 6). These results indicate that the effects of CPMS on procedural fairness are indirect via job relevant information. They also indicate that while CPMS increases job relevant information which, in turn, improves procedural fairness, these beneficial effects of CPMS on procedural fairness are not offset by the increase in information overload which does not significantly affect procedural fairness.
CONCLUSION
This study investigates the mechanisms by which CPMS affect subordinates’ perceptions of role clarity and procedural fairness. The primary purpose is to ascertain the mediating roles of job relevant information and information overload in the relationships between CPMS and role clarity and procedural fairness.
The main contribution of the research is the incorporation of an important element that has not been previously considered systematically by prior work. While there have been much prior research in this area, the studies have generally focused on the beneficial consequences of CPMS with little attention directed at the dysfunctional consequences of CPMS. Research that is based only on the beneficial consequences of CPMS without due consideration for potential dysfunctional effects may be less complete and unbalanced. Since CPMS are far more complex than traditional performance measurement systems that are based mainly on financial measures, one area that needs to be systematically investigated is the issue of whether the complexities of CPMS may be associated with information overload for the users of such systems. An investigation on both the beneficial and dysfunctional consequences of using CPMS may provide more balanced and more complete answers in the understanding of the consequences of using performance measurement systems that deviate from and are far more complex than traditional performance measurement systems.
For performance measurement systems to be effective, they need to be accepted by the subordinates. For subordinates to accept their organizations’ performance systems, they need to perceive such systems as clear and fair. If performance measurement systems are unclear, they can cause confusion. If performance measurement systems are perceived as unfair, they can cause mistrust. A lack of clarity or fairness may lead to a rejection of the performance measurement systems. Consequently, clarity and fairness are key elements of effective performance measurement systems.
This research therefore addresses these two key elements of performance measurement systems. The key research questions are as follows. First, does a CPMS engender increased job relevant information; and does increased job relevant information enhance subordinates’ perceptions of role clarity and procedural fairness. Second, does a CPMS engender information overload and does increased information overload lower the subordinates’ perceptions of role clarity and procedural fairness.
The results are as follows. CPMS are positively associated with job relevant information which, in turn, is associated with increases in both role clarity and procedural fairness. CPMS are also positively associated with increased information overload. However, unlike job relevant information, increased information overload is not associated with both role clarity and procedural fairness. Overall, these results indicate the beneficial effects of CPMS in improving subordinates’ perceptions of role clarity and procedural fairness (through improvement in job relevant information) are not offset by the detriment effects of information overload which does not significantly affect role clarity and procedural fairness.
At a practical level, these findings suggest to practitioners that the use of CPMS can have profound effects on employees’ outcomes including increases in job relevant information and information overload. Hence, organizations should not approach their choice of performance measures solely from the organizational perspective, but also from their employees’ perspectives. Practitioners may need to assess the effects of such outcomes on their employees’ reactions. As far as subordinates’ perceptions of role clarity (ambiguity) and procedural fairness are concerned, practitioners should be aware that job relevant information and information overload may affect these two outcomes differently. This investigation indicates that while job relevant information can have positive outcomes in term of improved role clarity and improved procedural fairness, information overload may not be as detrimental to role clarity and procedural fairness as previously thought. Most importantly, this research demonstrates to practitioners that CPMS do have beneficial consequences and these beneficial consequences are not offset by information overload which has generally been advocated by some as a reason for not to implement CPMS in their organizations.
From a theoretical perspective, this research contributes to the performance evaluation systems literature in several ways. First, it contributes by informing the current debate on the beneficial and
detrimental effects in the use of CPMS for employee performance evaluations. Second, the research also adds to the current understanding of the mediating roles of various mediating variables (e.g., feedback, job relevant information, psychological empowerment, participation) in the relationships between performance measurement systems and employees’ reactions. Third, our research provides new insights into the mechanisms by which CPMS influence employees’ reactions through a previously unexplored construct, namely, information overload. Fourth, the lack of significant findings for the relationship between information overload and the two employee outcomes (role clarity and procedural fairness) demonstrates that information overload may not always lead to negative outcomes. More research may be beneficial to identify which variables and under what circumstances would information overload be detrimental to employee outcomes.
This research is limited in scope. Even though the model used is relatively complex, the research has focused on two main relationships, namely, the CPMS and role clarity relationship and the CPMS and procedural fairness relationship. Additionally, two mediating variables – job relevant information and information overload – are included. It is therefore possible to omitted variables may influence the results of this research. The research is also based on the mailed survey method. Consequently, the results may be influenced by the inherent limitations associated with the survey method. Finally, as the sample of this research is based on a sample collected in France, the results may be influenced by the innate French culture. Despite these limitations, this research does make a contribution to the performance measurement systems literature. In particular, it contributes with systematic empirical evidence to demonstrate how an innovative and popular form of performance measurement system influences role clarity and procedural fairness which are key elements of successful performance measurement systems. It is able to demonstrate that CPMS affect not only job relevant information, but also information overload. More importantly, the overall result is surprising as the effects of CPMS on role clarity and procedural fairness through information overload is not as obvious as some might intuitively believe.
REFERENCES
Bawden, D., Holtham, C. and N.C. Courtney (1999)..IPerspectives on information overload. ASLIB Proceedings 51, (8) 249-255.
Burney, L.L, & Widener, S.K. (2007). Strategic performance measurement systems, job relevant information and managerial behavioral responses - Role stress and performance. Behavioral Research in Accounting, 19, 43- 69.
Burney, L.L, Henle, C.A., & Widener., S.K. (2009). A path model examining the relations among strategic performance measurement system characteristics, organisational justice and extra- and in-role performance.
Accounting, Organisations and Society, 34(3-4), 305-321
Butcher, H 1998 Meeting Managers’ information needs, Aslib, London.
Chin, W.W. (1998). Issues and opinion on structural equation modelling. MIS Quarterly, 22:1, vii–xvi.
Cohen, J. 1988. Statistical Power Analysis for the Behavioural Sciences (2nd ed.). Hillsdale,NJ: Lawrence Erlbaum. Colquitt, J.A. (2001). On the dimensionality of organizational justice: a construct validation of a measure. Journal
of Applied Psychology. 86(3), 386-400.
Connolly, T. 1877 Information processing and decision making in organization. In B. Staw and G. Salancik (Eds) New Direction in Organizational Behavior, Chicago, St Clair 205-234 1977
Edmunds, A. and A. Morris, 2000. The problem of information overload in business organizations. A review of th literature. International Journal of Information Management 20 1 17-28
Emsley, D. (2005). Restructuring the management accounting function: A note on the effect of role involvement on innovativeness. Management Accounting Research 16(2), 157-77.
Eppler, M. and J. Mengis (2004) The concept of information overload: A review of the literature from organization science, accounting, marketing, mis and related discipline. The Information Society 20, 5 325-344
Fisher, J. (1992). Use of nonfinancial performance measures. Journal of Cost Management, Spring, 31-38.
Fornell, C., & Larcker, D.F. (1981). Evaluating structural equation models with unobservable variables and measurement error. Journal of Marketing Research, 18, 39–50.
Hair, J.F., Hult, G.T.M., Ringle, C.M., and Sarstedt, M. 2014. A Primer on Partial Least Squares Structural
Equation Modeling (PLS-SEM). Thousand Oaks, CA: Sage.
Hall, M. (2008). The effect of comprehensive performance measurement systems on role clarity, psychological empowerment and managerial performance. Accounting, Organizations and Society 33, 141–163.
Hartmann, F., and Slapnicar, S. (2009), “How formal performance evaluation affects trust between superior and subordinate managers”, Accounting, Organizations and Society, 34, 722-737.
Henseler, J., C. Ringle, and. R. Sinkovics. 2009. The use of Partial Least Squares path modelling in international marketing. Advances in International Marketing, 20: 277-319.
Ittner, C.D., Larcker, D.F., and Randall, T. (2003). Performance implications of strategic performance measurement in financial services firms. Accounting, Organizations and Society 28, 715-741.
Jackson, S., and Schuler, R. (1985), “A meta-analysis and conceptual critique of research on role ambiguity and role conflict in work settings”, Organizational Behaviour and Human Decision Processes, 36, 16-78. Kahn, R., Wolfe,D. Quinn, R. Snoek, J. and Rosenthal, R. (1964), Organizational Stress: Studies in Role Conflict
and Ambiguity. New York: John Wiley & Sons Inc.
Kaplan, R., and A. Atkinson. 1998. Advanced Management Accounting. USA: Prentice Hall.
Kaplan, R.S., & Norton, D. (1996). The Balanced Scorecard: Translated Strategy into Action. Boston, Harvard Business School Press.
Kock, N. (2000) Information overload and worker performance: A process-centered view. Knowledge and Process Management 4, 256-264.
Kren, L. (1992). Budgetary participation and managerial performance: the impact of information and environment volatility. The Accounting Review 67(3), 511-26.
Lau and Amirthalingam
Lau, C., & Scully, G. (2015). The roles of organizational politics and fairness on the relationship between management control system and trust. Behavioral Research in Accounting 27(1), 25-53.
Lau, C.M., & Moser, A. (2008). Behavioral effects of nonfinancial performance measures: the role of procedural fairness. Behavioral Research in Accounting 20(2), 55–71.
Lau, C.M., and Sholihin, M. (2005). “Financial and nonfinancial measures: how do they affect job satisfaction?”,
Leach-Lopez, M.A., Stammerjohan, W. & McNair, F.M. (2007). Differences in the role of job relevant information in the budget participation-performance relationship among US and Mexican managers: A question of culture or communication? Journal of Management Accounting Research, 19, 105-136.
Leventhal, G.S., 1980. What Should Be Done With Equity Theory? New Approaches to the Study of Fairness in Social Relationships. In Social Exchanges: Advances in Theory and Research, edited by K. Gergen, M .Greenberg, and R. Willis, 257-55. New York; Plenum Press
Lohmoller, J. (1989). Latent Variable Path Modeling with Partial Least Squares. Heidelberg, Germany: Physica-Verlag.
Mia, L. and R.H. Chenhall. 1994. The usefulness of management accounting system, functional differentiation and managerial effectiveness. Accounting, Organizations and Society, 19(1): 1-13.
O’ Reilly III, C.A. 1980. Individuals and Information Overload in Organizations: Is More Necessarily Better?
Academy of Management Journal, 1980, Vol. 23 (4) pp. 684-696.
Ringle, C.M.,and K.W. Hansmann. 2004. SmartPLS Manual. University of Hamburg, Hamburg.
Rizzo, J., House, R. and Lirtzman, S. (1970), “Role conflict and role ambiguity in complex organisations”,
Administrative Science Quarterly, 15, pp. 150-163.
Robert, K and O’ Reilly III, C. 1974 measuring organizational communication Journal of Applied Psychology 59 321-326
Schick. A., Gordon, L and S. Haka. (1990). Information overload: A temporal Approach. Accounting, Organizations
and Society 15(3), 199-220.
Schneider, S.C. 1987 Information overload: Causes and consequences. Human Systems Management 7: 143-153. Urbach, N., and F. Ahlemann. 2010, Structural equation modeling in information systems research using partial least
squares. Journal of IT Theory & Application, 11(2): 5-40.
van Sell, M., Brief, A and Schuler, R. (1981), “Role conflict and role ambiguity: integration of the literature and directions for future research”, Human Relations, 34(1), 43-71.
Vandenbosch, B. 1996. Information acquisition and mental models: An investigation into the relationship between behaviour and learning. Information Systems Research, 7(2): 198-214.
Wold, H. (1985). Systems analysis by partial least squares. In Nijkamp, P., Leitner, H., and Wrigley, N. (Eds.),
Figure 1
Conceptual model and hypotheses
Procedural fairness Comprehensive PMS Role clarity Job relevant information Information overload H4 H7 H3 H2 H6 H1 H = Hypothesis H9 H5 H8
Figure 2 Path coefficients Procedural fairness Comprehensive PMS Role clarity Job relevant information Information overload 0.511** -0.035 ns 0.569** 0.160 ns 0.403* 0.212* ** = p<0.01 * = p<0.10 ns = not significant 0.110 ns 0.604** 0.015 ns
Table 1
Estimation of the measurement parameters Outer loadings Outer model t-statistic p-value Cronbach’s alpha Composite reliability Average variance extracted
Comprehensive performance measurement system (CPMS)
CPMS1 0.790 10.825 0.001 CPMS2 0.828 15.009 0.001 CPMS3 0.889 31.860 0.001 CPMS4 0.861 24.283 0.001 CPMS5 0.934 54.181 0.001 CPMS6 0.872 24.063 0.001 CPMS7 0.922 44.579 0.001 CPMS8 0.811 11.418 0.001 CPMS9 0.823 13.651 0.001 0.956 0.962 0.741 Information overload(IOL) IOL1 0.779 7.970 0.001 IOL3 0.895 17.934 0.001 0.592 0.826 0.705
Job relevant information (JRI)
JRI1 0.873 20.974 0.001 JRI2 0.897 27.124 0.001 JRI3 0.898 37.756 0.001 0.868 0.919 0.792 Role clarity(RC) RC1 0.929 53.697 0.001 RC2 0.814 13.031 0.001 RC4 0.843 18.675 0.001 RC5 0.890 29.887 0.001 RC6 0.680 7.461 0.001 0.888 0.920 0.699 Procedural fairness(PF) PF1 0.894 29.986 0.001 PF2 0.834 16.187 0.001 PF3 0.802 9.305 0.001 PF7 0.793 13.475 0.001 0.851 0.899 0.692
Table 2 Cross-loadings
CPMS IOL JRI RC PF
Comprehensive performance measurement system (CPMS)
CPMS1 0.790 0.332 0.265 0.203 0.196 CPMS2 0.828 0.495 0.394 0.314 0.412 CPMS3 0.889 0.467 0.542 0.531 0.439 CPMS4 0.861 0.432 0.501 0.463 0.562 CPMS5 0.934 0.444 0.590 0.534 0.469 CPMS6 0.872 0.494 0.562 0.619 0.377 CPMS7 0.922 0.512 0.556 0.518 0.328 CPMS8 0.811 0.349 0.443 0.437 0.362 CPMS9 0.823 0.373 0.417 0.372 0.272 Information overload(IOL) IOL1 0.360 0.779 0.308 0.187 0.296 IOL3 0.484 0.895 0.511 0.413 0.284
Job relevant information (JRI)
JRI1 0.372 0.383 0.873 0.657 0.364 JRI2 0.598 0.471 0.897 0.595 0.559 JRI3 0.524 0.479 0.898 0.640 0.594 Role clarity(RC) RC1 0.529 0.375 0.668 0.929 0.555 RC2 0.466 0.384 0.545 0.814 0.453 RC4 0.370 0.176 0.582 0.843 0.409 RC5 0.434 0.281 0.558 0.890 0.322 RC6 0.430 0.349 0.588 0.680 0.232 Procedural fairness(PF) PF1 0.448 0.309 0.507 0.389 0.894 PF2 0.456 0.209 0.418 0.383 0.834 PF3 0.265 0.333 0.516 0.529 0.802 PF7 0.348 0.276 0.477 0.304 0.793
Table 3
Discriminant validity coefficients
CPMS IOL JRI RC PF CPMS 0.861 IOL 0.512 0.840 JRI 0.569 0.318 0.890 RC 0.537 -0.033 0.593 0.836 PF 0.456 0.009 0.472 0.109 0.832
Table 4 Results of R2 values
Endogenous latent variables R2 value
Information overload 0.261
Job relevant information 0.324
Role clarity 0.527
Table 5 Path coefficients Hypotheses Paths Path coefficients Standard error t-statistic p-value (1-tailed) p-value (2-tailed) Panel A (CPMS – RC) 1 CPMS - RC 0.212 0.129 1.640 0.05 0.10 3 CPMS - JRI 0.569 0.088 6.431 0.01 0.01 4 CPMS - IOL 0.511 0.098 5.229 0.01 0.01 5 JRI - RC 0.604 0.128 4.719 0.01 0.01 7 IOL - RC -0.035 0.123 0.285 ns ns Panel B (CPMS – PF) 2 CPMS - PF 0.160 0.146 1.095 ns ns 3 CPMS - JRI 0.569 0.088 6.431 0.01 0.01 4 CPMS - IOL 0.511 0.098 5.229 0.01 0.01 6 JRI - PF 0.403 0.203 1.985 0.05 0.05 8 IOL - PF 0.015 0.135 0.115 ns ns 9 RC - PF 0.110 0.217 0.504 ns ns
CPMS = comprehensive performance measurement system; RC = role clarity; PF = procedural fairness; JRI = job relevant information, IOL = information overload.
Table 6
Inferences about indirect effects (Sobel test)
Paths Hypotheses
Indirect
effects p-values
Significant level p<0.05
CPMS-JRI-RC H8a 0.569*0.604 = 0.344 0.001 Significant
CPMS-JRI-PF H8b 0.569*0.403 = 0.229 0.029 Significant
CPMS-IOL-RC H9a 0.511*-0.035= -0.018 0.389 ns
CPMS-IOL-PF H9b 0.511*0.015 = 0.008 0.456 ns
CPMS = comprehensive performance measurement system; RC = role clarity; PF = procedural fairness; JRI = job relevant information, IOL = information overload.