O
pen
A
rchive
T
OULOUSE
A
rchive
O
uverte (
OATAO
)
OATAO is an open access repository that collects the work of Toulouse researchers and
makes it freely available over the web where possible.
This is an author-deposited version published in:
http://oatao.univ-toulouse.fr/
Eprints ID: 16238
To cite this version:
Pommier-Budinger, Valérie and Bury, Yannick and Michon, Guilhem
and Napias, Gael In-flight piv for cror flight test demonstration. (2016) In: 32nd AIAA
Aerodynamic Measurement Technology and Ground Testing Conference, AIAA
AVIATION Forum, 6 June 2016 - 11 June 2016 (Washington, United States).
In-flight piv for cror flight test demonstration
Valérie Pommier-Budinger1, Yannick Bury2
Université de Toulouse, Institut Supérieur de l'Aéronautique et de l'Espace, 31055 Toulouse, France
Guilhem Michon 3
Université de Toulouse, Institut Supérieur de l'Aéronautique et de l'Espace, Institut Clément Ader,31055 Toulouse, France
and
Gael Napias 4
Université de Toulouse, Institut Supérieur de l'Aéronautique et de l'Espace, 31055 Toulouse, France
Abstract: Designing innovative solutions for future aircraft is one the concerns of aeronautical engineers. Among the studied technologies, Counter Rotating Open Rotor (CROR) propeller technologies are appearing as a promising, though highly challenging, alternative solution to Ultra High Bypass Ratio (UHBR) engines. Amongst these challenges, the interaction of the wake of the CROR engine pylon with the counter rotating blades, positioned downstream of the pylon (pusher configuration), are responsible for both airframe noise and vibrations that penalize aircraft certification. ‘Erasing’ the pylon wake such as to recover a strictly uniform flow upstream of the rotating blades would suppress this major source of airframe noise and vibrations. The current study is put forward in that context and is part of a project funded by the European Commission through the Cleansky/FP7/SFWA (Smart Fixed Wing Aircraft) Demonstrator program. In the first part of the project, an optimal design of the pylon, associated with advanced flow control strategies, has been proposed. The current study aims at developing an advanced experimental methodology, based on vibration-controlled stereoscopic Particle Image Velocimetry (3C-PIV), able to be flight-operated and that will serve the validation of the above mentioned active flow control system when operated on the Flying Test Bench. This article deals particularly with the characterization of the limits of the vibration spectrum acceptable by the on-board PIV subsystems and with the design of a system to lessen potentially harmful vibrations.
1
Associate Professor, DCAS, [email protected]
2 Associate Professor, DAEP, AIAA Senior Member, [email protected].
3 Researcher, DMSM, [email protected].
I. Context of the study
The study proposed in this article is carried out in the framework of Counter Rotating Open Rotor (CROR) propellers development. It is part of the Cleansky/FP7/SFWA program, funded by the European Commission. Strong pressure fluctuations are induced by the interaction of the pylon wake with the counter rotating blades located downstream the pylon. Such fluctuations are responsible for both airframe noise and vibration issues that penalize aircraft certification. The thorough analysis of the complex physics driving the flow is required in order to reduce the wake/blades interaction thanks to an optimal design of the pylon, associated with advanced flow control strategies.
The understanding of the highly non-linear and unsteady phenomena driving the complex flow physics involved by the interaction of the pylon wake with the blades impose to implement:
advanced measurement techniques, such as three Components Particle Image Velocimetry (3C-PIV). Such
technique should allow deciphering the flow structure in the wake of the pylon, and quantifying the efficiency of the active flow control strategy in mitigating the pylon wake. However, this technique is highly sensitive to vibrations and must be suited to harsh vibratory environment representative of flight conditions,
advanced post processing methods for the quantification of the flow in terms of, for instance, vortex dynamics,
unsteady wake topology or modal signature of the flow.
The proposed study focuses on in-flight PIV for CROR flight test demonstration. The issues that will have to be tackled to implement successfully in-flight PIV are:
the definition of a vibratory environment representative of a CROR-propelled aircraft. This task is not obvious
since CROR-propelled aircraft do not exist yet and the vibratory environment spectrum can only be estimated.
the characterization of the limits of the vibration spectrum acceptable by the PIV subsystems (cameras, laser and
laser sheet forming lenses). More precisely, from the above mentioned vibratory environment spectrum, determination of the limits beyond which vibration-induced errors on PIV measurements impose attenuation of vibrations transmitted to PIV subsystems.
the design of a system for vibration control of PIV subsystems.
II. Definition of a vibratory environment representative of a CROR-propelled aircraft
The spectrum of the vibratory environment representative of a CROR-propelled aircraft can only be assumed since no measurement exists and Finite Element analyses on full aircraft model are not accurate enough to confidently predict the dynamics of an airplane structure. The reference documents used to define this spectrum are
the standard DO-160 on Environmental Conditions and Test Procedures for Airborne Equipment1 and the articles2,3,4
that give some measurements on aircraft such as jet transport aircraft and a DASH 8-300 with turbopropellers (Figure 1). This former generation of aircraft is assumed to be more representative of a CROR-propelled aircraft than the new generation of aircraft that is optimized in terms of vibratory confort in cabin. In the end, Figure 2(left) gives the spectrum in the vertical direction (Z-axis) chosen for the vibratory environment representative of CROR-propelled aircraft. This spectrum is a compromise between curve C of the RTCA/DO-160 and measurement data available in the literature. The global shape of this spectrum complies with the RTCA/DO-160 curve and ensures a
high safety factor in comparison with effective vibration levels measured in standard existing aircraft2,3. Tests have
been performed with a shaker to measure the behavior of a camera fixed on a Scheimpflug board and subject to such a spectrum. In the Z-direction, the RMS acceleration is 1.2g and the maximal displacement is 1.02mm (Figure 2(right)). These are not extreme conditions but future flight tests with on-board PIV measurements will not to be performed in harsh conditions. For the X-axis and Y-axis, the vibration spectrums are assumed to have the same shape as Z-axis spectrum but with significantly lower amplitudes (approximatively 10% of the Z-axis amplitude) since measurements of the vibrations in the X and Y directions show that the coupling with the Z direction is relatively weak.
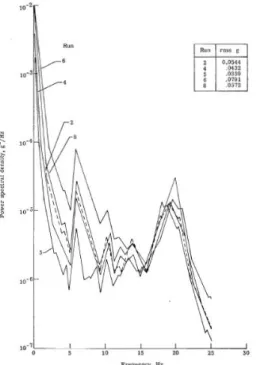
Figure 1 – Acceleration power spectral density measured in the vertical direction during 5 different descents in a bi-motor aircraft of years 702
Figure 2 – (left) Assumed spectrum in the Z-axis (vertical direction) for the vibratory environment representative of CROR aircraft (right) Acceleration, velocity and displacement in the Z direction
III. Characterization of the limits of the vibration spectrum acceptable by the PIV subsystemss
The spectrum of the vibratory environment representative of a CROR-propelled aircraft defined in the previous section will be used to define the limits of the vibration spectrum acceptable by the PIV subsystems for in-flight measurements. More particularly, the limits beyond which vibrations propagating on PIV subsystems induce displacements which noticeably affect the measurements will be determined from this spectrum. It should also be noted that the deformation of the aircraft cabin, even if it induces small displacements on the PIV system, may also alter the measurements. These static displacements should also be considered for the definition of a vibration control system dedicated to the PIV subsystems.
0 5 10 15 20 25 30 -4 -2 0 2 4 Acceleration (g) RMS Acceleration (g) = 1.2099 0 5 10 15 20 25 30 -0.05 0 0.05 Velocity (m/s) Max Velocity (m /s) = 0.067142 0 5 10 15 20 25 30 -0.4 -0.20 0.2 0.4 0.6 0.8 Time (s) Displacement (mm) Displ. m agnitude (m m ) = 1.0158 RMS displ. (m m ) = 0.15929
A. In-Flight to Indoor PIV Measurements
First of all, it is important to imagine the 3D-PIV system implemented in the aircraft. One configuration is proposed in Figure 3 in which the laser sheet as well as two windows for the cameras are represented. A specific test bench has been developed to represent this configuration and to allow defining the limit of the displacements and the vibration spectrum acceptable by the PIV subsystems.
Figure 3 - Schematic of the on-board 3D-PIV system
This test bench is based on the use of a target which simulates the images of the seeding particles that should be obtained in the pylon wake, when illuminated by the laser sheet. The target is obtained by applying an appropriate coating over a plane structure. A good result was obtained by using a sand with a specific size fixed with a black resin (Figure 4 (left)). This target can be moved compared to the cameras in order to simulate the relative displacements of the seeding particles in the laser sheet imposed by the mean flow past the CROR-propelled aircraft. Figure 5 shows the relative displacements in translation of the laser sheet compared to the cameras. The target has been designed to simulate typical flow past an aircraft. In order to simulate local vortical and shear flows superimposing with a mean uniform flow, the target can be moved in translation along the out-of-target-plane direction and two moving parts actuated by micrometric platforms are included into the target (Figure 4 (right)).
They allow simulating a vortex (rotation of a moving part of the target around X (𝜃𝑋)) and a shear flow (translation
of a moving part of the target along Y (𝑇𝑌) superimposing with the mean uniform flow (translation along X of the
target itself (𝑇𝑋)).
The test bench also comprises two cameras for 3C-PIV measurements. In order to simulate the effect of the on-board vibrations (which cause relative displacements of a given PIV subsystem, e.g. one camera, compared to the other elements of the PIV system), one camera is fixed on top of an hexapod which is used to generate small and
accurate static displacements, while the other PIV subsystems (the 2nd camera and the target faking the position of
the laser sheet) do not move (Figure 5).
Note that the static approach using solid target made of sand and epoxy resin in place of a lasersheet illuminating a volume of fluid makes sense due to the time scale involved for PIV measurements. Indeed, for PIV, a pair of pictures used for the determination of an “instantaneous” velocity field is acquired in less than a few tens of micro seconds. Within this time, the displacements of the PIV subsystems induced by the CROR-generated vibrations, of the order of a few micrometers, can faithfully be neglected. Consequently, time independant measurements may be used.
Figure 4 - (left) Target with the coating used to simulate particle images (right) Schematic of the target's calibrated displacements and nature of the displacements in the (X,Y,Z) reference frame.
In order to simulate the in-flight acquisition of pairs of particle images used for the computation of instantaneous velocity fields, successive pairs of images are acquired by imposing a given displacement of the target and of its moving parts between the first and the second image of each pair. The vibrations experienced in the cabin of the CROR-propelled aircraft cause the relative displacements of the PIV subsystems along the 3 translation and the 3 rotation axes. The latter are modeled by imposing, from one pair of images to the consecutive one the displacement of the mobile camera relative to the other camera along each of the 6 axes. In order to determine the maximal acceptable displacement allowing the reconstruction of the velocity/displacement field along each of the 6 axes, a step-by-step approach is applied for the displacement of the mobile camera, from the reference position of the camera to a maximum value, chosen on the basis of the maximum displacements imposed by the assumed vibration spectrum (Fig. 2). Performing all the required PIV measurements manually would take a long time due to the total number of tests that must be done, thus the test bench is run in an automatic way thanks to controllable displacement platforms.
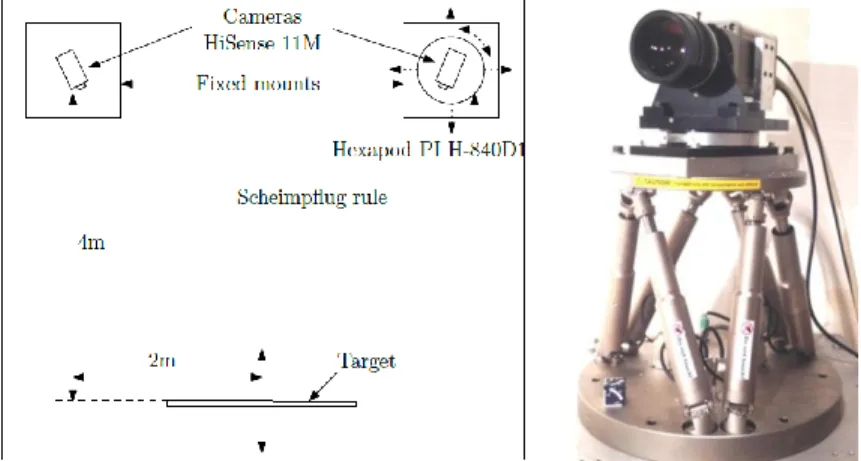
Figure 5 - Scheme of the test bench for In-Flight to Indoor 3C-PIV Measurement.
B. Determination of the 3C-PIV Test bench Accuracy
The objective of this part is to describe the methodology developed for the determination of the 3C-PIV test bench accuracy, for a reference configuration simulating a typical flow past an aircraft. The measurement errors in
the PIV test bench mainly come from optical and algorithm limitations: magnification factor, optical quality of the lenses, observation angle and associated Scheimpflug correction angles, PIV cross correlation algorithms. To perform the calibration, the two cameras are first fixed in a given reference position. Then the moving parts of the target are displaced and the displacement of the target measured by the PIV system is compared to the reference displacement measured by an external sensor that has itself an accuracy of 6µm.
Three kinds of tests are performed:
- Tests to measure the standard deviation of the PIV measurement system when the target simulates the mean
uniform flow. Only translations along X are carried out; the 2 others movements of the target are set to zero. The micrometric platform generates a step to move the target for 4 reference displacements: 0.5mm, 1mm, 2mm and 5mm. The movement for each step value is repeated 300 times to compute the standard deviation between the actual displacement imposed to the target and the one measured by the 3C-PIV system.
- Tests to measure the standard deviation of the PIV measurement system when the target simulates a shear flow.
Only translations along Y are carried out. The micrometric platform generates a step to move the target for 3 reference displacements: 0.5mm, 1mm and 3mm. As for the mean uniform flow, the movement for each step value is repeated 300 times.
- Tests to measure the standard deviation of the PIV measurement system when the target simulates a vortical
flow. Only rotations along X are carried out. The micrometric platform generates a step to move the target for 3 reference rotations: 0.5°, 1° and 2°. The movement for each step value is also repeated 300 times.
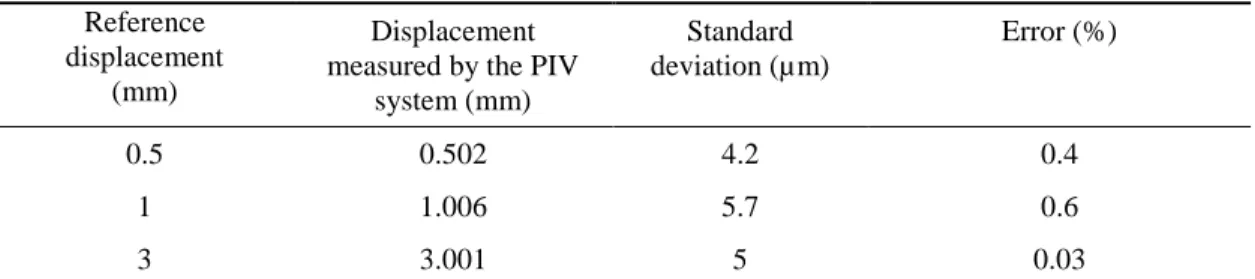
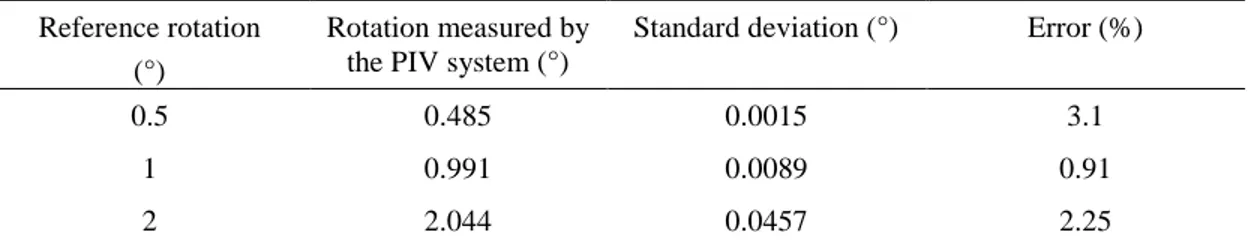
Table 1 to Table 3 summarize the results obtained for these tests. For all three kinds of movement, the standard deviation is reasonably constant whatever the values of the step. The error is always very small: less than a few percents. The conclusions are that the PIV measurement system is very accurate, and the standard deviations are evaluated for the three movements that allow simulating the typical flow of an aircraft.
Measurement configuration: translation along X of the target Reference displacement (mm) Displacement measured by the PIV system (mm) Standard deviation (µm) Error (%) (reference displacement – measured displacement) /reference displacement 0.5 0.489 11.3 2.25 1 0.981 10.9 1.94 2 2.024 11.7 1.19 5 4.999 11.6 0.02
Table 1 – Calibration of the PIV measurement system for the measure of the simulated mean uniform flow
Measurement configuration: translation along Y of one moving part of the target Reference
displacement (mm)
Displacement measured by the PIV
system (mm) Standard deviation (µm) Error (%) 0.5 0.502 4.2 0.4 1 1.006 5.7 0.6
Measurement configuration: rotation along X of one moving part of the target Reference rotation
(°)
Rotation measured by the PIV system (°)
Standard deviation (°) Error (%)
0.5 0.485 0.0015 3.1
1 0.991 0.0089 0.91
2 2.044 0.0457 2.25
Table 3 – Calibration of the PIV measurement system for the measure of a simulated vortical flow
C. Simulating the typical flow past an aircraft
The three different possible displacements of the target (Figure 4(right): translation of the target itself in the out-of-target-plane direction, rotation of a part of the target and translation of another part to simulate vortical and shear flows respectively), aim at simulating a typical flow past an aircraft at Mach number 0.23 (typical takeoff air speed). This typical flow is represented in our test bench by the three following displacements of the target:
- Step of 1mm in translation along X
- Step of 1mm in transalation along Y
- Step of 1° in rotation around X
These steps are carried out simultaneously 300 times and Table 4 gives the reference displacements and the measured displacements. The results show that the test bench allows producing the displacements of the target precisely. The static deviations in a configuration with a combination of the three possible movements of the target are consistent with the results of the test bench calibration. The moving target of the test bench is thus an efficient device to simulate the typical flow of an aircraft. It will be used in the next section to measure the limit of the displacements acceptable by an on-board 3D-PIV measurement system.
Type of displacement Reference displacement
Displacement measured by the PIV
system
Standard deviation
Translation along X 1mm 1.033mm 0.017
Translation along Y 1mm 0.977mm 0.0103
Rotation around X 1° 1.002° 0.0094
Table 4 – Target displacements representing a typical airflow: references imposed to the target and corresponding displacements measured by the 3C-PIV system
D. Limit of the displacements acceptable by on-board 3D-PIV measurement systems
The objective of this section is to measure the limit of the displacements acceptable by on-board 3C-PIV measurement systems, i.e. the maximal displacements allowing the reconstruction of the velocity/displacement field along each of the 6 axes. Remember that the test bench comprises two moving devices: the target that simulates the typical airflow of the aircraft and the camera on the hexapod that simulates the vibrating environment of the aircraft. The camera acquires pairs of images used for the computation of instantaneous velocity fields. As previously mentioned since during a real PIV test campaign each pair of pictures is acquired in less than a few tens of micro seconds, thus the camera can be considered as fixed between the two images of a pair in the PIV test bench considered in this study.The two images of each pair are taken for two positions of the main target and/or of its moving parts. For determining the maximal acceptable displacements, a step-by-step approach is performed and consists in moving of the mobile camera along each of the axes, from a reference position of the camera to a maximum value given in Table 5, while between each image of each pair, the target moves according to values given by Table 4. The number of measures to perform this step-by-step approach is very important (750) and tests have been automated.
Type of displacement Displacement
Translation along X 0 to 1.5mm (step 10µm)
Translation along Y 0 to 1.5mm (step 10µm)
Translation along Z 0 to 1.5mm (step 10µm)
Rotation around X 0 to 0.4° (step 0.004°)
Rotation around Y 0 to 0.4° (step 0.004°)
Rotation around Z 0 to 0.4° (step 0.004°)
Table 5 – Camera displacements on the hexapod for determining the limit of the displacements acceptable by on-board 3C-PIV measurement systems
For the chosen configuration in our test bench (Table 5), test results reveal that the most critical parameter for the computation of the velocity field is the rotation around Z. Figure 5 shows the target displacement measured by
the PIV (for a target step reference of 1mm) as a function of the rotation angle z of the camera. It can be observed
that if z exceeds 0.17°, the PIV measurement system is no more able to reconstruct the velocity field and to
compute the displacement. Note that this 0.17° camera rotation around Z corresponds to a 11.8mm shift on target's z-direction. Given the magnification factor of the images imposed by the PIV test bench, this value corresponds to
the shifting of more than a cross correlation windows (classically fixed to 32*32 pixels2) in the 3 components
rebuild process. Thanks to the distance between cameras and the target (i.e. 4m), this high displacement tolerance is possible contrary to classical short distance PIV measurement systems. For rotations around X and Y axes, as the configuration in aircraft is not yet well-defined, we consider the same limits, even if it is pessimistic in the case of our test bench.
At this stage of the work, the study has shown that the displacements resulting from the rotations imposed by vibrations are more critical than the linear displacements. However this study is yet limited to a configuration where only one Scheimpflug platform is considered, since only one angle of observation is imposed between the PIV cameras and the laser sheet. For the final ‘on board’ configuration, the PIV cameras will be supposed to observe the scene, i.e. the laser sheet, from two angles (see Fig. 3), imposing the implementation of two Scheimpflug platforms. The admissible shift of the target should then be computed taking into account this more complex implementing configuration.
IV. Design of a system for vibration control of PIV subsystems
A stabilization platform must be implemented to attenuate the vibrations imposed by the CROR aircraft environment to the PIV subsystems, which induce larger displacements than acceptable displacements for the PIV measurements system (large displacements that may prevent the reconstruction of the velocity/displacement field or damage the cameras). Several technologies are under study for this platform:
- Passive dampers: viscoelastic dampers are well-known to introduce damping in a structure. Their efficiency
mainly depends on the type of physical properties. Of course, their location is also an important key-driver for the design of a vibration isolation system. Optimization procedures for the choice and the locations of dampers
have been developed4. The main drawbacks of this isolation technology are the poor performance at low
frequency and the nonlinear behavior of viscoelastic material5.
- Tunes mass-damper vibrations absorbers: this technology allows attenuating vibrations in a narrow bandwidth
in a very efficient way. The drawback of this technology is the narrowness of the efficiency. To prevent this drawback, adaptive tuned mass-dampers are developed to make the frequency range of the absorbers vary with
the frequency range of the perturbation6,7.
- Active and hybrid vibration control systems. Active vibrations control systems are used when the limits of
passive devices are reached. Many studies on active vibration control concern automotive applications X and
civil engineering8,9. These systems are based on the use of actuators that can be of many kinds (electromagnetic,
piezoelectric, hydraulic, pneumatic). When passive dampers are combined with an active vibration control system, we get a two-stage hybrid system. The passive stage aims at filtering high frequency vibrations while the active stage will be controlled to attenuate low frequency vibrations.
For our application, two technologies are assessed (in simulation for the moment): passive dampers and hybrid vibration control systems. The performance is computed for displacements along the Z axis and compared to the vibrations induced by the vibration spectrum when no isolation system is implemented.
A. Passive system
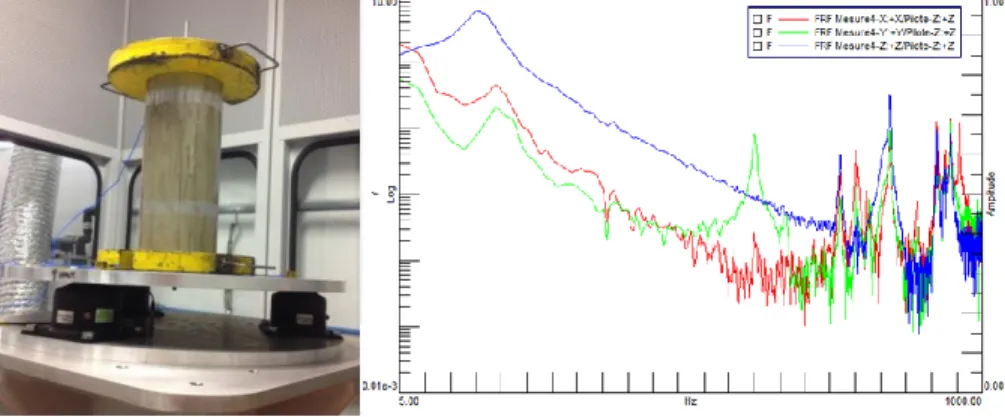
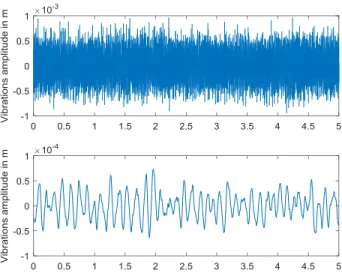
Elastomer dampers are chosen to attenuate vibration frequencies above 15Hz. These passive dampers need to be characterized. Indeed, passive dampers filter high frequencies but to the detriment of an amplification of low frequency vibrations. This amplification, which depends on the load supported by the dampers, is not well characterized in datasheets. Thus, experiments are necessary to measure the spectrum of the dampers along 3 axes at low and high frequency with a load representative of the future on-board PIV system (Figure 7). Figure 7 highlights a resonance frequency at low frequency, close to 8 Hz. 1-dof simulations in the Z-axis are carried out in order to estimate the influence of the dampers. Figure 8 shows the results of the simulation: the damper attenuates the high frequencies but is less efficient regarding low frequencies, specially around 8 Hz which corresponds to the frequency amplified by the damper.
Figure 7 - (left) Passive dampers with a load on the shaker, (right) Spectrum of dampers with a load along 3 axes.
Figure 8 - Vibration amplitudes (top) without any isolation vibration system, (bottom) with passive dampers
B. Hybrid system
We now focus on a hybrid solution composed of dampers to attenuate high frequenices and an active device for low frequencies. The hexapod used for PIV measurements has a bandwidth of 15Hz and is evaluated in combination with the dampers studied for the passive control of the vibrations. At this stage of the work, we are performing the study on 1 dof to study the performance and the feasibility of this solution.
Figure 9 – Scheme of the hybrid solution
The model of the hexapod along the Z-axis is identified thanks to step and sinus tests. The hexapod is a closed-loop system whose open-closed-loop can be modeled by a second-order system controlled by a PI controller:
) ( 1 ) ( ) ( s T s T s T OL OL CL (2) with 1 2 1 1 ) ( 2 n n i i c OL s s s K s T (3) and K = 30, = 30, = 100 and = 0.8. Controller Hexapode TCL Structure + dampers - Co + + Measurement noise
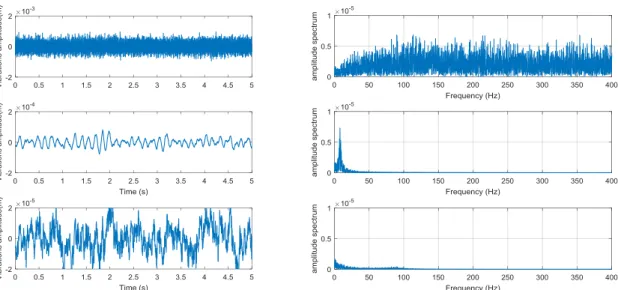
Figure 10 - Vibration amplitudes as a function of time and amplitude spectrum (top) without any isolation vibration system (middle) with dampers, (bottom) with passive dampers and hexapod
V. Conclusion
This article has presented the results of a study concerning Counter Rotating Open Rotor (CROR) propeller technologies, and specially the development of an advanced experimental methodology, based on vibration-controlled stereoscopic Particle Image Velocimetry (3C-PIV), able to be implemented on board to measure typical flow of this kind of aircraft when it will be operated for flight test validation. This study is made difficult by the fact that this kind of aircraft does not exist yet. For our work, assumptions must be made on the vibrating environment in cabin of such aircraft. In this context a test bench reproducing this environment has been developed and allowed establishing the limits of the vibration spectrum acceptable by the on-board PIV subsystems. The results of this study is that the displacements in rotation of the cameras used for the 3C-PIV are the most critical displacements that prevent the reconstruction of the velocity/displacement field. This article ends with the proposal of a hybrid vibration control system to lessen potentially harmful vibrations.
Acknowledgments
The authors acknowledge financial support by the European commission through the research project ACcTIOM, part of the european research program CleanSky.
References
1 Environmental Conditions and Test Procedures for Airborne Equipment, RTCA / DO-160E
2 John J. Catherines J.J., John S. Mixon J.S., Hariand F. Scholl H.F., “Vibrations measured in the passenger cabins of two jet
transport Aircraft“, NASA technical note TN D-7923,1975
3 3Bellmann M.A. and H. Remmers H., “Evaluation of vibration perception in passenger vehicles and aircrafts“, Acta Acustica
89, 2003 4
Rivin, E.I, Passive vibration isolation, New York: Asme press, 2003
5 Findley, W.N., Francis A. D., “Creep and relaxation of nonlinear viscoelastic materials“, Courier Corporation, 2013
6
Rana, R., Soong T. T., “Parametric study and simplified design of tuned mass dampers“, Engineering structures, Vol. 20.3, 1998, pp. 193-204
7 Sun, J. Q., Jolly M.R., Norris M. A., “Passive, adaptive and active tuned vibration absorbers—a survey“, Journal of
mechanical design, 117.B, 1995, pp. 234-242 8
Soong, T.T., Michalakis C. Costantinou, eds. Passive and active structural vibration control in civil engineering, Vol. 345. Springer, 2014
9 Sun, Weichao, Huijun Gao, and Bin Yao. “Adaptive robust vibration control of full-car active suspensions with