To link to this article: DOI:
10.1016/j.ijimpeng.2016.05.002
URL:
http://dx.doi.org/10.1016/j.ijimpeng.2016.05.002
Any correspondence concerning this service should be sent to the repository
administrator:
[email protected]
O
pen
A
rchive
T
OULOUSE
A
rchive
O
uverte (
OATAO
)
OATAO is an open access repository that collects the work of Toulouse researchers and
makes it freely available over the web where possible.
This is an author-deposited version published in:
http://oatao.univ-toulouse.fr/
Eprints ID: 15956
To cite this version:
Abdulhamid, Hakim and Bouvet, Christophe and Michel,
Laurent and Aboissière, Jacky and Minot, Clément Numerical simulation of
impact and compression after impact of asymmetrically tapered laminated
CFRP. (2016) International Journal of Impact Engineering, vol. 95. pp.
Numerical simulation of impact and compression after impact of
asymmetrically tapered laminated CFRP
Hakim Abdulhamid
a,b, Christophe Bouvet
a,*
, Laurent Michel
a, Jacky Aboissiere
b,
Clément Minot
baUniversité de Toulouse, ICA (Institut Clément Ader), ISAE (Institut Supérieur de l’Aéronautique et de l’Espace), 10, avenue Edouard Belin, BP 54032 - 31055,
Toulouse Cedex 4, France
bSogeti High Tech, Aéropark, 3 chemin de Laporte - 31300 Toulouse, France
Keywords:
Composite Ply drop-off Impact
Compression after impact Finite element simulation
A B S T R A C T
This paper presents a numerical simulation of impact and compression after impact (CAI) of a tapered composite laminate using a discrete ply model. Three types of damage: matrix cracking, delamination and fiber rupture are considered in the model. The presence of ply drop-off generates some disconti-nuities in the stress field and therefore adds difficulties to the simulation.
Analyses of numerical results are performed to understand the damage and failure mechanisms in both tests. Numerical results in terms of force-displacement curves, delamination shape, CAI displace-ment field and residual strength are compared with experidisplace-mental data. Impact simulation is in good correlation with the tests. CAI strength is under predicted and depends on quality of the meshing of the transition region. This study highlights the importance of modeling intra-ply matrix cracking for impact simulation.
1. Introduction
Impact damage tolerance of CFRP materials remains an impor-tant concern for structure design. Impact damage which is mainly characterized by matrix cracking, delamination and fiber rupture, usually propagates far beyond the impact point. Such damage is mostly present inside the laminate and is visually hard to detect from outside[1,2]. Even in the case of low velocity/low energy impact, the residual compression strength can be significantly af-fected. For thin composite panels, the energy threshold for visual detection of external damage (permanent indentation) corre-sponds already to an important loss of compression strength[3,4]. Since some aeronautical structures are inclined to tool drop and small debris impacts during their life cycle, the requirements and regu-lations by aviation authorities include a concept of impact damage tolerance.
Thickness tapering is commonly used to reduce the weight of composite structures, though it leads to the creation of resin rich pocket at the end of a dropped-off ply. Due to such material dis-continuities and the local curvature of continuous plies, the resulting structure may fail prematurely under static or fatigue loadings
[5–9]. Damage, generally in terms of matrix cracking and delami-nation, is triggered by a high stress concentration around the ply drop-off.
In the literature, many authors have developed numerical models for impact of composite laminates[10–14]. Depending on their level of complexity, the models are capable of reproducing some or all major types of damage: matrix cracking, delamination and fiber rupture. The meso-scale level initially introduced by Ladevèze and Allix[15]enables a faithful reproduction of impact type damage. Regarding the material laws, failure damage mechanics is general-ly used to simulate intra-laminar damage[11,16]. The use of cohesive elements with energy based damage model is now being used in many works to model discrete failure like delamination[17,18]. Some authors[12,19]also use it to model discrete matrix cracking and therefore define an indirect coupling between matrix cracking and delamination.
Regarding the prediction of residual strength, both analytical
[20–22]and FE models[23–25]have been proposed. In some papers
[23], initial impact damage is artificially introduced in the model prior to the simulation of compression. Others[24,25]are more faith-ful using a two-step model: an impact damage is simulated first and then followed by a simulation of the compression test.
To our knowledge, neither impact nor CAI simulation of tapered composite has been reported in the literature. This study pursues the work of Bouvet et al.[12,14,24]to develop a robust numerical model DPM (Discrete Ply Model) for predicting impact damage tol-erance; i.e. simulation of impact and CAI. It is also a continuation
* Corresponding author. Université de Toulouse, ICA (Institut Clément Ader), ISAE (Institut Supérieur de l’Aéronautique et de l’Espace), 10, avenue Edouard
Belin, BP 54032 - 31055, Toulouse Cedex 4, France. Tel.:+33-5-61-33-89-68.
of the impact of tapered laminates study described in[26]where an analysis of low velocity impact response of tapered laminates is presented. The study highlights a strong similarity with plain lami-nates in terms of damage mechanism. In this paper, the DPM is used to simulate the impact and CAI of a tapered specimen. The results of the numerical simulation are compared with experimental data for model validation and analysis of damage mechanisms.
2. Numerical modeling
The modeling approach is based on the work of Bouvet et al.[27]. They developed a discrete 3D FE model at the meso-scale for the simulation of impact damage of composite laminate. It has then been pursued to simulate the CAI test[24]. In this study, the capability of the model is extended to simulate both impact and CAI of a lami-nate with multiple internal ply drop-offs. To do so, a meshing process of the ply drop-off region has been developed and some changes regarding the material laws have been done compared to[14].
2.1. Meshing
The laminate meshing is presented inFig. 1. It is meshed at the ply level with C3D8 volume elements. Each element represents, in the thickness direction, two plies with the same orientation. The ply elements are connected with zero thickness cohesive ele-ments to model both delamination and transverse matrix cracking. To ease inter-ply connection, the nodes network needs to be uniform throughout the laminate which causes a twist of 45° and−45° ply elements (Fig. 1b). The element size for 0° and 90° plies is 1.25× 1.25 mm2in the laminate plan.
One of the main challenges in impact modeling is to account for complex interactions between different types of damage. In the case of the DPM, the coupling between transverse matrix cracking and delamination is modeled through the laminate meshing. It is one of the main building blocks of the model. Cohesive elements for
matrix cracking are parallel to the ply fiber orientation and defined in between each volume element. As a result, volume elements are disconnected along the ply transverse direction in case of matrix cracking. Such geometric discontinuity is used to capture indi-rectly the coupling between matrix cracking and delamination.
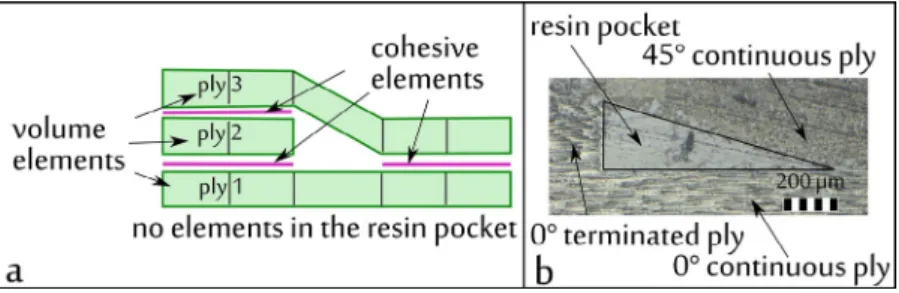
Modeling of the drop-off ply region is illustrated inFig. 2a. The meshing represents the sub-laminate of the ply drop-off area shown inFig. 2b. In this example, ply number 2 is terminated and plies 1 and 3 are continuous. In the thick section, inter-lamina cohesive el-ements are terminated at the end of the dropped-off ply. Then, a new group of cohesive elements are used to connect the continu-ous plies in the thin section. Note that there is no volume or cohesive elements in the resin pocket. This hypothesis is similar to assum-ing this area is already damaged before impact. In reality, it must be highly pre-stressed due to curing residual stress. So, to avoid any further complication of the model or longer computing time, it seemed not reasonable to develop a detailed meshing strategy of the area. In Reference[28], similar assumption has been used to sim-ulate a tapered laminate under in-plane load. In the case of impact, the assumption is more valid since the emphasis is on the propa-gation of delamination rather than its initiation.
2.2. Material laws
The impact is simulated with the Abaqus® 6.11 explicit/dynamic solver and all material laws are defined in a user-subroutine VUMAT. This part describes the non-linear modeling of the different damage types: fiber failure, matrix cracking and delamination.
2.2.1. Fiber failure
Modeling of fiber failure for impact simulation requires partic-ular considerations. In fact, fiber may fail either under traction or compression load. In both cases, a high amount of energy is re-leased as shown in the material property ofTable 1. This fiber failure energy release rate (ERR) needs to be taken into consideration to
Fig. 1. Description of the Discrete Ply Model: (a) different types of damage that can be represented and (b) meshing strategy.
compute the energy dissipation in the model. In reality, fiber failure is a discrete phenomenon and it should therefore be computed using failure damage mechanics within an interface element. Though, such option would significantly increase the number of degrees of freedom in the model. For this reason, it is preferred to manage fiber failure ERR inside volume elements using mesh-size independent formu-lation. Such formulation has been initially developed by Bazant and Oh[33]within the crack band theory.
In the model, the critical ERR is proportionally dissipated through the 8 integration points of the volume element based on the for-mulation of Bouvet et al.[14,34]. During the impact simulation, it is possible to encounter a single ply bending after delamination of its interfaces. In other words, some of the integration points are sub-jected to tension while the others are in compression. Therefore, the element damage evolution under traction and compression failure should not be formulated separately and a coupling between both failure modes needs to be considered. The energy dissipated in such type of loading is very complicated to measure experimen-tally, so, due to the lack information, a linear contribution of the critical ERR (Eq. (1)) is used in the model.
G G G G I l t I l C t I l c I l C c , , , , , , + ≤ 1 Eq. 1 where GI l G C t I l C c , , , ,
( )
is the critical mode I ERR in longitudinal direction in tension (compression) and GI lt,( )
GI lc, is the mode I ERR inlongi-tudinal direction in tension (compression), defined as:
G H d d dV G H d S S I l t llt l l I l c llc l lP l V l t , , , =
(
)
=(
)
− ⋅ − +∫∫
1 1 1 0 1ε
ε
ε ε
ε
ε ⋅⋅∫∫
l dV c V 0 1 ε, Eq. 2where ε σl
( )
l is the longitudinal strain (stress) in longitudinaldi-rection, x+
( )
x− the positive (negative) value of x, V the element volume, S the element section normal to longitudinal direction and ε εlt l c
,1
( )
,1the longitudinal strain at element failure in traction (com-pression), d the damage variable and H is the homogenized stiffness matrix of the ply with Ht
ll(Hcll) the traction (compression) value in
longitudinal direction.
The degradation of the longitudinal stiffness of the element is governed by a single variable d, defined in such a way that the in-equality in Eq. (1)is verified at element failure. Since some integration points of an element may be in traction and the others in compression and the failure strain in traction of the material is different from the compressive one, it is more convenient to define
the damage variable d in terms of relative strain. Considering the relative strain edefined as ε
ε l l t ,0 in traction or ε ε l l c ,0 in compression, where εl t ,0 , εl c ,0
are respectively the material longitudinal failure strains in traction and in compression. Then d is defined inEq. (2)
to obtain a linear evolution of the element longitudinal stress until failure: d e e e e e e max max = 1
(
(
−− 0)
)
1 0 Eq. 3 where emax max e i i =( )
=1 8 Eq. 4 With eithe element dimensionless strain at integration point,
e0 the element maximum relative strain at integration point at
damage initiation and e1the element maximum relative strain at
element failure (when d= 1) computed by resolvingEq. (1). It can be noticed thate0can be smaller than 1 because the instant of failure
initiation is computed from strain at the element nodes to better account for the bending of the ply. In traction, the longitudinal stress is computed as:
If
ε
l>0,σ
l=Hllt(
1−d)
ε
l+Hlt(
1−d)
ε
lt+Hlz(
1−d)
ε
lz Eq. 5where H H Hllt, lt, lz are the matrix stiffness components. It can
be noticed that Hll is not the same in tension
( )
Hllt and incom-pression
( )
Hllc due to asymmetric elastic behavior of composite(Table 1).
In compression, the calculation of the stress is more complex because after failure, fiber crushing needs to be modeled with a plastic law. If the compressive stress is evaluated similarly toEq. (4), there would be a discontinuity of the longitudinal plastic strain when the law changes from damage mechanics to plasticity. To over-come this problem, an equivalent plastic strain is computed during the damage evolution so that the element still satisfies the equal-ity ofEq. (1)at failure. By identification, the equivalent plastic strain during damage evolution is:
If
ε
l<0,ε
lP=dε
l Eq. 6Afterwards, the compressive stress is computed as:
If
ε
l<0,σ
l=Hcll(
ε ε
l− Pl)
+Hlt(
1−d)
ε
lt+Hlz(
1−d)
ε
lz Eq. 7During crushing, the plastic strain is determined using a yield function f (Eq. (8)) and the material mean crushing stressσlcrush. This
property has been measured by Israr et al.[31]from in-situ exper-imental tests:
ε
lPso that f=σ σ
l− lcrush ≤ 0 Eq. 8Fig. 3summarizes the behavior of volume elements in the fiber direction. The example shows a case where some part of the energy is dissipated in traction and some in compression.
2.2.2. Matrix cracking
Matrix cracking is represented by the intra-lamina cohesive el-ements. The location is therefore imposed by the element mesh-size. Note that the model does not aim to reproduce the dense network of crack generally observed inside impacted laminate. As a result, it cannot estimate the energy dissipated through matrix cracking. The goal is only to be able to represent the discontinuity generated by larger cracks and at the same time to trigger or pilot delamination. The criterion for matrix cracking is computed inside volume elements. It is based on Hashin’s failure criterion:
Table 1
Mechanical properties of T700GC/M21[29,30].
ρ Density 1600 kg/m3
Elt Tensile Young’s modulus in fiber direction 130 GPa
Elc Compressive Young’s modulus in fiber direction 100 GPa
Et Transverse Young’s modulus 7.7 GPa
Glt Shear modulus 4.8 GPa
νlt Poisson’s ratio 0.33
εlt ,0 Tensile failure strain in fiber direction 0.016
εlc ,0 Compressive failure strain in fiber direction −0.0125
σlcrush Mean crushing stress 270 MPaa
σtrupt Transverse tensile strength 60 MPa
τlt
rupt In-plane shear strength 110 MPa
GIc Mode I delamination critical ERR 0.6 N/mm
GIIc andGIIIc Mode II and III delamination critical ERR 1.5 N/mm
GI lC t
,
, Fiber traction critical ERR 133 N/mmb
GI lC c,, Fiber compression critical ERR 40 N/mmc
a[31],
b Material T300/913[32],
σ
σ
τ
τ
τ
t t rupt lt tz lt rupt + ⎛ ⎝⎜ ⎞⎠⎟ +( )
( )
+( )
≤ 2 2 2 2 1 Eq. 9where σt, τltτtzare respectively the transverse, lt and tz shear stresses,
and σtrupt τlt rupt
( )
the transverse (shear) failure stress. When the cri-terion is met in a volume element, the shear and traction strength of the neighbor cohesive elements are vanished. The compressive strength is however maintained to prevent volume elements from inter-penetrating. Moreover, the permanent indentation is imple-mented in the matrix cracking element. The formulation is based on matrix crack non-closure due the containment of debris. The reader is suggested to refer to References[34,35]for a detailed de-scription and validation of the law.2.2.3. Delamination
Modeling of delamination is achieved by reducing the stiffness of the inter-lamina cohesive elements. Element damage is initi-ated by a quadratic stress criterion taking into account modes I, II and III of propagation. The crack opening is governed by fracture mechanics. A linear contribution of the three modes is used con-sidering the same value of ERR for modes II and III.
G G G G G G I Ic II II c III IIIc + + = 1 Eq. 10 3. Experimental setup
3.1. Material and specimens
Two tapered specimens made of T700GC/M21 carbon-epoxy are considered. The material is available as a unidirectional prepreg tape of 0.25 mm thick. Material mechanical properties are presented in
Table 1. Specimens are cured in autoclave following the manufa-cturer’s recommendations.
An asymmetrically tapered specimen is considered; i.e. only one side is tapered and the opposite one remains flat (Table 2). Twenty four plies constitute the layup of the thick section with a stacking sequence of [452, 02,−452, 02, 902, 02]s. Then, 4 groups of plies, all
oriented in 0° are dropped-off in the mid-plane of the specimen re-sulting in a thin section stacking of [452,−452, 02, 902]s. The thickness
changes from 6 mm to 4 mm. The plies are grouped in pairs to reduce the number of interfaces and the size of the numerical model. Plies that belong to the same group are simultaneously dropped off. The groups of plies are terminated in an interspersed configuration as shown inTable 2. The step spacing between two consecutive drop-offs is 5 mm.
The length of the specimens is 100 mm longer than conven-tional low velocity impact specimen (100× 10 mm2)[36]in order
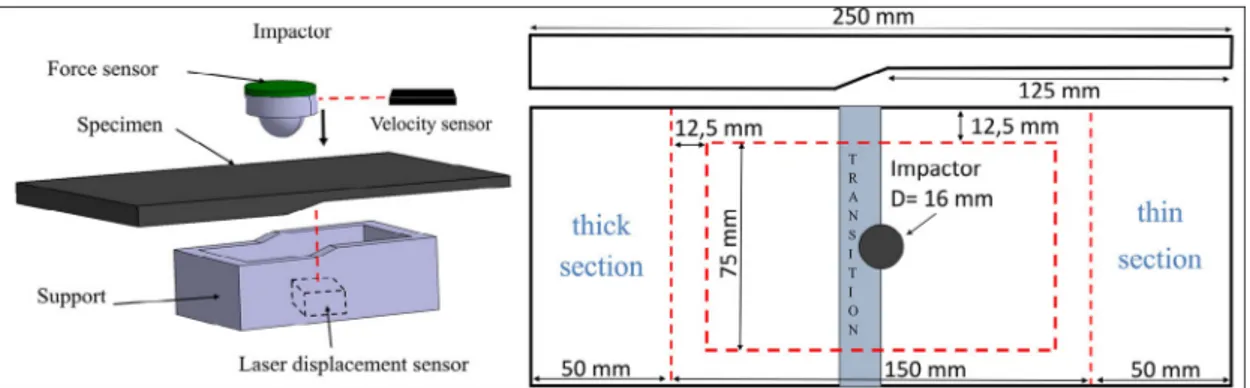
to allocate spaces for tabs at each of its end. The use of tabs is nec-essary during CAI test to compensate for the thickness difference between the thick and the thin section (Figs. 4 and 5). The transi-tion sectransi-tion is situated at 125 mm from the edge of the thin sectransi-tion (Fig. 4).
3.2. Tests procedure
Impact tests are performed on a drop weight testing rig. The im-pactor weights 4 kg and has an hemispherical shape indentor of 16 mm-diameter. Two specimens are impacted at 30 J-energy. The evolution of the impact force is measured by a piezoelectric sensor embedded in the impactor and the impact initial velocity is ob-tained from an optical sensor. Impact data acquisition is performed at a frequency of 250 kHz. The data are then used to compute the force-displacement graph of the test.
Fig. 3. Volume element behavior in the fiber direction.
Table 2 Specimen layup.
Layup [452 02 −452 02 902 02]s
The impact is realized on the flat side of the specimens. The tapered side is simply supported by a tapered rectangular opening of 125× 75 mm2. This boundary condition is very similar to the
Airbus standard AITM 1–0010[36]defined for plain specimens. The schematic of the impact test setup is illustrated inFig. 4.
After the impact test, the impacted face is painted in white with black speckle pattern to measure permanent indentation with an image correlation system. The speckle pattern is also used to monitor deformation of the specimens during the CAI test. Then delamina-tion is measured using C-scan technique from the impacted side of the specimen.
Regarding the CAI boundary conditions (Fig. 5), longitudinal sup-ports are provided on both sides at 10 mm from the edges to prevent premature failure due to extensive bending. On the tapered side, the supports are only present in the thick section. Note that the gap of the specimen midline on both sides of the transition region gen-erates a bending couple when it is in-plane loaded. If the specimen were bearing loaded like in the AITM 1–0010 standard or the in-ternational standard ASTM D7137/7137M[37], it would result in a premature failure due to the absence of rotational constraints at the boundaries.
4. Results comparison and analysis
4.1. Impact force-displacement graphs
The comparison of force-displacement curves (Fig. 6) gives an overall quality of the impact simulation. The similarity of the curves shows that the model is able to reproduce the global response of
a tapered specimen. It is interesting to notice that the modeling choice of the resin pocket does not affect much the result.
Three distinct phases can be identified from the experimental curves. In the beginning, the plate exhibits an elastic dynamic re-sponse until the contact force reaches around 3.75 kN. Then, the loss of bending stiffness implies an onset of important damage which is generally associated with large matrix cracking and delamina-tion. When the contact force reaches about 7.8 kN, an even larger loss of bending stiffness is observed due to fiber failure. Since all three types of damage are observed, the tests represent a good can-didate to assess the capabilities of the model.
Regarding the numerical graph, the model predicts well the onset of delamination. Then, the evolution of the force during the second phase is also well reproduced. However, the drop of the contact force at 4.6 mm deflection is more important in the simulation, meaning that fiber rupture is over-predicted by the model. As a result, the numerical graph is 1 kN below experimental graphs in the final plateau. It can be due to a misevaluation of the mean crushing stress or the critical ERR in traction or compression fiber rupture. Increas-ing one of these parameters will improve the contact force after fiber rupture. Note that measuring the critical ERR is very complicated experimentally. The value of traction rupture critical ERR is ob-tained from T300/913 material[32]and the compression one was set to match the impact results on 7 different layups in[14].
4.2. Impact delamination
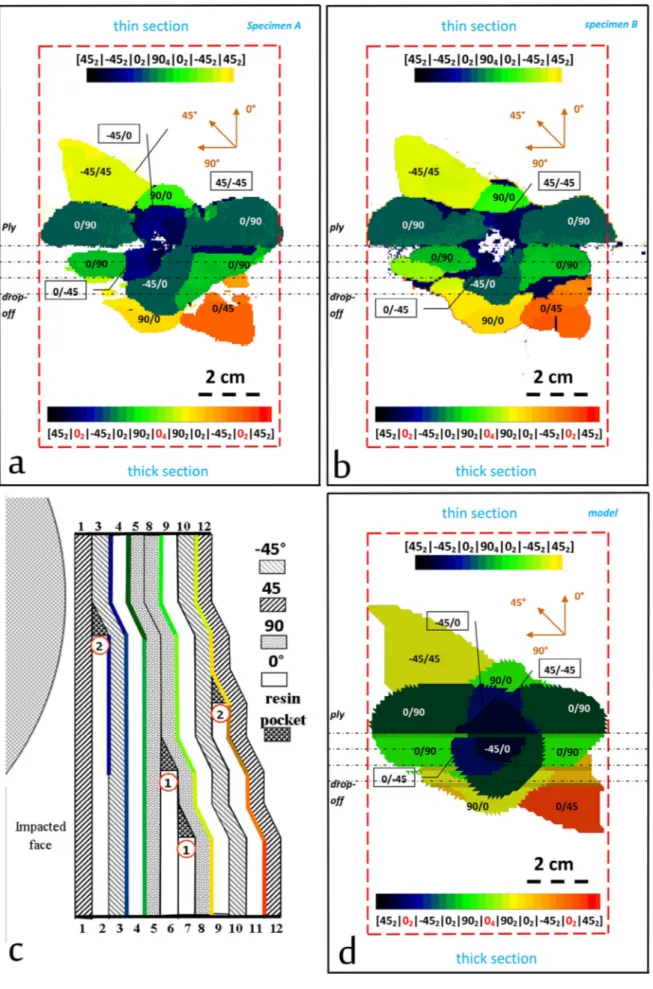
InFig. 7, interfaces delamination (Fig. 7(a) and (b)) obtained from C-scan, are compared with the simulation (Fig. 7(d)). Numerical
Fig. 4. Schematic of impact boundary conditions.
Fig. 7. Comparison of C-scan of delamination: (a, b) Experimentally obtained delaminations for two different experiments, (c) delaminations profile and (d) numerically obtained delaminations.
results are processed with the same color spectrum to obtain an equivalent C-scan output. Experimental results show low scatter-ing of delamination. Note that the thickness variation on either side of the transition region can change the color of a given interface. For example, the color of interface 0/90 changes from dark green to green. The delamination profile, provided inFig. 7(c), helps in the analysis of the results.
With regards to delamination propagation, regardless of the pres-ence of plies drop-off, the direction of propagation always follows the orientation of the underlying ply. Also, the interface of contin-uous plies is more critical like the 0/90 or the−45/0. The morphology of the delamination predicted by the model is in good agreement with the experiment. Area of projected delamination is respective-ly equal to 2650 mm2and 2920 mm2for specimen A (Fig. 7a), B
(Fig. 7b) and the simulation gives 3000 mm2(Fig. 7d). Therefore, the
model is robust enough to provide a good prediction of the de-lamination shape in spite of the perturbation created by the transition region.
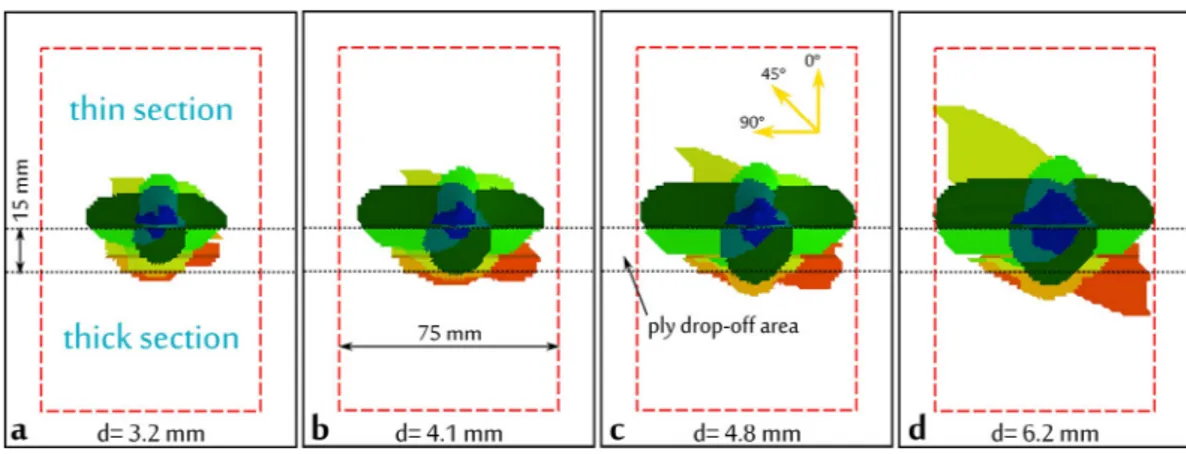
Experimental test provides only limited information about damage mechanism, thanks to the simulation, additional informa-tion can be retrieved. For example, inFig. 8, the progression of delamination throughout the simulation is presented. The images are taken at 4 distinct states of the impact.Fig. 8(a) and (b) are taken prior to the major fiber rupture at respectively 3.2 and 4.1 mm of deflection. At first, delamination propagates toward all direction at the same rate. Then, the propagation toward the thick section is slowed down once it reaches the end of the ply drop-offs area. At the same time, the propagation in the transverse direction is em-phasized. InFig. 8(c) and (d), the onset of major fiber rupture stops the propagation in the transverse direction and triggers the prop-agation of the 0/45 and−45/45 out-most interfaces of the specimen.
4.3. Impact energy dissipation
Contact force and energy dissipation history from the simula-tion are plotted inFig. 9. This figure gives an insight view of the damage mechanism during impact. Total damage dissipation graph corresponds to the sum of energy dissipated in delamination and fiber rupture. It equals 17 J which is about 46% of the impact energy. This value is lower compared to the 20 and 21 J dissipated in the tests, obtained from the area below the force-displacement curve. It is clearly observed in the comparison of force-displacement curves inFig. 6, the area below the curve is smaller for the model. In the model, the post-impact kinetic energy of the plate is negligible (less than 0.1 J) and about 12.6 J are retransmitted to the impactor. Al-though the model does not account for the dissipated energy in matrix cracking, this contribution alone cannot compensate the dif-ference of 3 to 4 J between the tests and the model. The difdif-ference
can be due to critical ERR in fiber rupture which is too low or the modeling of permanent indentation which affects the unloading.
In the simulation, approximately half of the dissipated energy is in delamination and the other half is in fiber rupture. It can also be confirmed that most of the energy dissipated in the first phase is due to delamination. Only a small amount is dissipated in the rupture of fiber localized below the indenter. In the second phase, the progression of delamination continues at the same rate and it is accompanied with large fiber rupture. Moreover, the drop of contact force coincides with the increase of energy dissipation in fiber rupture.
Fig. 10shows the contribution of each mode of propagation in the delamination energy. In the center of the specimen, it is pre-dominately in mode II and III while it is in mixed mode near to the specimen edges with a 50 % contribution of mode I. These data cor-roborate the need to model both shearing and opening propagation modes during impact.
4.4. CAI force-displacement curves
Simulation of CAI test is realized with the same model succes-sively to impact; some vibration and rigid body motion of the specimen needs to be reduced before application of the compres-sion load, though. To do so, multiple cycles of freeze-release of all degrees of freedom are applied. Concretely, in one cycle, all degrees of freedom are locked during 10−6s and then released during 10−4s.
Then, the compression test is simulated with a controlled displace-ment speed of 0.2 m/s. A relatively high loading speed needs to be used because of the explicit method; however, we checked that it
Fig. 8. Propagation of delamination during impact.
does not induce any significant dynamic effects on the simulation results.
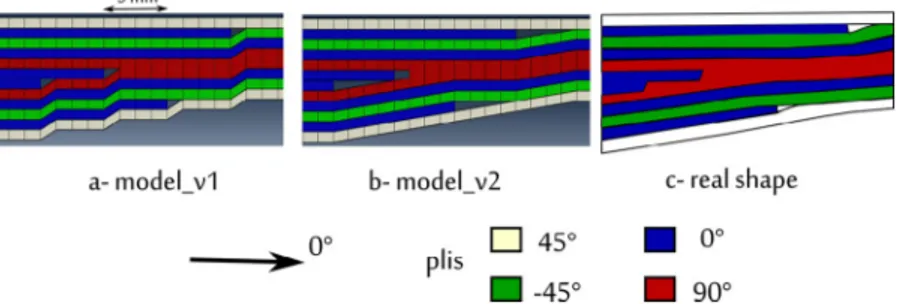
Fig. 11compares experimental and numerical force-displacement curves in CAI of two different simulations: “model_v1” is the ref-erence model, for “model_v2”, a smoother mesh of the transition region (Fig. 12b) is used but it still does not match the real shape (Fig. 12c). For both experimental tests, the response is linear until 40 kN and failure occurs at around 69 kN. Experimental and nu-merical curves are quite similar in the beginning though failure load
is under-predicted by the model; failure occurs at 58 kN for model_v1. It can also be noticed that in the simulation, the force reaches a plateau before failure which is slightly observed in the experimental curves. The modification of the mesh in model_v2 has improved the prediction of failure strength to 62.5 kN. Apart from this difference, results of both models are very similar during impact and CAI; that is why we will stick on model_v1 for the analysis of the results.
4.5. CAI displacement field
During the test, an Image Correlation system is used to monitor the impacted side of the specimen: displacement, strain and cur-vature fields of the surface are calculated from the data. InFig. 13a, experimental out-of-plane displacement field is compared with the simulation (model _v1). Note that IC data are limited to a rectan-gle of 60× 130 mm2dimensions because the edges of the specimen
are hidden by its supports. The predicted out-of-plane displace-ment field follows the same trend as the experidisplace-ment. From the beginning, a local buckling appears in the thin section. This buck-ling is oriented toward the impacted side and is driven by the asymmetry of the taper. In the model, both sides of the specimen are moving toward the same direction like in the experiment. The buckling continues to grow throughout the test which explains the non-linearity observed in the force-displacement curve.
Surface strain field (Fig. 13b) is characterized by an important spatial variation. It results from both the thickness variation between the thin and the thick sections and the local buckling of the spec-imen. In the simulation, a higher longitudinal strain is observed at the beginning of the transition region compared to the IC mea-surement. This area is highly disturbed because the strain discontinuity induced by the ply drop-off is too important in the model.
4.6. CAI failure mechanism
The identification of the failure damage scenarios is quite com-plicated in a CAI test. Many failure modes can be possible: buckling, delamination propagation or fiber failure. The lack of information regarding internal plies does not help in the analysis and the use of simulation can therefore be of great help.
In this study, the behavior observed on the surface during the last moments of the test is similar to the simulation result. In both cases, a local buckling, highlighted inFig. 14, occurs at one side of the specimen. The figure compares the increment of out-of-plane displacement before failure, when the force is between 65 kN and 69 kN in the experiment and between 55 kN and 57 kN in the sim-ulation. There is an opening of sub-laminate which is associated, in the model, to a propagation of delamination in the transition region as shown inFig. 15. This new delamination destabilizes the laminate and leads to the rupture of the specimen by failure of the 0° plies.
Fig. 10. Delamination propagation in modes (a) I and (b) II and III.
Fig. 11. Comparison of CAI force-displacement curves between tests and simulation.
Data regarding the strain field of 0° internal plies are required to corroborate the failure due to delamination. This information cannot be easily obtained from the test. To partially address the problem, the deformation can be computed from the surface strain and curvature field using Mindlin plate theory (Eq. (10))[38]. Note that this equation is verified only in an undamaged area which is not completely satisfied in our case.
εxx z εxx zext z zext ext
w x z
( )
=( )
− −(
)
∗ ∂ ∂( )
2 2 Eq. 11The computed strain of the continuous 0° ply near to the im-pacted face of the thin section is shown inFig. 16. At 65 kN, the longitudinal compression failure strain of−0.0125 is reached at the impact point. There may be an initial fiber failure, however the values
Fig. 13. Test and simulation comparison of CAI results (a) out-of-plane displacement and (b) specimen longitudinal strain at the impacted-face (model_v1).
should be taken with some reserve since the first interfaces are de-laminated and the assumption of Mindlin plate theory is not satisfied locally.Fig. 16shows the predicted strain field on both sides of the 0° ply before specimen failure, i.e. at 55 kN. Due to the delamina-tion around the impact point, the group of plies is subjected to bending resulting in a more complex strain field. The strain is close to the longitudinal failure strain at some region of the ply.
Therefore, the prediction of external displacement field corre-lates with the test. A delamination does occur in the experiment, though it can be triggered by fiber failure. In the simulation, fiber failure is close to be reached when delamination triggers the spec-imen failure. Thus, the model is able to predict the complex failure scenarios despite that the failure load is under-predicted. The dialog between experiment and simulation has improved the understand-ing of the CAI test. The prediction of bucklunderstand-ing and initiation of delamination in the transition region are important and can be im-proved by considering a more faithful modeling of the transition zone and a model with elements capable of simulating the bending of individual ply.
5. Conclusions
This paper reports a comprehensive numerical study about impact and CAI of tapered laminate. The use of DPM (Discrete Ply Model) approach has enabled to simulate both impact damage and resid-ual compressive strength of the tested specimen. In the study, the resin pocket area is assumed to be damaged prior to impact. Con-sequently, any specific modification of the meshing approach is not required. Material laws take into account three types of damage: matrix cracking, delamination and fiber rupture. Impact simula-tion results are very close to the experimental data. Both the global contact force and delamination shape are well reproduced by the model. In CAI, the model under-estimates the failure load but pre-dicts the CAI failure scenarios of the specimen. The model helps on the understanding of impact and CAI damage scenarios thanks to a successful experiment and simulation dialog.
Overall, this study has shown the robustness of the modeling ap-proach for damage simulation of unidirectional laminate. Good results are obtained despite the presence of discontinuities related
Fig. 15. Evolution of delamination at CAI failure.
to the ply drop-off. To the authors’ knowledge, it is the first attempt to simulate both impact and CAI in presence of ply drop-off and from that perspective, the results are quite encouraging.
Acknowledgments
The authors gratefully acknowledge SOGETI HIGH TECH for the financial support of this Ph.D. program.
This work was granted access to the HPC resources of CALMIP under the allocation 2012-P1026.
References
[1] Abrate S. Impact on composite structures. Cambridge University Press; 2005.
[2] Cantwell W, Morton J. The impact resistance of composite materials – a review. Composites 1991;22:347–62.
[3] de Freitas M, Reis L. Failure mechanisms on composite specimens subjected to compression after impact. Compos Struct 1998;42:365–73.
[4] Kinsey A, Saunders DEJ, Soutis C. Post-impact compressive behaviour of low temperature curing woven CFRP laminates. Composites 1995;26:661–7.
[5] He K, Hoa S, Ganesan R. The study of tapered laminated composite structures: a review. Compos Sci Technol 2000;60:2643–57.
[6] Curry JM, Johnson ER. Effect of dropped plies on the strength of graphite-epoxy laminates. AIAA J 1992;30:449–56.
[7] Wisnom MR, Dixon R, Hill G. Delamination in asymmetrically tapered composites loaded in tension. Compos Struct 1996;35:309–22.
[8] Weiss A, Trabelsi W, Michel L, Barrau JJ, Mahdi S. Influence of ply-drop location on the fatigue behaviour of tapered composites laminates. Procedia Eng 2010;2:1105–14.
[9] Xing YM, Yun H, Dai FL. An experimental study of failure mechanisms in laminates with dropped plies. Compos Sci Technol 1999;59:1527–31.
[10] Davies GAO, Hitchings D, Wang J. Prediction of threshold impact energy for onset of delamination in quasi-isotropic carbon/epoxy composite laminates under low-velocity impact. Compos Sci Technol 2000;60:1–7.
[11] Allix O. A composite damage meso-model for impact problems. Compos Sci Technol 2001;61:2193–205.
[12] Bouvet C, Castanié B, Bizeul M, Barrau J-J. Low velocity impact modelling in laminate composite panels with discrete interface elements. Int J Solids Struct 2009;46:2809–21.
[13] Wang S-X, Wu L-Z, Ma L. Low-velocity impact and residual tensile strength analysis to carbon fiber composite laminates. Mater Des 2010;31:118–25.
[14] Hongkarnjanakul N, Bouvet C, Rivallant S. Validation of low velocity impact modelling on different stacking sequences of CFRP laminates and influence of fibre failure. Compos Struct 2013;106:549–59.
[15] Ladevèze P, Allix O. Basic aspect of damage meso-modelling. In: LD L, JM N, editors. Eng. Mech. Proceeding Ninth Conf., ASCE; 1992, p. 373–6.
[16] Falzon BG, Apruzzese P. Numerical analysis of intralaminar failure mechanisms in composite structures. Part I: FE implementation. Compos Struct 2011;93:1039–46.
[17] Guinard S, Allix O, Guédra-Degeorges D, Vinet A. A 3d damage analysis of low-velocity impacts on laminated composites. Compos Sci Technol 2002;62:585–9.
[18] Iannucci L, Willows ML. An energy based damage mechanics approach to modelling impact onto woven composite materials: part II. Experimental and numerical results. Compos Part A Appl Sci Manuf 2007;38:540–54.
[19] De Moura MFS, Gonçalves JP. Modelling the interaction between matrix cracking and delamination in carbon–epoxy laminates under low velocity impact. Compos Sci Technol 2004;64:1021–7.
[20] Xiong Y, Poon C, Straznicky PV, Vietinghoff H. A prediction method for the compressive strength of impact damaged composite laminates. Compos Struct 1995;30:357–67.
[21] Habib FA. A new method for evaluating the residual compression strength of composites after impact. Compos Struct 2001;53:309–16.
[22] Naik NK, Ramasimha R. Estimation of compressive strength of delaminated composites. Compos Struct 2001;52:199–204.
[23] Yan H, Oskay C, Krishnan A, Xu LR. Compression-after-impact response of woven fiber-reinforced composites. Compos Sci Technol 2010;70:2128–36.
[24] Rivallant S, Bouvet C, Hongkarnjanakul N. Failure analysis of CFRP laminates subjected to compression after impact: FE simulation using discrete interface elements. Compos Part A Appl Sci Manuf 2013;55:83–93.
[25] González EV, Maimí P, Camanho PP, Turon A, Mayugo JA. Simulation of drop-weight impact and compression after impact tests on composite laminates. Compos Struct 2012;94:3364–78.
[26] Abdulhamid H, Bouvet C, Michel L, Aboissière J, Minot C. Influence of internally dropped-off plies on the impact damage of asymmetrically tapered laminated CFRP. Compos Part A Appl Sci Manuf 2015;68:110–20.
[27] Bouvet C., Hongkarnjanakul N., Rivallant S., Barrau J.J. Discrete impact modeling of inter- and intra- laminar failure in composites n.d.:1–56.
[28] Shim DJ. Shim-2002-Role of delamination and interlaminar fatigue in the failure of laminates with ply dropoffs.pdf. Massachusetts Institute of Technology, 2002.
[29] Prombut P. Caractérisation de la propagation de delaminage des stratifies composites multidirectionnels, Ph.D. DMSM, ISAE Université de Toulouse, 2007.
[30] Guillon D. Etude des mécanismes d’absorption d’énergie lors de l’écrasement progressif de structures composites à base de fibre de carbone Ph.D. DMSM, ISAE Université de Toulouse, 2008.
[31] Israr HA, Rivallant S, Barrau JJ. Experimental investigation on mean crushing stress characterization of carbon–epoxy plies under compressive crushing mode. Compos Struct 2013;96:357–64.
[32] Pinho ST, Robinson P, Iannucci L. Fracture toughness of the tensile and compressive fibre failure modes in laminated composites. Compos Sci Technol 2006;66:2069–79.
[33] Bazant P, Oh HB. Crack band theory for fracture of concrete. Matériaux Constr 1983;16:155–77.
[34] Bouvet C, Rivallant S, Barrau JJ. Low velocity impact modeling in composite laminates capturing permanent indentation. Compos Sci Technol 2012; 72:1977–88.
[35] Hongkarnjanakul N, Rivallant S, Bouvet C, Miranda A. Permanent indentation characterization for low-velocity impact modelling using three-point bending test. J Compos Mater 2013;48:2441–54.
[36] Airbus Industrie Test Method. Fiber Reinforced Plastics Determination of Compression Strength after Impact, AITM-1.0010, Issue 2. Blagnac: 1994.
[37] ASTM D7137 / 7137M -05, Standard Test Method for Compressive Residual Strength Properties of Damaged Polymer Matrix Composite Plates, ASTM International, West Conshohocken, PA, 2005.
[38] Mindlin RD. Influence of rotatory inertia and shear on flexural motions of isotropic, elastic plates. J Appl Mech 1951;18:31–8.