Full length article
Residential greenness and risk of prostate cancer: A case-control study in
Montreal, Canada
Claire Demoury
a, Benoît Thierry
b, Hugues Richard
a, Brittany Sigler
a, Yan Kestens
b,c, Marie-Elise Parent
a,b,c,⁎
aEpidemiology and Biostatistics Unit, INRS-Institut Armand-Frappier, Institut national de la recherche scientifique, Université du Québec, Laval, Québec, Canada bUniversity of Montreal Hospital Research Centre (CRCHUM), Montréal, Québec, Canada
c
School of Public Health, Department of Social and Preventive Medicine, Université de Montréal, Montréal, Québec, Canada
a b s t r a c t
a r t i c l e i n f o
Article history: Received 21 June 2016
Received in revised form 27 October 2016 Accepted 27 October 2016
Available online 4 November 2016
Background: Recent studies suggest that exposure to greenness favors several health outcomes. We assessed whether living in the proximity of greener areas was related to prostate cancer incidence in a population-based case-control study in Montreal, Canada.
Materials and methods: Interviews eliciting lifetime addresses were conducted with 1933 prostate cancer cases diagnosed in 2005–2009 and 1994 population controls. Odds ratios (OR) and 95% confidence intervals (CI) esti-mated the association between residential greenness, both at recruitment (2005–2009) and about ten years prior (1996), defined by the normalized difference vegetation index (NDVI) around the home, and prostate cancer risk. Three models were developed adjusting for age, individual characteristics, and individual and ecological charac-teristics, estimating relative risk in relation to an interquartile range (IQR) increase of the NDVI.
Results: We observed inverse associations between greenness measured within home buffers of 150 m, 300 m, 500 m and 1000 m, at both time points, and risk of prostate cancer, independently of individual and ecological characteristics. For instance, using a buffer of 300 m, the OR for an IQR increase of 0.11 in NDVI at the time of re-cruitment was 0.82 (95%CI 0.74–0.92). The corresponding OR for an IQR increase of 0.15 in NDVI in 1996 was 0.86 (95%CI 0.74–1.00). There were little differences in risks according to buffer size, the time point of exposure, when considering prostate cancer aggressiveness, or when restricting controls to men recently screened for prostate cancer to reduce the likelihood of undiagnosed cancer among them.
Conclusion: Men living in greener areas, either recently or about a decade earlier, had lower risks of prostate can-cer, independently of socio-demographic and lifestyle factors. These observations are novel and require confirmation.
© 2016 The Authors. Published by Elsevier Ltd. This is an open access article under the CC BY-NC-ND license (http://creativecommons.org/licenses/by-nc-nd/4.0/). Keywords: Prostate cancer Greenness Case-control study GIS Environment 1. Introduction
The causes of prostate cancer (PCa) remain elusive. The currently recognized risk factors are age, family history and Sub-Saharan ancestry. Other factors showing suggestive evidence include obesity, alcohol in-take, physical activity, air pollution and exposure to pesticides (Koutros et al., 2013; Kruk and Czerniak, 2013; McGregor et al., 2013; WCRF and AICR, 2014). Genetic factors identified to date explain only a modest proportion of familial risk (Eeles et al., 2014).
It has long been suspected that some PCa have environmental ori-gins (Haas and Sakr, 1997; Hsing and Chokkalingam, 2006), with supporting evidence from migrant studies (Haenszel and Kurihara, 1968). Striking geographic variations in PCa occurrence and progression are observed at international, national, and local levels (Klassen and Platz, 2006). The use of spatially referenced data thus represents a promising approach to better understand the factors associated with this cancer.
Evidence is accruing for a beneficial effect of a natural outdoor envi-ronment in health (Bowler et al., 2010). For instance, use of spatial data has recently suggested an association between exposure to greenness and a lower risk of all-cause (non-accidental) and cancer mortality in women (James et al., 2016).
Neighborhood greenness has been associated with increased physi-cal activity, lower odds of being overweight or obese, and lower expo-sure to air pollution (Hartig et al., 2014; James et al., 2015), each of which may in turn influence PCa risk (Parent et al., 2013; WCRF and AICR, 2014; Wekesa et al., 2015).
Abbreviations: PCa, prostate cancer; PSA, prostate screening antigen; DRE, digital rectal examination; NDVI, normalized difference vegetation index; CI, confidence interval. ⁎ Corresponding author at: Epidemiology and Biostatistics Unit, INRS-Institut Armand-Frappier, Institut national de la recherche scientifique, Université du Québec, 531 Boul. des Prairies, Building 12, Laval, Québec H7V 1B7, Canada.
E-mail addresses:[email protected](C. Demoury),
[email protected](B. Thierry),[email protected](H. Richard),
[email protected](B. Sigler),[email protected](Y. Kestens),
[email protected](M.-E. Parent).
http://dx.doi.org/10.1016/j.envint.2016.10.024
0160-4120/© 2016 The Authors. Published by Elsevier Ltd. This is an open access article under the CC BY-NC-ND license (http://creativecommons.org/licenses/by-nc-nd/4.0/).
Contents lists available atScienceDirect
Environment International
To our knowledge, the association between living in greener areas, recently and in the past, and PCa incidence has never been documented. Using data collected as part of a large case-control study conducted in Montreal, we assessed whether residential greenness was associated with PCa incidence at the time of diagnosis or recruitment, as well as about a decade earlier to take into account a potential latency period (Salinas et al., 2014). A wide array of potential personal and contextual factors, including PCa screening practices, was considered.
2. Materials and methods 2.1. Study population
We used data from The Prostate Cancer & Environment Study (PRO-tEuS), a large population-based case-control study conducted in Mon-treal, Canada. This study has been described previously ( Blanc-Lapierre et al., 2015).
Eligible participants were men younger than 76 years old at diagno-sis or selection, who were residents of the greater Montreal area (Mon-treal Island, North and South Shores), and registered on Quebec's permanent electoral list (continually updated). Cases were all patients newly diagnosed with primary PCa, actively ascertained through pa-thology departments across French-speaking hospitals in the Montreal area between September 2005 and December 2009. This covered over 80% of all PCa cases diagnosed in Montreal during the study period. Con-trol subjects were selected concurrently from the population-based provincial electoral French-speaking list, and frequency-matched to cases by 5-year age group. Potential controls with a history of PCa were excluded.
Participation rates among eligible subjects were 79.4% for cases and 55.5% for controls.
2.2. Data collection
Between 2005 and 2012, in-person interviews collected information on socio-demographic characteristics, family history of cancer, medical history, PCa screening history, lifetime physical activity, smoking, alco-hol consumption, dietary intake, and self-reported weight and height. The degree of aggressiveness of PCa, defined by the Gleason score, was extracted from prostate biopsy pathology reports. Residential addresses at the time of diagnosis of cases were extracted from hospital records; those of controls were obtained from electoral lists at the time of re-cruitment. Lifetime residential addresses were elicited through follow-up telephone interviews. All addresses were geocoded with the ArcGIS geographic information system (GIS, ESRI, Redlands, CA) using the geodatabase“Adresses Québec” that covers the whole province of Que-bec, then linked to greenness exposure variables.
Exposure to nitrogen dioxide (N02) was used as a marker of traf
fic-related air pollution. Using land-use regression models, concentrations of NO2at the subjects' home address at index date were estimated at
a resolution of 5 m2for people living in the Island of Montreal (Crouse
et al., 2009a; Parent et al., 2013). Annual exposure averages were based on measurements taken on three occasions (spring, summer and winter). NO2values were only available for a subset of our sample
(1242 cases and 1239 controls) as the survey was conducted on the Montreal Island and did not cover subjects living on the North or South Shores.
2.3. Residential greenness exposure
PCa tumors in older men are thought to have a latency period of 10 years between initial growth and their clinically detectable state, with a shorter period for those younger (Salinas et al., 2014). With a po-tential etiological role in mind, it was thus of interest to look at past greenness exposure. We selected two time points of exposure, i.e., the time of recruitment and 1996, the latter corresponding to about
10 years prior to the year of diagnosis of earlier cases (late 2005), or slightly longer for cases diagnosed in 2009. Assessing past exposure to greenness around or prior to the onset of tumor growth allowed us to consider address changes, and thus possible differences in greenness exposure, between the two time points. We elected to not assess earlier exposure, as errors in self-reported residential history could compro-mise analyses.
Satellite images covering the Montreal region, captured on August 5, 1996 and June 27, 2005 from Landsat TM5, were used to evaluate the greenness around the subjects' residences in 1996 and close to the time of diagnosis or recruitment (index date), respectively. Both images were corrected for atmospheric effects using the dark object subtraction method with the following assumptions: null downwelling diffuse irra-diance and atmospheric transmittance equals to 1 (Song et al., 2001).
Landsat TM5 scans one location on Earth every 16 days. The normal-ized difference vegetation index (NDVI) for Montreal can only be calcu-lated during summer months (late June to mid-September) as there is no green vegetation during winter, leading to about 6 timeslots for use-able satellite imagery. Adding cloud cover constraints left only 1 image for 2005 (June 27, 2005), and we selected the August image for 1996, as vegetation had reached its highest level of photosynthesis activity.
Greenness was determined using the NDVI, an indicator of the den-sity of green vegetation or biomass (Weier and David, 2000). Green veg-etation reflects more infrared radiation and absorbs more energy in red wavelengths than non-vegetated surfaces. NDVI is calculated according to the level of reflectance of near-infrared (NIR) and visible red (VR) wavelength spectra detected by satellite. Using spectral data available at a 30-m by 30-m resolution (band 3 and 4), NDVI is calculated as: NDVI = (NIR− VR) / (NIR + VR). Scores range from −1 to +1, with higher positive values indicating denser levels of healthy vegetation.
Average NDVI values from Landsat TM5 images were computed within 150 m, 300 m, 500 m and 1000 m radii buffers around each home address, for both time points (in 1996 and at the index date). Using several buffers of varying sizes allowed assessing sensitivity of ex-posure effects at various scales.
2.4. Statistical analyses
Odds ratios (OR) and 95% confidence intervals (CI) for the associa-tion between exposure to residential greenness and PCa risk were esti-mated using unconditional logistic regression models. Afirst model (Model 1) adjusted for age only. A second model (Model 2) adjusted for the following potential individual confounders: age (continuous), ancestry (Sub-Saharan, Asian, European, Other),first-degree family his-tory of PCa (Yes, No), education (Elementary, High school, College, Uni-versity), reported family income, in CAN$ (b20,000, 20,000–29,999, 30,000–49,999, 50,000–79,999, ≥80,000), marital status (married or common law, separated, divorced or widower, single, member of reli-gious order, other), smoking (cigarette pack-years), alcohol consump-tion (drink-years), dietary habits (frequency of use of fruit and vegetables 2 years earlier) and a history of diabetes (Yes, No). A third model (Model 3) further adjusted for neighborhood material and social deprivation. The latter were represented by a deprivation index con-structed byPampalon et al. (2000)available at the Dissemination Area level (small census unit inhabited by 400–700 persons). The social and material deprivation indices were derived from a principal compo-nent analysis conducted on six census data variables (the proportion of persons without high-school diploma, the ratio of employment in the population, the average income, the proportion of persons who are sep-arated, divorced or widowed, the proportion of single-parent families and the proportion of people living alone). Thefirst resulting compo-nent reflects variations in education, employment and income, empha-sizing the material aspect of deprivation. The second component reflects variations in the indicators associated with the social aspect of deprivation (the proportions of widowed, separated and divorced per-sons, of single-parent families and of persons living alone). For our
analyses, area-weighted average material and social deprivation scores were calculated for each residential buffer using the underlying Dissem-ination Area-level indexes.
In a second set of analyses, we restricted controls to men screened (by PSA and/or digital rectal examination (DRE)) within the 2 years pre-ceding the index date, to take into account potential confounding by screening history, and to reduce the possibility of undiagnosed PCa among controls.
All analyses were repeated taking into account the degree of aggres-siveness of PCa, defined by the Gleason score. Risks of low-grade (Gleason scoresb 7 or 3 + 4) and high-grade (Gleason scores N 7 or 4 + 3) PCa were estimated in unconditional polytomous logistic regres-sion models.
A sensitivity analysis excluded proxy respondents (b4% of subjects). In order to explore the possibility that associations might differ accord-ing to deprivation, we also stratified analyses according to tertiles of the distributions of social and material deprivation indices among controls. Finally, we evaluated the impact of including body mass index (BMI), physical activity and exposure to NO2in our models. These
might act as mediators in the association between greenness and PCa risk. Maximum lifetime BMI and NO2were modeled as continuous,
while physical activity level during adulthood linked to recreational, oc-cupational and residential activities was introduced as a categorical var-iable (Very, Moderately, Not very active).
The average NDVI was analyzed as a continuous linear variable after verifying that conditions for linearity were met. Linearity was assessed by scatterplots (for quartiles of NDVI) and by the likelihood ratio test (for the continuous variable and quartiles). ORs were expressed in rela-tion to an interquartile range increase of NDVI.
3. Results
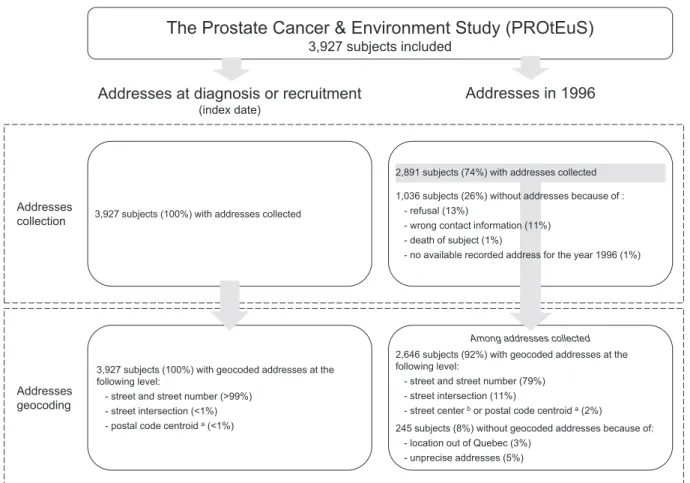
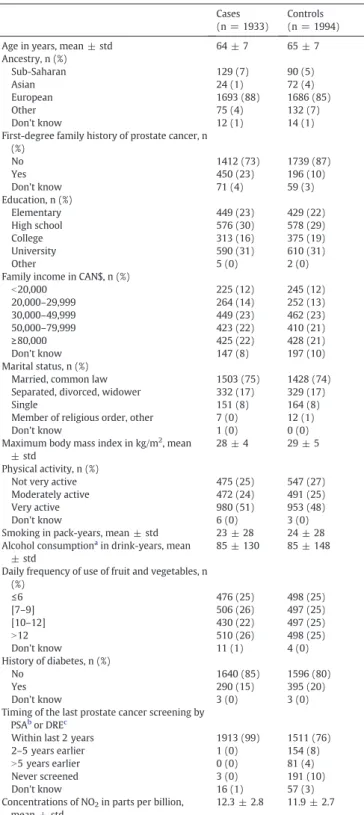
The study population comprised 1933 cases (1395 low-grade PCa and 535 high-grade PCa) and 1994 controls.Fig. 1provides details on addresses collection and geocoding. The home address, geographic co-ordinates at the index date and greenness exposure were available for all 3927 subjects. Information on home address in 1996 was collected at re-contact for 2891 (74%) subjects. Some 2646 (92%) of these could be geocoded using“Adresses Québec”. Greenness exposure determined by satellite data for the year 1996 was available for 2616 subjects (982 low-grade PCa and 373 high-grade PCa, and 1258 controls). About one third of subjects had different addresses in 1996 and at the index date. The characteristics of study participants are presented inTable 1. Av-erage age was 63.6 and 64.8 for cases and controls, respectively. As ex-pected, the case series included a greater proportion of subjects of Sub-Saharan ancestry and a lower proportion of Asian subjects. Cases report-ed more frequently afirst-degree family history of PCa than controls, while a lower proportion of cases than controls had been diagnosed with diabetes. Cases had a slightly greater level of exposure, on average, to NO2. There were little differences in terms of education, income,
mar-ital status, smoking and alcohol history, physical activity, BMI and fre-quency of use of fruit and vegetables according to case/control status. Nearly all cases (a few were diagnosed during surgery at a contiguous site) and 76% of controls had been exposed to PCa early detection efforts in the form of PSA and/or DRE testing within the 2 years preceding the interview.
Statistics of the NDVI for the study population are presented inTable 2. Distributions and interquartile ranges were similar in buffers of 150 m, 300 m, 500 m, 1000 m. NDVI averages were slightly lower for
Addresses collection
Addresses geocoding
Addresses at diagnosis or recruitment
(index date)
3,927 subjects (100%) with addresses collected
The Prostate Cancer & Environment Study (PROtEuS)
3,927 subjects included
Addresses in 1996
3,927 subjects (100%) with geocoded addresses at the following level:
- street and street number (>99%) - street intersection (<1%) - postal code centroid a(<1%)
2,891 subjects (74%) with addresses collected 1,036 subjects (26%) without addresses because of :
- refusal (13%)
- wrong contact information (11%) - death of subject (1%)
- no available recorded address for the year 1996 (1%)
2,646 subjects (92%) with geocoded addresses at the following level:
- street and street number (79%) - street intersection (11%)
- street center bor postal code centroid a(2%)
245 subjects (8%) without geocoded addresses because of: - location out of Quebec (3%)
- unprecise addresses (5%)
Among addresses collected
Fig. 1. Collection and geocoding of residential addresses in the Prostate Cancer & Environment Study (PROtEuS).a
In Montreal, the postal code area usually refers to a block face or to a large apartment complex.b
the index date than for 1996 residential locations. Pearson correlation coefficients between the four buffer measures of greenness varied be-tween 0.64 and 0.93 for addresses at the index date, and bebe-tween 0.71 and 0.95 for addresses in 1996.
Table 3presents results for the association between the NDVI esti-mated for addresses at the index date, and the risk of PCa. Odds ratios
are shown for three different adjustment models in relation to an inter-quartile range increase of the NDVI. In Model 1, adjusting for age only, we observed a significant inverse association between the risk of PCa and greenness in all buffers. Similar ORs were observed in Model 2, adjusting for individual characteristics, and Model 3 further adjusting for neighborhood material and social deprivation (OR 0.82, 95%CI 0.74–0.92, using a buffer of 300 m), although the inverse association was slightly attenuated in the latter.Table 3also presents results after excluding the 483 (24%) controls who had not been screened within the two years preceding the interview and who were thus more likely to have undiagnosed PCa. With this sample, inverse associations were slightly stronger in Models 1 and 2, compared to those in the main analyses.
Table 4shows results for the association between the NDVI estimat-ed for subjects' home addresses in 1996 and the risk of PCa. In Models 1 and 2, significant inverse associations were found in main analyses for the risk of PCa as well as in analyses restricted to recently screened con-trols. In Model 3, significant inverse associations were only observed for the 500 m buffer.
In analyses conducted by degree of cancer aggressiveness, both low-grade and high-low-grade PCa showed negative associations with green-ness, nearly identical to those in the full sample (Appendix Tables A.1 and A.2). Analyses excluding proxy respondents (b4%) did not alter findings. Associations were similar across strata of area-level depriva-tion (data not shown).
The inclusion of physical activity and BMI in the regression models had a marginal impact on results for both time points (Appendix Tables A.3 and A.4). When testing the inclusion of NO2in Model 3, using only
the sub-sample of subjects living on the Montreal Island and for whom survey data were available (about 60% of our total sample), the OR between exposure to greenness at the index date and PCa was 0.83 (95%CI 0.74–0.92), and 0.89 (95%CI 0.73–1.08) for exposure in 1996, using a buffer of 300 m.
4. Discussion
Research assessing natural environmental factors' relationship to health is growing. Most publications on the subject appeared in the last five years and were recently reviewed (Gascon et al., 2015; Gascon et al., 2016; Gomez et al., 2015; Hartig et al., 2014; James et al., 2015). As a whole, the emerging evidence supports a beneficial effect of the natural outdoor environment on health. Exposure to greenness has been suggested to reduce all-cause mortality (Mitchell and Popham, 2008; Villeneuve et al., 2012), cardiovascular disease incidence and mortality (Pereira et al., 2012; Richardson and Mitchell, 2010), re-spiratory disease mortality (Richardson and Mitchell, 2010), stroke mortality (Hu et al., 2008; Wilker et al., 2014), adverse birth outcomes (Ebisu et al., 2016), as well as obesity (Ellaway et al., 2005; Lachowycz and Jones, 2011). Positive health effects of greenness have also been ob-served on well-being and mental health (Alcock et al., 2014; Cohen-Cline et al., 2015; White et al., 2013), and on self-perceived health (Maas et al., 2006).
With respect to cancer risk, studies assessing a potential role of ex-posure to greenness have been conducted on skin cancer incidence (Astell-Burt et al., 2014), lung cancer (Bixby et al., 2015; Mitchell and Popham, 2008; Richardson et al., 2010; Richardson and Mitchell, 2010), and esophageal cancer mortality (Wu et al., 2008). Recently, an inverse association between greenness exposure and cancer mortality was observed in a prospective cohort of women in the US (James et al., 2016).
PCa incidence has been previously associated with a number of spa-tial factors related to the ecologic environment. These include exposure to sunlight and ultraviolet radiation (Bodiwala et al., 2003; Gilbert et al., 2009; Lin et al., 2012), exposure to NO2as a marker of traffic and urban
air pollution (Al-Ahmadi and Al-Zahrani, 2013; Parent et al., 2013; Shekarrizfard et al., 2015), proximity of residence to industrial sites
Table 1
Characteristics of the study population, PROtEuS, Montreal, Canada, 2005–2012. Cases
(n = 1933)
Controls (n = 1994) Age in years, mean ± std 64 ± 7 65 ± 7 Ancestry, n (%) Sub-Saharan 129 (7) 90 (5) Asian 24 (1) 72 (4) European 1693 (88) 1686 (85) Other 75 (4) 132 (7) Don't know 12 (1) 14 (1)
First-degree family history of prostate cancer, n (%) No 1412 (73) 1739 (87) Yes 450 (23) 196 (10) Don't know 71 (4) 59 (3) Education, n (%) Elementary 449 (23) 429 (22) High school 576 (30) 578 (29) College 313 (16) 375 (19) University 590 (31) 610 (31) Other 5 (0) 2 (0)
Family income in CAN$, n (%)
b20,000 225 (12) 245 (12) 20,000–29,999 264 (14) 252 (13) 30,000–49,999 449 (23) 462 (23) 50,000–79,999 423 (22) 410 (21) ≥80,000 425 (22) 428 (21) Don't know 147 (8) 197 (10) Marital status, n (%)
Married, common law 1503 (75) 1428 (74) Separated, divorced, widower 332 (17) 329 (17)
Single 151 (8) 164 (8)
Member of religious order, other 7 (0) 12 (1)
Don't know 1 (0) 0 (0)
Maximum body mass index in kg/m2
, mean ± std
28 ± 4 29 ± 5 Physical activity, n (%)
Not very active 475 (25) 547 (27) Moderately active 472 (24) 491 (25)
Very active 980 (51) 953 (48)
Don't know 6 (0) 3 (0)
Smoking in pack-years, mean ± std 23 ± 28 24 ± 28 Alcohol consumptiona
in drink-years, mean ± std
85 ± 130 85 ± 148 Daily frequency of use of fruit and vegetables, n
(%) ≤6 476 (25) 498 (25) [7–9] 506 (26) 497 (25) [10–12] 430 (22) 497 (25) N12 510 (26) 498 (25) Don't know 11 (1) 4 (0) History of diabetes, n (%) No 1640 (85) 1596 (80) Yes 290 (15) 395 (20) Don't know 3 (0) 3 (0)
Timing of the last prostate cancer screening by PSAb
or DREc
Within last 2 years 1913 (99) 1511 (76)
2–5 years earlier 1 (0) 154 (8)
N5 years earlier 0 (0) 81 (4)
Never screened 3 (0) 191 (10)
Don't know 16 (1) 57 (3)
Concentrations of NO2in parts per billion,
mean ± std
12.3 ± 2.8 11.9 ± 2.7
aAmong subjects who reported ever consuming alcohol once a month for one year or
more.
b
PSA: prostate specific antigen.
c
(Ramis et al., 2011), albeit the evidence for these is not entirely consis-tent (Raaschou-Nielsen et al., 2011; Yu et al., 2014). To our knowledge, ours is thefirst study to examine the association between exposure to residential greenness and PCa at two time points, i.e., recently and about ten years earlier using past exposure data, and PCa incidence. Findings are in line with an inverse relationship between residential greenness levels and PCa risk. This holds true at both time points, for dif-ferent buffer sizes, for both low- and high-grade cancers, after adjust-ment for a wide range of personal socio-demographic, lifestyle and neighborhood characteristics, and taking into account the subjects' screening history.
4.1. Exposure assessment
Most previous studies analyzing how exposure to greenness relates to health outcomes have used aggregated data. Results of ecological studies based on aggregate exposure and health indicators at the group level must be interpreted with caution, especially if potential con-founders are only available at the group level. In this study, greenness exposure was estimated for each subject in buffers around the subject's place of residence.
We used the NDVI as an exposure metric. Without strong a priori hy-potheses about greenness as a risk factor, this index which measures overall greenness appeared to be objective and valid. NDVI was found to be highly correlated with environmental psychologists' evaluations
of greenness and judged as a valid measure for quantifying levels of greenness in residential areas (Rhew et al., 2011). We were not able to consider the impact of greenness type, which could influence physi-cal activity behavior, nor were we able to consider greenness quality. Land-use datasets may provide more information about specific types of greenness, potentially giving an indication of their quality or usability (James et al., 2015). However, specific designations may mischaracter-ize green land uses, for example parks that do not contain vegetation. Additionally, land-usefiles are often too coarse to capture small-scale vegetation, such as gardens and street trees. Moreover if the reduced risk of PCa is explained by reductions in air pollution and noise, or re-duction of stress due to nature viewing, then small amounts of green or greening of streets may be sufficient. These determinants, such as the quality of greenness and how these areas are perceived, might also be relevant, as well as other aspects of the built environment (e.g. degree of urbanization or ease of accessibility) that have been poorly ex-plored (Nieuwenhuijsen et al., 2014). These issues need to be further studied (Gascon et al., 2016).
There were no differences across buffer sizes with respect to PCa risk. Buffers of 150 m and 300 m radii represent very local greenness while 500 and 1000 m buffers are indexes for surrounding green-ness. Very local greenness could lead to improved air quality for the local neighborhood and reduced noise. Neighborhood greenness could be an indicator for a walkable environment that increases opportunity for physical activity, or be related to local urban heat islands. Presence of mature trees in 100 m and 500 m radius has
Table 2
Mean greenness exposure (NDVI) in buffers of 150 m, 300 m, 500 m and 1000 m for addresses at diagnosis/recruitment and in 1996, and correlation between buffers. Addresses at diagnosis/recruitment (n = 3927) Addresses in 1996 (n = 2616)
Buffers size 150 m 300 m 500 m 1000 m 150 m 300 m 500 m 1000 m Mean 0.33 0.33 0.33 0.32 0.42 0.42 0.42 0.41 Std 0.09 0.08 0.08 0.08 0.12 0.11 0.11 0.11 Min 0.05 0.05 0.08 0.06 −0.07 0.05 0.06 0.04 Max 0.65 0.65 0.65 0.60 0.80 0.80 0.80 0.80 Interquartile range 0.12 0.11 0.11 0.10 0.16 0.15 0.15 0.15 Pearson correlation 150 m 1 0.91 0.79 0.64 1 0.92 0.83 0.71 300 m 1 0.93 0.77 1 0.95 0.81 500 m 1 0.88 1 0.90 1000 m 1 1 Table 3
Odds ratio (95% confidence interval) for the association between an interquartile range in-crease of the NDVIa
at the time of diagnosis/recruitment and prostate cancer risk, accord-ing to buffer size.
Model 1 Model 2 Model 3 Ageb
Individualc
Individualc
+ ecologicald
All subjects (1933 prostate cancer cases and 1994 controls) Buffer size
150 m 0.81 (0.74,0.89) 0.80 (0.73,0.89) 0.84 (0.75,0.94) 300 m 0.81 (0.74,0.88) 0.79 (0.72,0.87) 0.82 (0.74,0.92) 500 m 0.81 (0.74,0.88) 0.79 (0.72,0.87) 0.84 (0.75,0.94) 1000 m 0.79 (0.72,0.86) 0.78 (0.71,0.85) 0.84 (0.75,0.94) Restricting controls to the 1511 men screenede
within the last 2 years Buffer size 150 m 0.74 (0.67,0.82) 0.77 (0.69,0.86) 0.83 (0.74,0.94) 300 m 0.75 (0.68,0.82) 0.77 (0.69,0.85) 0.82 (0.73,0.93) 500 m 0.75 (0.68,0.82) 0.77 (0.69,0.85) 0.85 (0.75,0.96) 1000 m 0.73 (0.67,0.80) 0.75 (0.68,0.83) 0.83 (0.74,0.94) a
NDVI interquartile ranges were 0.12, 0.11, 0.11 and 0.10 for buffers of 150 m, 300 m, 500 m and 1000 m, respectively.
b Adjusted for age.
c Adjusted for age, ancestry, family history of prostate cancer, education, income,
mar-ital status, smoking, alcohol consumption, fruit and vegetables consumption, diabetes.
d
Adjusted for neighborhood material and social deprivation.
e Prostate cancer screening by prostate specific antigen or digital rectal examination.
Table 4
Odds ratio (95% confidence interval) for the association between an interquartile range in-crease of the NDVIa
in 1996 and prostate cancer risk, according to buffer size. Model 1 Model 2 Model 3 Ageb
Individualc
Individualc
+ ecologicald
All subjects (1358 prostate cancer cases and 1258 controls) Buffer size
150 m 0.83 (0.75,0.93) 0.82 (0.73,0.93) 0.93 (0.80,1.08) 300 m 0.80 (0.72,0.89) 0.78 (0.70,0.88) 0.86 (0.74,1.00) 500 m 0.78 (0.70,0.87) 0.76 (0.67,0.85) 0.84 (0.72,0.98) 1000 m 0.78 (0.70,0.87) 0.75 (0.67,0.85) 0.86 (0.74,1.01) Restricting controls to the 985 men screenede
within the last 2 years Buffer size 150 m 0.77 (0.69,0.87) 0.79 (0.70,0.91) 0.92 (0.79,1.09) 300 m 0.75 (0.67,0.84) 0.76 (0.67,0.86) 0.86 (0.74,1.01) 500 m 0.73 (0.65,0.82) 0.73 (0.65,0.83) 0.83 (0.71,0.99) 1000 m 0.73 (0.65,0.82) 0.73 (0.64,0.83) 0.86 (0.73,1.01) a
NDVI interquartile ranges were 0.16, 0.15, 0.15 and 0.15 for buffers of 150 m, 300 m, 500 m and 1000 m, respectively.
b Adjusted for age.
c Adjusted for age, ancestry, family history of prostate cancer, education, income,
mar-ital status, smoking, alcohol consumption, fruit and vegetables consumption, diabetes.
d
Adjusted for neighborhood material and social deprivation.
been associated with increased house value, whereas presence of low tree density and woodlands decreased house value in 500 m buffers (Kestens et al., 2004). Moreover, NDVI standard deviation within 1000 m (i.e. heterogeneity in land use/greenness) was positively associated with house value. Because these marginal values of house attributes are an expression of people's preferences, it may be that valuing tree presence/view improves quality of life and possibly health.
We considered exposure separately at two time points, currently and some 10–15 years earlier. Cumulative exposure to greenness would be expected to yield very similar results given that only one third of subjects had different addresses in 1996 and at the index date, and NDVI in 1996 and 2005 are highly correlated. Nevertheless, consid-ering past exposures is important when studying the etiological role of exposures on diseases with a latency period.
Measurement error inevitably occurred in the study. Error was likely non-differential, leading to conservative estimates of the associations studied. Our exposure metrics focused on residential addresses, with no information on where participants spent time. Participants were as-sumed to have interacted with neighborhood greenness, which may not have been the case, leading to exposure misclassification. Also, possible exposure to greenness around workplaces was not considered. 4.2. Covariates
We conducted analyses considering three adjustment models. Adding individual factors (Model 2) had only a modest impact on risk estimates derived from the age-adjusted model (Model 1). In Model 2, while we did not have strong a priori hypotheses about potential confounding factors, we chose to adjust for a large range of individual confounders that could potentially be associated with both the expo-sure and PCa, leaving out factors that could be in the mediation path-way. We tested the inclusion of both individual factors and ecological characteristics in Model 3. Contextual attributes, when available, are often adjusted for in area-level studies when individual data are not available (Klassen and Platz, 2006). Contextual data may also be used to represent unmeasured confounders, known or unknown, or they can have their own meaning, such as representing social capital, for example.
Neighborhood sociodemographic characteristics have been shown to correlate with greenness (Maas et al., 2006; Mitchell and Popham, 2008). When neighborhood deprivation was incorporated in our third model, the inverse associations between greenness and PCa persisted, although they were attenuated, with some of the risk estimates no lon-ger reaching statistical significance. The ecological deprivation index used in Model 3 combines indicators for education, employment, in-come, marital and familial status in the neighborhood. Since Model 3 also included variables for education, income and marital status mea-sured at the individual level, we cannot exclude the possibility of over-adjustment. On the other hand, residual confounding by sociodemographic characteristics remains possible, as shown by Stein-metz-Wood et al. for the built environment (Steinmetz-Wood and Kestens, 2015). Geographical and historical factors described in Crouse et al. also demonstrate that Montreal is a complex setting in which to examine relationships between neighborhood-scale social and physical environmental characteristics (Crouse et al., 2009b). Despite our adjust-ments for multiple individual- and area-level variables, confounding by attributes that were either not measured, or imperfectly so, cannot be excluded. There was no evidence in our data that associations with res-idential greenness varied according to area-level material or social deprivation.
Few previous studies of PCa have been able to consider screening practices. This may have compromised the ability to identify risk factors for this disease (Garcia-Closas and de Berrington, 2015). In sub-analyses restricting subjects to men screened recently for PCa, we were able to reduce the potential confounding by screening, as it may relate to
socio-demographic and cultural factors, as well as to greenness expo-sure. Moreover, this decreased the likelihood for undiagnosed PCa among controls.
4.3. Selection issues
Participations rates were high (79%) among cases and lower (56%) among controls. To evaluate the potential for selection bias in the study, we conducted analyses comparing study participants to non-par-ticipants in terms of four ecological variables derived from census tract data in 2006 for the address at recruitment. For instance, the percentage of subjects living in areas with a greater proportion of recent immi-grants within the previous 5 years were 4.0% and 4.6%, for participants and non-participants, respectively. Corresponding values for partici-pants and non-participartici-pants were 6.0% and 6.6% for higher unemploy-ment rate, 19.5% and 20.1% of adults without a high school diploma, and 21.7% and 24.4% for the lowest quintile of household income. More-over, mean NDVI values for a buffer of 300 m were 0.33 among partici-pants and 0.32 among non-participartici-pants. The absence of disparities in socio-demographic indicators and NDVI values between participants and non-participants held true when considering cases and controls separately. These observations indicate that selection bias is not of major concern in the study.
4.4. Potential mechanisms
Several mechanisms have been proposed to explain the association between greenness and global health (Hartig et al., 2014; James et al., 2015). Greenness might help reduce exposure levels to environmental factors suspected to have negative health effects, and acting as media-tors, such as air pollution (Schwartz, 1994), noise (Passchier-Vermeer and Passchier, 2000) and high temperatures (Basu and Samet, 2002). Stress and social cohesion have also been proposed as mediators be-tween greenness and health (de Vries et al., 2013; Hartig et al., 2003; Maas et al., 2009). We can only speculate at this point regarding poten-tial mediators for PCa specifically and our study was not designed to rig-orously investigate this. Factors with reasonable plausibility include physical activity, obesity, and perhaps NO2.
Both positive and negative associations between physical activity and PCa risk have been previously reported in observational epidemio-logical studies (WCRF and AICR, 2014; Wekesa et al., 2015). Higher physical activity levels among individuals with access to natural out-door environments have been observed repeatedly (Chaix et al., 2014; Gong et al., 2014; Li et al., 2008; Richardson et al., 2013). In a Canadian survey, positive associations were observed between greenness and physical activity independent of income level (McMorris et al., 2015). While there is some evidence and expert consensus to suggest that liv-ing in greener areas can facilitate physical activity (Lee and Maheswaran, 2011), the evidence of a direct effect remains weak (Maas et al., 2008). However, the type of greenness is an important fac-tor in determining whether and how it may influence health (Bixby et al., 2015). This could explain why some studies found that access to gen-eral greenness had no impact on individuals' levels of physical activity, whereas studies that restricted the measure of greenness to specific types of environments - such as parks or sports grounds - reported im-proved physical activity behavior with increased accessibility ( Wendel-Vos et al., 2004). Adjusting for different types of self-reported physical activity levels, including recreational, had little influence on our findings but the variables used were relatively crude.
Higher levels and greater variation of neighborhood greenness have been associated with lower odds of obesity among adults of all ages (Pereira et al., 2013). Obesity has been linked to advanced PCa (WCRF and AICR, 2014). In our data, associations with greenness were similar for low- and high-grade cancer. Moreover, associations were unaltered when controlling for obesity.
Greenness is potentially correlated with other spatial and contextual factors. Reduced exposure to air pollution has been observed in greener areas (Dadvand et al., 2012), as vegetation is known to lower air pollu-tion levels. We previously reported a positive associapollu-tion between NO2
and PCa risk in this population (Parent et al., 2013). Nevertheless, the in-verse association between recent greenness exposure and risk of PCa persisted after adjustment for NO2exposure in the sub-sample for
which survey data was available.
In our study,findings didn't seem to point out to physical activity, obesity or air pollution as mediators. Imprecision in the assessment of these factors might mask a true mediating effect. Alternatively, it could be that factors unmeasured in our study such as temperature, noise, or neighborhood walkability (James et al., 2015) are implicated. 5. Conclusions
In this large population-based study, we observed decreased risks of PCa among men living in areas with higher levels of greenness. Research in this area is in its early stages and further work is needed to establish how risk of cancer interacts with local greenness. In the cancer domain, there is much to be learned from the experiences of neighborhood re-search in other disease areas. Incorporating social, built and natural en-vironmental factors into research on cancer etiology and outcomes can lead to a better understanding of cancer processes, identify vulnerable populations, and generate results with translational impact relevant to interventionists and policy makers.
Ethics statement
The study was approved by the IRB of the Institut national de la recherche scientifique, along with the ethics committees from the fol-lowing hospitals: Hôpital Notre-Dame, Hôpital St-Luc, Hôtel-Dieu de Montréal, Hôpital Maisonneuve-Rosemont, Hôpital Jean-Talon, Hôpital Charles-Lemoyne, Hôpital de Fleury, Hôpital du Sacré-Coeur de Montré-al, Hôpital Santa Cabrini.
Acknowledgements
This study was supportedfinancially through grants from the Cana-dian Cancer Society (grant numbers 13149, 19500, 19864 and 19865), the Cancer Research Society, the Fonds de Recherche du Québec—Santé (FRQS), FRQS-RRSE, and the Ministère de l'enseignement supérieur, recherche, science et technologie du Québec. Marie-Élise Parent held ca-reer awards from the FRQS. Claire Demoury was supported by a FRQS-INSERM (Institut national de la santé et de la recherche médicale, France) postdoctoral award. Yan Kestens holds an Applied Public Health Chair in Urban Interventions and Population Health from the Canadian Institutes of Health Research.
The authors gratefully acknowledge the entire research team which made this study possible, study subjects, along with collaborating urol-ogists. Special thanks to François Lagacé who contributed to the geocoding of addresses.
Appendix A. Supplementary data
Supplementary data to this article can be found online atdoi:10. 1016/j.envint.2016.10.024.
References
Al-Ahmadi, K., Al-Zahrani, A., 2013.NO(2) and cancer incidence in Saudi Arabia. Int. J. Environ. Res. Public Health 10, 5844–5862.
Alcock, I., White, M.P., Wheeler, B.W., Fleming, L.E., Depledge, M.H., 2014.Longitudinal ef-fects on mental health of moving to greener and less green urban areas. Environ. Sci. Technol. 48, 1247–1255.
Astell-Burt, T., Feng, X., Kolt, G.S., 2014.Neighbourhood green space and the odds of hav-ing skin cancer: multilevel evidence of survey data from 267072 Australians. J. Epidemiol. Community Health 68, 370–374.
Basu, R., Samet, J.M., 2002.Relation between elevated ambient temperature and mortali-ty: a review of the epidemiologic evidence. Epidemiol. Rev. 24, 190–202.
Bixby, H., Hodgson, S., Fortunato, L., Hansell, A., Fecht, D., 2015.Associations between green space and health in English cities: an ecological, cross-sectional study. PLoS ONE 10, e0119495.
Blanc-Lapierre, A., Spence, A., Karakiewicz, P.I., Aprikian, A., Saad, F., Parent, M.E., 2015.
Metabolic syndrome and prostate cancer risk in a population-based case-control study in Montreal, Canada. BMC Public Health 15, 913.
Bodiwala, D., Luscombe, C.J., Liu, S., Saxby, M., French, M., Jones, P.W., Fryer, A.A., Strange, R.C., 2003.Prostate cancer risk and exposure to ultraviolet radiation: further support for the protective effect of sunlight. Cancer Lett. 192, 145–149.
Bowler, D.E., Buyung-Ali, L.M., Knight, T.M., Pullin, A.S., 2010.A systematic review of evi-dence for the added benefits to health of exposure to natural environments. BMC Public Health 10, 456.
Chaix, B., Simon, C., Charreire, H., Thomas, F., Kestens, Y., Karusisi, N., Vallée, J., Oppert, J.-M., Weber, C., Pannier, B., 2014.The environmental correlates of overall and neigh-borhood based recreational walking (a cross-sectional analysis of the RECORD Study). Int. J. Behav. Nutr. Phys. Act. 11, 20.
Cohen-Cline, H., Turkheimer, E., Duncan, G.E., 2015.Access to green space, physical activ-ity and mental health: a twin study. J. Epidemiol. Communactiv-ity Health 69, 523–529.
Crouse, D.L., Goldberg, M.S., Ross, N.A., 2009a.A prediction-based approach to modelling temporal and spatial variability of traffic-related air pollution in Montreal, Canada. Atmos. Environ. 43, 5075–5084.
Crouse, D.L., Ross, N.A., Goldberg, M.S., 2009b.Double burden of deprivation and high concentrations of ambient air pollution at the neighbourhood scale in Montreal, Can-ada. Soc. Sci. Med. 69, 971–981.
Dadvand, P., de Nazelle, A., Triguero-Mas, M., Schembari, A., Cirach, M., Amoly, E., Figueras, F., Basagana, X., Ostro, B., Nieuwenhuijsen, M., 2012.Surrounding greenness and exposure to air pollution during pregnancy: an analysis of personal monitoring data. Environ. Health Perspect. 120, 1286–1290.
de Vries, S., van Dillen, S.M., Groenewegen, P.P., Spreeuwenberg, P., 2013.Streetscape greenery and health: stress, social cohesion and physical activity as mediators. Soc. Sci. Med. 94, 26–33.
Ebisu, K., Holford, T.R., Bell, M.L., 2016.Association between greenness, urbanicity, and birth weight. Sci. Total Environ. 542 (Part A), 750–756.
Eeles, R., Goh, C., Castro, E., Bancroft, E., Guy, M., Al Olama, A.A., Easton, D., Kote-Jarai, Z., 2014.The genetic epidemiology of prostate cancer and its clinical implications. Nat. Rev. Urol. 11, 18–31.
Ellaway, A., Macintyre, S., Bonnefoy, X., 2005.Graffiti, greenery, and obesity in adults: sec-ondary analysis of European cross sectional survey. BMJ 331, 611–612.
Garcia-Closas, M., Berrington de Gonzalez, A., 2015.Invited commentary: screening and the elusive etiology of prostate cancer. Am. J. Epidemiol. 182, 390–393.
Gascon, M., Triguero-Mas, M., Martinez, D., Dadvand, P., Forns, J., Plasencia, A., Nieuwenhuijsen, M.J., 2015.Mental health benefits of long-term exposure to residen-tial green and blue spaces: a systematic review. Int. J. Environ. Res. Public Health 12, 4354–4379.
Gascon, M., Triguero-Mas, M., Martinez, D., Dadvand, P., Rojas-Rueda, D., Plasencia, A., Nieuwenhuijsen, M.J., 2016.Residential green spaces and mortality: a systematic re-view. Environ. Int. 86, 60–67.
Gilbert, R., Metcalfe, C., Oliver, S.E., Whiteman, D.C., Bain, C., Ness, A., Donovan, J., Hamdy, F., Neal, D.E., Lane, J.A., Martin, R.M., 2009.Life course sun exposure and risk of pros-tate cancer: population-based nested case-control study and meta-analysis. Int. J. Cancer 125, 1414–1423.
Gomez, S.L., Shariff-Marco, S., DeRouen, M., Keegan, T.H., Yen, I.H., Mujahid, M., Satariano, W.A., Glaser, S.L., 2015.The impact of neighborhood social and built environment fac-tors across the cancer continuum: current research, methodological considerations, and future directions. Cancer 121, 2314–2330.
Gong, Y., Gallacher, J., Palmer, S., Fone, D., 2014.Neighbourhood green space, physical function and participation in physical activities among elderly men: the Caerphilly Prospective study. Int. J. Behav. Nutr. Phys. Act. 11, 40.
Haas, G.P., Sakr, W.A., 1997.Epidemiology of prostate cancer. CA Cancer J. Clin. 47, 273–287.
Haenszel, W., Kurihara, M., 1968.Studies of Japanese migrants. I. Mortality from cancer and other diseases among Japanese in the United States. J. Natl. Cancer Inst. 40, 43–68.
Hartig, T., Evans, G.W., Jamner, L.D., Davis, D.S., Gärling, T., 2003.Tracking restoration in natural and urbanfield settings. J. Environ. Psychol. 23, 109–123.
Hartig, T., Mitchell, R., de Vries, S., Frumkin, H., 2014.Nature and health. Annu. Rev. Public Health 35, 207–228.
Hsing, A.W., Chokkalingam, A.P., 2006.Prostate cancer epidemiology. Front. Biosci. 11, 1388–1413.
Hu, Z., Liebens, J., Rao, K.R., 2008.Linking stroke mortality with air pollution, income, and greenness in northwest Florida: an ecological geographical study. Int. J. Health Geogr. 7, 20.
James, P., Banay, R.F., Hart, J.E., Laden, F., 2015.A review of the health benefits of green-ness. Curr. Epidemiol. Rep. 2, 131–142.
James, P., Hart, J.E., Banay, R.F., Laden, F., 2016.Exposure to greenness and mortality in a nationwide prospective cohort study of women. Environ. Health Perspect. 124, 1344–1352.
Kestens, Y., Thériault, M., Des Rosiers, F., 2004.The impact of surrounding land use and vegetation on single-family house prices. Environ. Plan. B: Plan. Des. 31, 539–567.
Klassen, A.C., Platz, E.A., 2006.What can geography tell us about prostate cancer? Am. J. Prev. Med. 30, S7–15.
Koutros, S., Beane Freeman, L.E., Lubin, J.H., Heltshe, S.L., Andreotti, G., Barry, K.H., DellaValle, C.T., Hoppin, J.A., Sandler, D.P., Lynch, C.F., Blair, A., Alavanja, M.C., 2013.
Risk of total and aggressive prostate cancer and pesticide use in the Agricultural Health Study. Am. J. Epidemiol. 177, 59–74.
Kruk, J., Czerniak, U., 2013.Physical activity and its relation to cancer risk: updating the evidence. Asian Pac. J. Cancer Prev. 14, 3993–4003.
Lachowycz, K., Jones, A.P., 2011.Greenspace and obesity: a systematic review of the evi-dence. Obes. Rev. 12, e183–e189.
Lee, A.C., Maheswaran, R., 2011.The health benefits of urban green spaces: a review of the evidence. J. Public Health 33, 212–222.
Li, F., Harmer, P.A., Cardinal, B.J., Bosworth, M., Acock, A., Johnson-Shelton, D., Moore, J.M., 2008.Built environment, adiposity, and physical activity in adults aged 50–75. Am. J. Prev. Med. 35, 38–46.
Lin, S.W., Wheeler, D.C., Park, Y., Cahoon, E.K., Hollenbeck, A.R., Freedman, D.M., Abnet, C.C., 2012.Prospective study of ultraviolet radiation exposure and risk of cancer in the United States. Int. J. Cancer 131, E1015–E1023.
Maas, J., van Dillen, S.M., Verheij, R.A., Groenewegen, P.P., 2009.Social contacts as a pos-sible mechanism behind the relation between green space and health. Health Place 15, 586–595.
Maas, J., Verheij, R.A., Groenewegen, P.P., de Vries, S., Spreeuwenberg, P., 2006.Green space, urbanity, and health: how strong is the relation? J. Epidemiol. Community Health 60, 587–592.
Maas, J., Verheij, R.A., Spreeuwenberg, P., Groenewegen, P.P., 2008.Physical activity as a possible mechanism behind the relationship between green space and health: a mul-tilevel analysis. BMC Public Health 8, 206.
McGregor, S.E., Courneya, K.S., Kopciuk, K.A., Tosevski, C., Friedenreich, C.M., 2013. Case-control study of lifetime alcohol intake and prostate cancer risk. Cancer Causes Con-trol 24, 451–461.
McMorris, O., Villeneuve, P.J., Su, J., Jerrett, M., 2015.Urban greenness and physical activity in a national survey of Canadians. Environ. Res. 137, 94–100.
Mitchell, R., Popham, F., 2008.Effect of exposure to natural environment on health in-equalities: an observational population study. Lancet 372, 1655–1660.
Nieuwenhuijsen, M.J., Kruize, H., Gidlow, C., Andrusaityte, S., Anto, J.M., Basagana, X., Cirach, M., Dadvand, P., Danileviciute, A., Donaire-Gonzalez, D., Garcia, J., Jerrett, M., Jones, M., Julvez, J., van Kempen, E., van Kamp, I., Maas, J., Seto, E., Smith, G., Triguero, M., Wendel-Vos, W., Wright, J., Zufferey, J., van den Hazel, P.J., Lawrence, R., Grazuleviciene, R., 2014.Positive health effects of the natural outdoor environ-ment in typical populations in different regions in Europe (PHENOTYPE): a study pro-gramme protocol. BMJ Open 4, e004951.
Pampalon, R., Raymond, G., 2000.A deprivation index for health and welfare planning in Quebec. Chronic Dis. Can. 21, 104–113.
Parent, M.E., Goldberg, M.S., Crouse, D.L., Ross, N.A., Chen, H., Valois, M.F., Liautaud, A., 2013.Traffic-related air pollution and prostate cancer risk: a case-control study in Montreal, Canada. Occup. Environ. Med. 70, 511–518.
Passchier-Vermeer, W., Passchier, W.F., 2000.Noise exposure and public health. Environ. Health Perspect. 108 (Suppl. 1), 123–131.
Pereira, G., Christian, H., Foster, S., Boruff, B.J., Bull, F., Knuiman, M., Giles-Corti, B., 2013.
The association between neighborhood greenness and weight status: an observation-al study in Perth Western Austrobservation-alia. Environ. Heobservation-alth 12, 49.
Pereira, G., Foster, S., Martin, K., Christian, H., Boruff, B.J., Knuiman, M., Giles-Corti, B., 2012.The association between neighborhood greenness and cardiovascular disease: an observational study. BMC Public Health 12, 466.
Raaschou-Nielsen, O., Andersen, Z.J., Hvidberg, M., Jensen, S.S., Ketzel, M., Sorensen, M., Hansen, J., Loft, S., Overvad, K., Tjonneland, A., 2011.Air pollution from traffic and cancer incidence: a Danish cohort study. Environ. Health 10, 67.
Ramis, R., Diggle, P., Cambra, K., Lopez-Abente, G., 2011.Prostate cancer and industrial pollution Risk around putative focus in a multi-source scenario. Environ. Int. 37, 577–585.
Rhew, I.C., Vander Stoep, A., Kearney, A., Smith, N.L., Dunbar, M.D., 2011.Validation of the normalized difference vegetation index as a measure of neighborhood greenness. Ann. Epidemiol. 21, 946–952.
Richardson, E., Pearce, J., Mitchell, R., Day, P., Kingham, S., 2010.The association between green space and cause-specific mortality in urban New Zealand: an ecological analy-sis of green space utility. BMC Public Health 10, 240.
Richardson, E.A., Mitchell, R., 2010.Gender differences in relationships between urban green space and health in the United Kingdom. Soc. Sci. Med. 71, 568–575.
Richardson, E.A., Pearce, J., Mitchell, R., Kingham, S., 2013.Role of physical activity in the relationship between urban green space and health. Public Health 127, 318–324.
Salinas, C.A., Tsodikov, A., Ishak-Howard, M., Cooney, K.A., 2014.Prostate cancer in young men: an important clinical entity. Nat. Rev. Urol. 11, 317–323.
Schwartz, J., 1994.Air pollution and daily mortality: a review and meta analysis. Environ. Res. 64, 36–52.
Shekarrizfard, M., Valois, M.F., Goldberg, M.S., Crouse, D., Ross, N., Parent, M.E., Yasmin, S., Hatzopoulou, M., 2015.Investigating the role of transportation models in epidemio-logic studies of traffic related air pollution and health effects. Environ. Res. 140, 282–291.
Song, C., Woodcock, C.E., Seto, K.C., Lenney, M.P., Macomber, S.A., 2001.Classification and change detection using Landsat TM data: when and how to correct atmospheric ef-fects? Remote Sens. Environ. 75, 230–244.
Steinmetz-Wood, M., Kestens, Y., 2015.Does the effect of walkable built environments vary by neighborhood socioeconomic status? Prev. Med. 81, 262–267.
Villeneuve, P.J., Jerrett, M., Su, J.G., Burnett, R.T., Chen, H., Wheeler, A.J., Goldberg, M.S., 2012.A cohort study relating urban green space with mortality in Ontario, Canada. Environ. Res. 115, 51–58.
WCRF; AICR, 2014.Diet, Nutrition, Physical Activity and Prostate Cancer. Continuous Up-date Project. World Cancer Research Fund International, American Institute to Cancer Research.
Weier, J., David, H., 2000.Measuring Vegetation (NDVI & EVI).
Wekesa, A., Harrison, M., Watson, R.W., 2015.Physical activity and its mechanistic effects on prostate cancer. Prostate Cancer Prostatic Dis. 18, 197–207.
Wendel-Vos, G.C., Schuit, A.J., de Niet, R., Boshuizen, H.C., Saris, W.H., Kromhout, D., 2004.
Factors of the physical environment associated with walking and bicycling. Med. Sci. Sports Exerc. 36, 725–730.
White, M.P., Alcock, I., Wheeler, B.W., Depledge, M.H., 2013.Would you be happier living in a greener urban area? Afixed-effects analysis of panel data. Psychol. Sci. 24, 920–928.
Wilker, E.H., Wu, C.D., McNeely, E., Mostofsky, E., Spengler, J., Wellenius, G.A., Mittleman, M.A., 2014.Green space and mortality following ischemic stroke. Environ. Res. 133, 42–48.
Wu, K.-S., Huo, X., Zhu, G.-H., 2008.Relationships between esophageal cancer and spatial environment factors by using Geographic Information System. Sci. Total Environ. 393, 219–225.
Yu, J., Lavoue, J., Parent, M.E., 2014.Sunlight exposure during leisure activities and risk of prostate cancer in Montreal, Canada, 2005–2009. BMC Public Health 14, 756.