OATAO is an open access repository that collects the work of Toulouse
researchers and makes it freely available over the web where possible
Any correspondence concerning this service should be sent
to the repository administrator:
tech-oatao@listes-diff.inp-toulouse.fr
This is an author’s version published in:
http://oatao.univ-toulouse.fr/20269
To cite this version:
Mota, Fatima Lisboa
and Teychené, Sébastien
and Biscans,
Béatrice
Measurement of the Nucleation and Growth Kinetics of
Some Middle Distillate Fuels and Their Blends with a Model
Biodiesel Fuel. (2014) Industrial & Engineering Chemistry
Research, 53 (7). 2811-2819. ISSN 0888-5885
Measurement of the Nucleation and Growth Kinetics of Some Middle
Distillate Fuels and Their Blends with a Model Biodiesel Fuel
F. L. Mota,* S. Teychéne, and B. Biscans
Laboratoire de Génie Chimique UMR 5503, Université de Toulouse, CNRS Toulouse, France
ABSTRACT: The nucleation kinetics and crystal growth rates of both middle distillates and their blends with a model biodiesel
were determined. As middle distillates are complex mixtures of hydrocarbons, a strategy was taken to define the solute and solvent. Different mixtures were prepared from different fuels, and a mixture law was used to calculate the mass percentages of each n-paraffin in the mixture; the difference between experimental and estimated compositions was negligible. An experimental device was set up to obtain the solubility curve of a distillate, for the first time. The application of classical homogeneous nucleation theory and Nývlt’s semiempirical approach allowed the nucleation rate, interfacial tension, and nucleation order to be obtained. The presence of esters did not have an influence on the solubility curve slope, but they had higher kinetic parameters and influenced the interfacial tension. The values found using the Nývlt law were typical for organic systems. Images were taken as a function of temperature and time, using thermomicroscopy, and image analysis enabled the crystal growth rates to be obtained. In general, the mixtures containing esters had higher growth rates. The solvent nature was found to play an important role in the growth, as the other alternative fuels studied have considerably higher growth rates.
1. INTRODUCTION
During the distillation of crude oil, the cuts from 180 to 360°C provide the so-called middle distillates, which correspond to complex mixtures of hydrocarbon components including saturates, aromatics, resins, and asphaltenes. Middle distillates include diesel, heating fuel (fuel-oil domestic, FOD), and jet fuel. Even though the characteristics of FOD and diesel are very similar, there are some non-negligible differences: FOD has higher nucleation temperatures, which can causefilter clogging in the case of use in diesel engines. The viscosity of FOD is significantly higher, which can cause problems in the fuel injection system. The final boiling point of FOD is higher, leading to the formation of deposits. The sulfur content of FOD is limited to 2000 ppm. The cetane number of FOD is significantly lower.1 Therefore, it is not recommended that FOD be used as an alternative to diesel, even if there is a higher tax rate of diesel than home heating oil. Nevertheless, it is still important to compare their behavior and characteristics.
The high price of crude oils and the worldwide concern about CO2 emissions support the production and use of
biofuels, as well as they are chemically less complex than conventional diesels. The final price of biodiesel and its properties depend on the fats and oils used in its production. Fatty acid methyl esters (FAMEs) of lipids such as soybean, rapeseed, and canola oils; used cooking oil; waste greases; and tallow are the most commonly used.2 Biodiesel from cheap vegetable oils, such as palm oil, with a large concentration of saturated fatty acid esters has the worst performance at low temperatures, having a tendency to crystallize, even though it is less vulnerable to oxidation and displays better combustion properties.3 Biodiesels generally have higher melting points than conventional diesels, because melting point is essentially determined by the amount of saturated esters (which have higher melting points) and does not depend on the composition of the unsaturated esters (which essentially act as a solvent). The presence of crystals in biodiesel, as in
conventional diesels, affects its viscosity, flowability, and filterability.4
Solutions have been proposed to overcome the problems with fatty acid esters at low temperatures: The preferred and most widely used approach is to blend biodiesel with conventional diesels. Conventional fuels in blends act as a solvent of the precipitated crystals at low temperature, which is reflected in improved low-temperature properties.5
As the temperature decreases, the solubility limit of a middle distillate can be reached, in which case the solution is no longer able to support all of the n-paraffins. The solubility limit of the heaviest n-paraffin components is commonly referred to as the cloud point (CP), also known as the wax appearance temperature (WAT), and it allows products to be differentiated in terms of performance. The problem of crystallization based onflow conditions, pressure, and temperature is detrimental to all activities in the oil industry, including production, transportation, refining, formulation of finished products, and use of fuels, and has major economic consequences. However, deviations from the expected crystallization behavior can occur as a result of the presence of other components in the crystal growth medium. These components, such as aromatics, asphaltenes, resins, water, additives, and shorter-chain n-paraffins, can impact a number of factors: crystal morphology, crystal growth rate, nucleation kinetics, crystallization thermo-dynamics, and dissolution kinetics.6
Solid formation, impossible at concentrations lower than the solubility onset at the given temperature and pressure conditions, can take place at concentrations higher than the theoretical solubility level. The difference between the actual value of the solute concentration at the crystallization operating
point and the theoretical solubility onset is called super-saturation (S) and is a fundamental factor in crystallization dynamics. Supersaturation is the driving force for both the initial nucleation step and the subsequent crystal growth.
The ideal zone for crystal growth is the metastable zone localized between the solubility and supersaturation curves. The metastable zone width (MSZW) is of major importance in crystallization and depends on saturation temperature, solvent, impurities or seeds, and stirring and cooling rates. Once the MSZW is determined, it is possible to carry out a crystallization process during which a constant supersaturation is maintained throughout the cooling, leading to nearly constant nucleation and crystal growth rates.7The polythermal technique is one of the most widely used methods for determining the MSZW. It involves cooling a solution at afixed rate until nucleation and repeating the process for a variety of rates. Thermal methods are very convenient for evaluating the onset of nucleation or the complete dissolution of crystals and also for obtaining information about their kinetics. The detection method used has a significant influence on the measured kinetics because there is a time lag between nucleation and the growth of crystals to a detectable size. The structure of the critical nucleus for a given supersaturation is theoretically impossible to establish, and the extent of nuclei growing beyond the critical size previous to detection strongly depends on the selected method.
Saturation temperatures and MSZWs were measured for the n-paraffins C18−C29 and for binary mixtures of C20 and C22
crystallized from n-dodecane and m-xylene solvents by Gerson et al.8 The MSZWs obtained illustrate the effects of growth environment on the crystallization process. The nucleation kinetics data obtained from induction-time measurements showed the effects of increasing solute concentration on the critical cluster size and the interfacial tension.8
The main objective of this work was to study the crystallization of n-paraffins in real middle distillates, as well as the impact of alternative fuels. For that purpose, it was proposed to expand the analytical devices used for monitoring crystallization and to rely on models of crystallization kinetics. Crystallization studies of middle distillates were carried out by the polythermal method using turbidimetry to detect the onset of nucleation and the end of dissolution. Thermal-optical microscopy was used to study the crystal growth and to link the thermal effects to the morphological changes.
2. THEORY
From a thermodynamic point of view, wax formation consists of a solid−liquid equilibrium in which the n-paraffins act as solutes and all of the other compounds act as solvents.9−11 Ideally, at a given temperature, the solute should include all of the species that, in the pure state, have melting points higher than or equal to that temperature.12,13The considered solvent is a typical one that mimics paraffin-based, aromatic, and oil-like solvents and does not crystallize at the studied temperatures.
Several theories have been introduced to rationalize the nucleation and growth kinetics; however, the complexity of the process and experimental limitations hinder their application to data analysis in most cases. Therefore, empirical approaches are most often preferred for the analysis of crystallization kinetics, most of which are initially based on classical nucleation theory.14
2.1. Solubility. The saturation curve and metastable zone width are essential pieces of information, as the shape of the
solubility curve defines the crystallization mode and the supersaturation conditions. The solubility curve, representing the equilibrium curve (equilibrium temperature vs percentage concentration of solute in solution), should be independent of the heating rate. However, the heating rate will influence the supersaturation and, therefore, the kinetics and MSZW. If the dissolution temperature is plotted against the heating rate for different mixtures that have the same solvent but different solute concentrations, the best-fit straight lines through these points could be extrapolated to zero heating rate. This will allow the saturation temperatures at an infinitesimally small rate of temperature change, and thus the equilibrium curve (solubility), to be obtained.7,8
If the logarithm of the solubility, in terms mole fraction (x), is plotted against the inverse of the absolute temperature (T), the dissolution enthalpy (ΔHdiss) and entropy (ΔSdiss) can be
determined by fitting the solubility data to the van’t Hoff equation, assuming ideal behavior and negligible heat capacity difference between the solute and the solvent15,16
= −Δ + Δ x H RT S R ln diss diss (1)
where R is the ideal gas constant. The van’t Hoff equation provides a robust thermodynamic model for single components dissolved in organic solvents at low mass fractions. When applied to polydisperse distributions, significant uncertainty can exist in the solubility because only the highest paraffins contribute to the crystal whereas the other components remain in the liquid phase at the nucleation point. For the scope of this work, this approximation is acceptable, but a better approximation of solubilities could be obtained from the general solid−liquid equilibrium equation that relies on the concentrations of the solute in the solid and liquid phases.9,17,18 2.2. Classical Homogeneous Nucleation Theory. The kinetics of paraffin gel formation was studied by Paso et al.15 using modelfluids consisting of monodisperse and polydisperse n-paraffin components dissolved in petroleum mineral oil. Even though heterogeneous primary nucleation dominates in the majority of industrial applications (almost inevitable in the presence of pollution and insoluble components), these authors considered that, for simple model fluids, the nucleation mechanism is homogeneous. The homogeneous nucleation of n-paraffins constitutes a special case that occurs spontaneously and randomly throughout the bulk melt and is not initiated by any extrinsic agents such as surfaces or impurities.19Thus, the same assumption is used here for real systems, namely, complex multicomponent hydrocarbon fuels, so that classical homoge-neous nucleation theory can be applied.
The main equations related to homogeneous nucleation theory can be found elsewhere.7 When expressed in terms of mole fractions, supersaturation (S) is given by
= Δ ⎛ − ⎝ ⎜ ⎞ ⎠ ⎟ S H R T T ln diss 1 1 s (2)
where Tsis the saturation temperature. Paso et al.15defined the
working equation for correlating classical homogeneous nucleation theory with experimentally measured nucleating points expressed as the difference between the dissolution and nucleation temperatures, ΔT (also known as the metastable zone width)
ρ π β *Δ ⎜−Δ ⎟− Δ Δ = ⎡ ⎣ ⎢ ⎛⎝ ⎞⎠ ⎛ ⎝ ⎜ ⎞ ⎠ ⎟⎤ ⎦ ⎥ A T B T B T B T exp 2 erfc (3)
whereβ is the cooling rate. The values of B and A/ρ* are fitting parameters obtained by a least-squares minimization procedure. If B and v are known, the value of interfacial tensionγ can be estimated.
2.3. Nývlt Law. If the considered section of the metastable zone is not too large, it is reasonable to assume that the saturation and supersaturation lines are linear and parallel and, consequently, that the nucleation rate equals the rate of solution supersaturation, at least when nucleation is detected. Combining these hypotheses with the assumption of a homogeneous nucleation rate, one can obtain the expression
β ΔT= −n * − + n C T n k n log 1 log d d 1 log n 1 log (4)
According to this equation, commonly known as Nývlt’s equation,21a plot of log(ΔT) against log β will render a straight line whose slope and intercept are related to the nucleation order n and the rate constant of the crystallization kn,
respectively. n describes the dependence of the nucleation rate on the supersaturation (potential of a solute/solvent system to nucleate quickly), whereas kn describes the dependence of the nucleation kinetics on the nature of the solute (a solute with higher intrinsic nucleation kinetics will have a higher kn value). For organic crystallizing systems, the
value of the nucleation order (n) is typically between 5 and 10.16,20
Despite of some severe underlying approximations, for industrial applications, this is a simple and useful way of characterizing systems and their crystallization kinetics based on a material balance made in a closed mixed vessel where the supersaturation is assured by cooling.21
2.4. Growth Kinetics. A basic expression is used to express the relationship between supersaturation and crystal growth
= Δ
G kG Cg (5)
where G is the linear crystal growth rate (length/time) and g is the (temperature-dependent) apparent order of crystal growth, which is normally between 1 and 2.7A number of experimental methods can be used to obtain the crystal growth rate data needed to obtain kinetics, such as induction-time measure-ments22and droplet-based microfluidics.23
3. MATERIALS AND METHODS
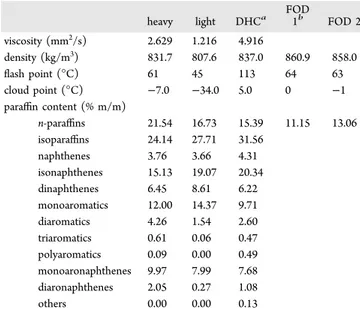
3.1. Materials. In this work, three types of fuels with different distillation ranges and paraffin levels [heavy, light, and distillate hydrocracker (DHC)] were used to prepare different diesels (B0). Table 1 lists the characteristics of each diesel sample, as well as those of the heating fuels studied (FOD1 and FOD2) for comparison. To prepare different blends of 7 vol % ester in the middle distillates (B7), esters from different sources were mixed; their natures and quantities are reported in Table 2.
Two standard mixtures were prepared from the original fuels, B0 and B7, and from them, several other mixtures were prepared with different percentages of fuels, keeping the solvent constant (aromatics, naphthenes, etc.) but changing the n-paraffin mass percentage and the paraffinic profile. The mixtures are denoted B0−B0 8 and B7−B7 6 for the mixtures containing esters (FAMEs). The compositions of these
mixtures were calculated by a weighted average, considering the composition of each original fuel and the formulation of each mixture. The n-paraffin content of each mixture is listed in Table 3.
3.2. Nucleation Experimental Setup. The crystallization reactor consisted of a triple-wall jacketed 50 cm3 glass vessel
with ports to accommodate turbidity and temperature probes. A magnetic stirrer (IKA-WERK ES5) was used to agitate the solution at a speed of 400 rpm, which ensured adequate mixing and avoided excessive splashing in the vessel. Cooling and heating programs were implemented using a cryothermostat (LAUDA Kryomat RUK 90S). Temperature data were recorded using a Pt100 resistance probe that was immersed in the solution and connected to the cryothermostat.
The turbidity probe introduced light from a light source (Avantes AvaLight DHS) into the reactor and collected the dispersed light, which was then analyzed (Avantes Multichannel Spectrophotometer). Afiber-optic system connected the probe to the light source and spectrophotometer. In this work, the scattered light intensity was analyzed in the wavelength range between 450 and 655 nm.
The crystallization reactor was initially loaded with approximately 20 cm3of the sample, and stirring was started Table 1. Original Fuel Characteristics
heavy light DHCa FOD 1b FOD 2 viscosity (mm2/s) 2.629 1.216 4.916 density (kg/m3) 831.7 807.6 837.0 860.9 858.0 flash point (°C) 61 45 113 64 63 cloud point (°C) −7.0 −34.0 5.0 0 −1 paraffin content (% m/m) n-paraffins 21.54 16.73 15.39 11.15 13.06 isoparaffins 24.14 27.71 31.56 naphthenes 3.76 3.66 4.31 isonaphthenes 15.13 19.07 20.34 dinaphthenes 6.45 8.61 6.22 monoaromatics 12.00 14.37 9.71 diaromatics 4.26 1.54 2.60 triaromatics 0.61 0.06 0.47 polyaromatics 0.09 0.00 0.49 monoaronaphthenes 9.97 7.99 7.68 diaronaphthenes 2.05 0.27 1.08 others 0.00 0.00 0.13
aDHC, fuel coming from new refinery schemas.bFOD, heating fuel. Table 2. FAME Analysis of the Oil Used to Prepare B7
fatty acid ester (% m/m)
palmitic acid 16:0 9.4 palmitoleic acid 16:1 0.3 17:1 0.1 stearic acid 18:0 2.1 oleic acid 18:1 56.4 linoleic acid 18:2 20.3 linolenic acid 18:3 8.6 arachidic acid 20:0 0.5 gondoic acid 20:1 1.1 behenic acid 22:0 0.3 erucic acid 22:1 0.2 lignoceric acid 24:0 0.1 nervonic acid 24:1 0.1 unidentified 0.6
at the desired rate (400 rpm). The solution wasfirst heated to 35 °C to ensure complete dissolution and minimize memory effects. The solution was then cooled, at a fixed cooling rate, until a temperature just below the appearance of the first crystals. The formation of crystals was accompanied by a rapid increase in the scattered light intensity. Then, a heating ramp was imposed, at the same rate as used in the cooling, until complete dissolution was achieved (35°C). The value at which the scattered light intensity increased was taken as the nucleation temperature, whereas that at which it decreased was taken as the “equilibrium” saturation temperature (dissolution). This procedure was repeated for different cooling/heating rates (2, 10, 30, and 60 °C/h), and at least three measurements were made at each rate. To minimize the amount of sample consumed, the same solution was recycled from batch to batch.
3.3. Thermomicroscopy. A microscope (LEICA DM RXA) equipped with a polarized light and a phase-contrast device was used. It was connected to a hot stage (Linkam Optical DSC600) that could operate in the range from−150 to 600°C controlled by a cooling system (LNP95). The heating/ cooling rates were limited to 6−1800 °C/h, with a precision of 0.01°C. Images were acquired using a sensitive charge-coupled-device color camera (PCO Sensicam QE).
The solution was placed in a quartz crucible (15 mm in diameter and 20 μL in volume), and a cooling rate was imposed, without any stirring. Image acquisition was done simultaneously. The linear growth rate was obtained by measuring the largest crystal dimension (the width) as a function of time (and temperature). A standard cooling rate of 0.5°C/min was used, and at least 10 crystals were followed to study the crystal growth rate.
4. RESULTS AND DISCUSSION
When a diesel (B0) is cooled, the solute is considered to be the n-paraffins, whereas the other components constitute the solvent. In the case of diesel/FAME (B7) mixtures, the saturated esters are considered as part of the solute as well. The solvent includes isoparaffins; naphthenes; isonaphthenes; dinaphthenes; mono-, di-, tri-, and polyaromatics; monoaro-and diaronaphthenes; monoaro-and a mass percentage lower than 0.1%
of other components, as shown in Table 1 for the different fuels.
As mentioned before, several different mixtures were prepared from different fuels. A mixture law was used to calculate their compositions: Given the density, the volume percentage and composition of pure fuels, and the formulation of the mixture, its composition can be calculated. Experimental data on the composition of each mixture were compared to the estimated values, and the standard deviations were negligible. For example, considering the n-paraffins, the standard deviation was 2.42% on average, which can be considered very good agreement.
The molecular weight (M) of each mixture was calculated by a weighted average considering the estimated mixture composition and the molecular weight of each component. From the density of each fuel and the formulation of each mixture, the mixture density (ρ) was estimated. Given M and ρ, the molar volume (v) was then estimated. These values, together with the concentrations of n-paraffins, are presented in Table 3, and they are in good agreement with the available literature values.24The values of M,ρ, and v were quite similar for all of the studied mixtures, even though the quantities of n-paraffins and their profiles were changed.
4.1. Diesel/Biodiesel Blends and Heating Fuels. The nucleation, Tn, and dissolution, Ts, temperatures were measured
for the different mixtures, and the corresponding differences (ΔT) are presented in Figures 1 and 2 for diesels and biodiesels, respectively. These values were averages of at least three different measurements, and the standard deviations in the absolute temperatures ranged between 0% and 11%. As expected, the dissolution temperature was always higher than the nucleation temperature, and the difference between them was higher at the highest rates. However, in both nucleation and dissolution, the rate did not have a great effect, and the temperatures can be considered almost constant as a function of cooling/heating rate. Initially, seven different rates were tested, but because it was found that the rate did not have a marked effect, only four rates were studied for the other samples. Turnbull and Cormia25showed that, from C16to C32, the relative undercooling for homogeneous nucleation,ΔT/Ts,
is∼0.04 instead of the ∼0.2 common to most organic materials. Table 3. Solution Properties, Fundamental Nucleation Parameters, Crystal Sizes, and Linear Growth Rates of Different Mixturesa
Cn‑paraffins(g/100 g) M (g/mol) ρ (kg/m3) v (dm3/mol) Ts(°C) S1°C/min γ (dyn/cm) rc(Å) n log(kn) L (μm) G (μm/s)
B0 18.88 201.89 825.53 0.245 −3.74 1.22 0.89 9.97 7.50 11.3 100 0.69 B0 2 19.35 206.72 827.94 0.250 −4.17 1.21 0.77 9.05 10.0 16.4 86 0.68 B0 4 18.41 197.09 823.16 0.239 −2.63 1.12 0.39 7.14 7.25 11.7 371 6.37 B0 5 17.02 177.55 814.42 0.218 −9.29 1.19 0.99 11.68 10.9 17.7 451 5.38 B0 7 17.93 209.84 826.06 0.254 −1.49 1.17 1.28 18.99 8.16 13.1 B0 8 17.43 187.11 818.30 0.229 −7.17 1.22 0.95 9.88 7.69 11.8 258 2.62 B7 18.68 201.74 829.07 0.243 −2.69 1.26 0.93 8.68 12.6 19.1 85 2.34 B7 2 19.19 206.32 831.48 0.248 −2.74 1.20 0.81 10.26 12.7 20.5 172 3.83 B7 3 16.67 180.41 817.96 0.221 −9.49 1.31 1.16 8.59 7.67 11.9 50 1.47 B7 4 18.39 199.45 827.96 0.241 −3.50 1.14 0.40 6.54 8.42 13.4 235 12.34 B7 5 17.12 187.72 821.84 0.228 −7.08 1.21 1.01 11.03 9.50 15.1 108 4.98 B7 6 18.16 197.11 826.66 0.238 −4.87 1.18 0.96 12.28 8.05 13.1 169 5.00 FOD 1 10.55 201.89 825.53 0.245 3.06 1.15 0.88 13.9 10.2 16.6 325 4.17 FOD 2 11.27 201.89 825.53 0.245 2.54 1.20 1.04 12.3 6.20 9.40 132 2.09 aC
n‑paraffins, concentration of normal paraffins; M, molecular weight; ρ, density; v; molecular volume; Ts, saturation temperature; S1°C/min,
supersaturation calculated at 1°C/min; γ, interfacial tension; rc, critical radius; n, apparent order of nucleation; log(kn), base-10 logarithm of the
The samples studied in this work hadΔT/Ts values between
0.008 and 0.013, which means that the maximum undercooling is lower for real systems than for model systems.
The diesels studied in this work were mixtures of three different fuels, and the higher the ratio of light to heavy, the lower the nucleation and dissolution temperatures, as in the cases of B0 5, B0 8, B7 3, and B7 5, where the quantities of light fuel were especially high. The quantity of DHC was also found to play an important role: The higher the DHC content, the higher the temperature, as in the case of B0 7, for which the same quantities of heavy and DHC were used.
The values obtained for the standard B0 sample were in good agreement with those commonly found for traditional diesels.3,26In addition, the types of curves found were similar to those found for model systems such as octacosane/toluene, but with very different dissolution and nucleation temperatures. Comparing the nucleation temperatures of the B7 mixtures with values available in the literature for traditional biodiesels,4,27 it can be seen that the diesel/esters blends prepared in this work had better cold flow properties (lower cloud points).
Comparing the mixtures based on B0 with the corresponding mixtures based on B7 (meaning that the quantities of light and DHC fuels were the same), it can be seen that the temperatures were in the same range, and the orders in which the samples
were classified were also the same. For example, B0 5 and B7 3 were the samples with the lowest nucleation and dissolution temperatures, whereas B0 2 and B7 2 had the highest. This means that the quantity of esters had almost no influence on the nucleation, as the quantity of n-paraffin played the major role. Thisfinding was expected because it can be seen in Table 3 that the esters had a maximum total saturated FAME content of 12%, which means that blending the middle distillates with 7 vol % esters resulted in a total saturated FAME content of less than 1% in any of the blends.
The heating fuels (FOD1 and FOD2) had by far the worst coldflow properties: from 1.4 and −0.4 °C for the nucleation temperature and from 3.40 to 2.55 °C for the dissolution temperature. The final distillation temperature of an FOD is higher than that of a conventional diesel. This means that there is more dissolution of the lighter paraffins and so the heavier paraffins will be more concentrated in the FOD, causing problems in cold-temperature behavior. The paraffin distribu-tion in FOD is bimodal and centered between C11 and C17, whereas for conventional diesels, the paraffin distribution is centered on C16. The amount of n-paraffins is higher in a conventional diesel but especially rich in light paraffins, which crystallize at lower temperatures, making the nucleation temperature lower.
4.3. Effect of Concentration. The solubility curves, expressed in terms of solute concentration, are shown in Figure 3 for mixtures based on both B0 and B7. This is thefirst
time that solubility curves have been measured for this type of complex system. It should be noted that the difference in the slopes of the solubility curves between B0 and B7 is negligible, so the esters have only a slight effect on the solubility slopes.
The concentrations in grams per 100 g were converted into mole fractions considering the molecular weights of the solute and solvent. This allowed for the application of the empirical van’t Hoff approach, even though this corresponds to a great simplification. The results of the dissolution properties are presented in Table 4: The differences between the B0 and B7 values are negligible, as expected because the same was seen in the solubility slopes.
If the obtained values are compared with literature values for model systems, such as monodisperse and polydisperse n-paraffins dissolved in mineral oil,4,15 the values for the real systems are lower: The quantities of components in the solute and solvent make the interactions weaker, so the energy needed to break them is lower. The dissolution enthalpy is associated
Figure 1.Difference between dissolution and nucleation temperatures for different cooling rates, for the following diesels (experimental error < 10%): (◆) B0, (■) B0 2, (Δ) B0 4, (×) B0 5, (□) B0 7, () B0 8.
Figure 2.Difference between dissolution and nucleation temperatures for different cooling rates for the following biodiesels (experimental error < 10%): (■) B7, (Δ) B7 2, (×) B7 3, (○) B7 4, (□) B7 5, (▲) B7 6.
Figure 3. Solubility curve of a diesel expressed in terms of concentrations of normal paraffins higher than 11 as a function of dissolution temperature: (■) B0 and (□) B7.
with the dissolution of a substance in a solvent at constant pressure resulting in infinite dilution. The energy change can be regarded as the endothermic breaking of bonds within the solute and within the solvent, followed by the formation of attractions between the solute and the solvent. Therefore, these values are highly dependent on solute and solvent interactions. 4.4. Nucleation Kinetics. Using the equations presented in section 2.2 to relate the critical undercooling measured by the polythermal approach as a function of cooling rate, an estimation of the crystal−solution interfacial tension was made that was considered to be crystal-face- and temper-ature-independent. The values of B and A/ρ* were obtained for each cooling rate, and the standard deviation between them was lower than 5%. Therefore, another minimization was done of all of the least-squares values corresponding to a mixture, andfixed B and A/ρ* values for a given mixture were obtained. This led to a single, cooling-rate-independent interfacial tension, as presented in Table 3. The supersaturation presented is that estimated at 1°C/min because this is the common rate used for measurements of thefiltering limit temperature. The presence of FAMEs increases the supersaturation at nucleation and the interfacial tension, as well as the critical radius and, consequently, the Gibbs energy. The composition of the mixtures changes, including the saturated, aromatic, resin, and asphalthene fractions. As a result, the interactions between the polar functional groups are changed, which is important to the structure and characteristics of the mixture.
It is known that the constraints on the liquid chains connected to the critical nucleus yield an entropic cost and, therefore, an increase in the interfacial tension.28Kraack et al.19 estimated the solid−liquid interfacial tensions of n-paraffins from 17 to 60 dyn/cm, and the values found in this work are considerably lower than theirs. Gerson et al.8 determined the interfacial tension from the induction time of docosane crystallized from dodecane, and their values are lower than those found in this work, although they were of the same order. The same is true in comparison to the values determined by Paso et al.15for monodisperse C36and C35and polydisperse n-paraffin components dissolved in petroleum mineral oil.
Three main variables govern the nucleation rate: temper-ature, supersaturation, and interfacial tension. The values of supersaturation and interfacial tension are presented in Table 3. Given the impossibility of performing molecular simulations to establish the nuclear structure, a constant A value equal to 1030 nuclei/cm3·s was considered.20 Consequently, the nucleation rate was calculated and represented as a function of supersaturation. As shown in Figure 4a, an extremely rapid increase in the nucleation rate was observed for B0 once some critical supersaturation level was exceeded, being the one with higher nucleation rates. It can be seen that, to obtain the same nucleation rate, higher supersaturation was required for B7 and FOD samples compared to B0, which means lower temper-atures and betterflowability. This means that, for B7 and FOD
to be used under the same conditions as B0, some additives should be employed.
This can be ensured if a comparison is made between the mixtures prepared from B0 and the corresponding mixtures prepared from B7. Thefirst have higher nucleation rates and, thus, more nuclei per unit volume and time, than the corresponding mixtures prepared from B7 (Figure 4b). Those mixtures have exactly the same quantities of heavy and DHC fuels, whereas the quantity of light fuel is slightly lower in the B7 mixtures given that they are blended with 7 vol % esters. It clearly appears from these figures that the presence of alternative fuels increases the nucleation rate.
The previous analytical approach based on classical nucleation theory allowed a characteristic parameter of the crystal−solution interactions to be obtained. Even though the nucleation rate was also obtained using this approach, another empirical approach was also used to describe nucleation kinetics, namely, the Nývlt law (section 2.3). The application of eq 4 leads to two empirical parameters, n and kn, and thefirst
aim of its application is to determine these values, considering the solubility curve slopes presented in Figure 3. The uncertainties in the slopes of the solubility curves are so low that they have no effect on the kinetic parameters presented in Table 3. For the mixtures studied in this work, the behavior was found to be similar to that of conventional organic systems, given that n is between 5 and 10, including those of the studied FODs. In general, the kinetic parameters in the presence of FAMEs are higher. In general, the lower the solubility of a solute in a given solvent, the higher the value of n, and the Table 4. Paraffin Dissolution Enthalpy (kJ/mol) and
Entropy (kJ/mol.K) Values Derived from the van’t Hoff Solubility Relation, Based on Experimental Dissolution Points
ΔHdiss(kJ/mol) ΔSdiss(kJ/mol·K)
B0 37.84± 6.18 0.12± 0.02
B7 40.56± 3.20 0.14± 0.01
Figure 4.Effects of supersaturation on the nucleation rate: (a) (―) B0, (- - -) B7, (− · −) FOD, (b) mixtures prepared from B0 [(―) B0, (■) B0 2, (◆) B0 5, (×) B0 8, (●) B0 4] and corresponding mixtures prepared from B7 [(―) B7, (□) B7 2, (◊) B7 3, (*) B7 5, (○) B7 6].
higher the nucleation temperature. This means that n is a useful parameter for assessing the effects of different solvents or solvent compositions on the metastability of a solution: Given that it is higher in the presence of FAMEs, this means that those mixtures have higher nucleation temperatures, and consequently, the applicability of those fuels is not possible unless some cold-behavior treatment is applied.
It should be mentioned that, for the FODs, the same solubility curve, molecular volume, and dissolution enthalpy as for B0 were considered. This can cause deviations from the real behavior, and the obtained results with models for FOD are just for comparison.
4.5. Experimental Growth Rate. Claudy and Létoffé and co-workers29,30 used optical microscopy in polarized light to study the crystallization of n-paraffins in middle distillates and concluded that it is the most appropriate mode for observing paraffin crystallization. The crystals obtained in this work were platelike with a high aspect ratio and a lozenge shape. Images of three different samples are presented in Figure 5.
The linear crystal growth rate was measured for each different mixture based on at least 10 different crystals, and the results are presented in Table 3, together with the crystal size (width, L) at a time delay after nucleation (30−50 s). Experimentally, it was seen that the presence of FAMEs did not have a marked effect on the crystal size but generally increased the crystal growth rate. The nature of the solvent plays an important role in the growth, as the FODs have considerably higher growth rates.
At low supersaturation, crystals can grow faster than they nucleate, resulting in a larger crystal size and narrow crystal size distribution. However, at higher supersaturation, crystal nucleation dominates crystal growth, ultimately resulting in smaller crystals and a broad crystal size distribution. As seen before, the FODs have lower supersaturation at nucleation than the other mixtures, and here, it was found that they have higher growth rates as well as larger crystals. In opposition, B0 mixtures have a slightly higher supersaturation at nucleation and a lower growth rate, as well as smaller crystals.
Considering a metastable zone sufficiently thin that the saturation and supersaturation curves are linear and parallel and growth predominates over nucleation, the supersaturation is converted into a temperature difference. Therefore, if a linear growth rate was measured at different cooling rates, and consequently, theΔT value was estimated, the values of kGand
g can be obtained by linearization of eq 5. The results for B0 and B7 are presented in Table 5, where it can be seen that the growth rate increased when the cooling rate increased. However, the maximum size of the crystals was almost unaffected. The growth order g increased with the growth rate and also with the metastable zone width. As mentioned before, for common organic systems, the value of g should be between 1 and 2, which means that B0 and B7 can be considered as common organic systems.
5. CONCLUSIONS
The aim of this work was to study crystallization kinetics for middle distillates, to better understand their coldflow behavior. First, a mixture law was used to calculate the paraffin contents of a mixture based on those of its constituent fuels. The concentrations of interest are those of n-paraffins (10 < C <50 g/100 g), and for these species, the standard deviation between the measured and estimated concentrations was 3.2%, which corresponds to very good agreement. The solute was defined as
the n-paraffins and the saturated esters; all of the other components (naphthenes, asphalthenes, aromatics) were considered as the solvent. Different mixtures were prepared from two standard mixtures, keeping the solvent and changing the mass percentage and profile of the paraffins.
An experimental device was set up to measure the dissolution and nucleation temperatures, and it was verified that the cooling/heating rate had a negligible effect on the nucleation/
Figure 5.Images of crystals of different mixtures: (a) B0, (b) B7, and (c) FOD.
dissolution temperatures. Solubility curves were obtained for the first time for such complex systems. It was seen that the esters had no influence on the solubility, but if the nature and source of esters are different, the effects can be different. The uncertainty in the slopes of the solubility curves was so small that there was no effect on the kinetic parameters.
The application of homogeneous nucleation theory allowed the nucleation rate to be calculated as a function of the supersaturation, which showed that the nucleation will be different depending on the nature of the sample. The interfacial tension between crystal and solution for the different samples studied was obtained, what allowed samples to be distinguished. The Nývlt law was applied to obtain the kinetic parameters, and it was seen that the order of nucleation was similar for all of the studied samples, so they could be considered as normal organic systems. The applicability of some studied mixtures as fuels will be possible only if they are subjected to some cold flow treatment, for example, with some additives.
A second experimental device was introduced to study the crystal growth rate. All of the studied samples had crystals of the same shape (platelike), with only the size and the supersaturation at nucleation changed. The linear crystal growth rate changed depending on the nature of the sample. A kinetic growth rate law was obtained for samples with and without esters, with the apparent order of growth being higher in the absence of esters.
■
AUTHOR INFORMATIONCorresponding Author
*E-mail: fatima.lisboamota@ensiacet.fr. Tel.: +33 534323604. Fax: +33 534323700.
Notes
The authors declare no competingfinancial interest.
■
NOMENCLATUREA = pre-exponential factor or collision factor B =fitting parameter
g = apparent order of crystal growth G = overall linear growth rate J = nucleation rate
kG= growth rate constant kn= nucleation rate constant
L = characteristic size of the crystal M = molecular weight
n = apparent order of nucleation r = radius
R = ideal gas constant S = supersaturation T = temperature v = molar volume
x = solubility, in mole fraction Greek Letters
β = cooling rate
γ = interfacial tension
ΔC = MSZW for a given temperature (in mass of solute per mass of solvent)
ΔH = enthalpy ΔS = entropy
ΔT = maximum undercooling ΔT/Ts = normalized metastable zone
ρ = density of the mixture (can be estimated)
ρ* = number density of critical nuclei (fitting parameter) Subscripts c = critical diss = dissolution n = nucleation s = dissolution Abbreviations B0 = diesel B7 = diesel/biodiesel mixture CP = cloud point
DHC = fuel coming from new refinery schemas FAME = fatty acid methyl ester
FOD = heating fuels (fuel-oil domestic) MSZW = metastable zone width
■
REFERENCES(1) Papin, G. Synthèse, caractérisation et évaluation de nouveaux additifs de tenue à froid des gazoles et fiouls domestiques. Ph.D. Thesis. Université de Bordeaux I, Talence, France, 2008.
(2) Dunn, R. O. Crystallization behavior of fatty acid methyl esters. J. Am. Oil Chem. Soc. 2008, 85, 961−972.
(3) Knothe, G.; Dunn, R. O. A Comprehensive Evaluation of the Melting Points of Fatty Acids and Esters Determined by Differential Scanning Calorimetry. J. Am. Oil Chem. Soc. 2009, 86, 843−856.
(4) Lopes, J. C. A.; Boros, L.; Krahenbuhl, M. A.; Meirelles, A. J. A.; Daridon, J. L.; Pauly, J.; Marrucho, I. M.; Coutinho, J. A. P. Prediction of cloud points of biodiesel. Energy Fuels 2008, 22, 747−752.
(5) Sarin, A.; Arora, R.; Singh, N.P..; Sarin, R.; Malhotra, R. K.; Kundu, K. Effect of blends of Palm-Jatropha-Pongamia biodiesels on cloud point and pour point. Energy 2009, 34, 2016−2021.
(6) Senra, M.; Paracharoensawad, E.; Scholand, T.; Fogler, H. S. Role of a Carboxylic Acid on the Crystallization, Deposition, and Gelation of Long-Chained n-Alkanes in Solution. Energy Fuels 2009, 23, 6040− 6047.
(7) Mullin, J. W. Crystallization, 4th ed.; Butterworth-Heinemann: Oxford, U.K., 2001.
(8) Gerson, A. R.; Roberts, K. J.; Sherwood, J. N.; Taggart, A. M.; Jackson, G. The Role of Growth Environment on the Crystallization of Normal Alkanes in the Homologous Series from C18H38to C29H60. J.
Cryst. Growth 1993, 128, 1176−1181.
(9) Coutinho, J. A. P.; Goncalves, C.; Marrucho, I. M.; Pauly, J.; Daridon, J. L. Paraffin crystallization in synthetic mixtures: Predictive local composition models revisited. Fluid Phase Equilib. 2005, 233, 28−33.
(10) Coutinho, J. A. P.; Mirante, F.; Ribeiro, J. C.; Sansot, J. M.; Daridon, J. L. Cloud and pour points in fuel blends. Fuel 2002, 81, 963−967.
Table 5. Linear Growth Rate (G, μm/s) as a Function of Cooling Rate (β) and the Respective Kinetic Parameters, kG
andg
β (°C/min)
S1(°C/min) 0.10 0.17 0.50 1.00 ln(kG) g
B0 1.22 0.44 0.48 0.69 1.24 9.25 2.54
B7 1.26 2.05 2.20 2.54 3.22 7.80 1.90
(11) Daridon, J. L.; Pauly, J.; Coutinho, J. A. P.; Montel, F. Solid− liquid−vapor phase boundary of a North Sea waxy crude: Measure-ment and modeling. Energy Fuels 2001, 15, 730−735.
(12) Coutinho, J. A. P. Predictive UNIQUAC: A new model for the description of multiphase solid−liquid equilibria in complex hydro-carbon mixtures. Ind. Eng. Chem. Res. 1998, 37, 4870−4875.
(13) Dauphin, C.; Daridon, J. L.; Coutinho, J. A. P.; Baylere, P.; Potin-Gautier, M. Wax content measurements in partially frozen paraffinic systems. Fluid Phase Equilib. 1999, 161, 135−151.
(14) Nývlt, J. Kinetics of nucleation in solutions. J. Cryst. Growth 1968, 3−4, 377−383.
(15) Paso, K.; Senra, M.; Yi, Y.; Sastry, A. M.; Fogler, H. S. Paraffin polydispersity facilitates mechanical gelation. Ind. Eng. Chem. Res. 2005, 44, 7242−7254.
(16) Ashbaugh, H. S.; Radulescu, A.; Prud’homme, R. K.; Schwahn, D.; Richter, D.; Fetters, L. J. Interaction of paraffin wax gels with random crystalline/amorphous hydrocarbon copolymers. Macro-molecules 2002, 35, 7044−7053.
(17) Coutinho, J. A. P.; Daridon, J. L. Low-pressure modeling of wax formation in crude oils. Energy Fuels 2001, 15, 1454−1460.
(18) Coutinho, J. A. P.; Knudsen, K.; Andersen, S. I.; Stenby, E. H. A local composition model for paraffinic solid solutions. Chem. Eng. Sci. 1996, 51, 3273−3282.
(19) Kraack, H.; Sirota, E. B.; Deutsch, M. Measurements of homogeneous nucleation in normal-alkanes. J. Chem. Phys. 2000, 112, 6873−6885.
(20) Myerson, A. S. Handbook of Industrial Crystallization, 2nd ed.; Butterworth-Heinemann: Woburn, MA, 2002.
(21) Nývlt, J. The Kinetics of Industrial Crystallization; Elsevier: New York, 1985.
(22) Teychené, S.; Biscans, B. Nucleation Kinetics of Polymorphs: Induction Period and Interfacial Energy Measurements. Cryst. Growth Des. 2008, 8, 1133−1139.
(23) Teychené, S.; Biscans, B. Crystal nucleation in a droplet based microfluidic crystallizer. Chem. Eng. Sci. 2012, 77, 242−248.
(24) Mesquita, F. M. R.; Feitosa, F. X.; Santiago, R. S.; de Sant’Ana, H. B. Density, Excess Volumes, and Partial Volumes of Binary Mixtures of Soybean Biodiesel + Diesel and Soybean Biodiesel + n-Hexadecane at Different Temperatures and Atmospheric Pressure. J. Chem. Eng. Data 2011, 56, 153−157.
(25) Turnbull, D.; Cormia, R. L. Kinetics of Crystal Nucleation in Some Normal Alkane Liquids. J. Chem. Phys. 1961, 34, 820−831.
(26) Gimzewski, E.; Audley, G. Monitoring Wax Crystallization in Diesel Using Differential Scanning Calorimetry (DSC) and Micro-calorimetry. Thermochim. Acta 1993, 214, 149−155.
(27) Coutinho, J. A. P.; Goncalves, M.; Pratas, M. J.; Batista, M. L. S.; Fernandes, V. F. S.; Pauly, J.; Daridon, J. L. Measurement and Modeling of Biodiesel Cold-Flow Properties. Energy Fuels 2010, 24, 2667−2674.
(28) Kraack, H.; Deutsch, M.; Sirota, E. B. n-Alkane homogeneous nucleation: Crossover to polymer behavior. Macromolecules 2000, 33, 6174−6184.
(29) Claudy, P.; Létoffé, J. M.; Bonardi, B.; Vassilakis, D.; Damin, B. Interactions between n-Alkanes and Cloud Point-Cold Filter Plugging Point Depressants in a Diesel Fuel. A Thermodynamic Study. Fuel 1993, 72, 821−827.
(30) Létoffé, J. M.; Claudy, P.; Kok, M. V.; Garcin, M.; Volle, J. L. Crude Oils: Characterization of Waxes Precipitated on Cooling by DSC and Thermomicroscopy. Fuel 1995, 74, 810−817.

![Figure 4. Effects of supersaturation on the nucleation rate: (a) (―) B0, (- - -) B7, (− · −) FOD, (b) mixtures prepared from B0 [(―) B0, ( ■ ) B0 2, ( ◆ ) B0 5, (×) B0 8, ( ● ) B0 4] and corresponding mixtures prepared from B7 [(―) B7, ( □ ) B7 2, ( ◊ ) B7](https://thumb-eu.123doks.com/thumbv2/123doknet/3274387.93923/7.938.485.849.101.548/effects-supersaturation-nucleation-mixtures-prepared-corresponding-mixtures-prepared.webp)
