1
Elements of Design of Passive Methane Oxidation Biosystems: Fundamental and 1
Practical Considerations about Compaction and Hydraulic Characteristics on Biogas 2 Migration 3 4 5
Bahar Ahoughalandaria, Alexandre R. Cabrala,* and Serge Leroueilb
6
7
a Geoenvironmental Group, Department of Civil Engineering, University of Sherbrooke,
8
Sherbrooke, Quebec, Canada J1K 2R1; [email protected] 9
b Department of Civil and Water Engineering, Université Laval, Quebec, Canada G1K 7P4;
10
* Corresponding author: Tel.: +1 819 821-7906. Postal address: 2500, boul. de l’Université, 12
Sherbrooke, Quebec, Canada J1K 2R1; [email protected] 13
14
Acknowledgements 15
This study received financial support from the Natural Science and Engineering Research 16
Council of Canada (NSERC) and Waste Management (WM Quebec Inc.), under the 17
collaborative research and development grant # CRD 379885-08 and from Discovery Grant 18
#170226. The invaluable help of Jean-Guy Lemelin, technician, must also be acknowledged. 19
2 Abstract
21
Passive methane oxidation biosystems (PMOBs) are often proposed as a means to reduce 22
fugitive landfill CH4 emissions, i.e. emissions not captured by gas collection systems.
23
However, current designs may lead to the formation of a capillary barrier along the interface 24
between the two main layers constituting passive biosystems, namely the methane oxidation 25
layer and gas distribution layer. The formation of a capillary barrier may result in restricted 26
upward flow of biogas at the base of methane oxidation layer, thereby leading to concentrated 27
biogas emissions in regions known as hotpots, where passive oxidation of biotic methane is 28
failing, if not absent. In this study, design criteria are introduced to assess the ease of biogas 29
flow across the gas distribution-methane oxidation layers’ interface. Laboratory experiments 30
were conducted to obtain the water retention curve, air permeability function and line of 31
optima (on Standard Proctor curve) of the materials used to construct the methane oxidation 32
layer of two experimental PMOBs at the St-Nicephore (Quebec, Canada) landfill. In addition, 33
the main characteristics for other materials were obtained from the literature. Design criteria 34
were then defined based on the degree of water saturation at the lines of optima and the 35
pattern of air permeability functions and water retention curves. Considering these criteria in 36
the design of PMOBs is fundamental to reduce the risk of creating hotspots when 37
implementing PMOBs. 38
39
Keywords: Passive methane oxidation Biosystems; Gas flow behaviour; Capillary barrier 40
effect; Water retention curve; Standard Proctor curve 41
3 1 Introduction
42
Passive methane oxidation biosystems (PMOBs) are considered as cost-effective solutions to 43
reduce fugitive CH4 emissions, i.e. emissions not captured by gas collection systems (e.g.
44
Cabral et al. 2010b; Capanema and Cabral 2012; He et al. 2012; Huber-Humer et al. 2009; 45
Ndanga et al. 2015; Roncato and Cabral 2012; Scheutz et al. 2009). Generally, a PMOB 46
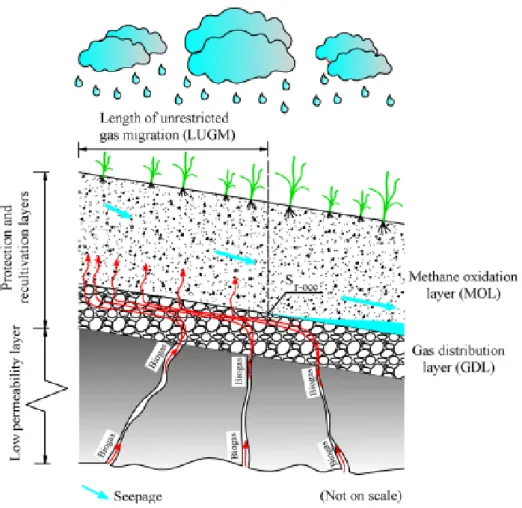
consists of two main layers: the near surface methane oxidation layer, where methanotrophic 47
bacteria oxidize CH4 into CO2, and the underlying gas distribution layer, mainly composed of
48
coarse-grained materials. The main function of the gas distribution layer is to intercept 49
fugitive emissions and distribute them as uniformly as possible at the base of the methane 50
oxidation layer, as illustrated schematically in Fig. 1. 51
The methane oxidation rate of PMOBs depends on several environmental and operational 52
conditions, including the uniformity of the CH4 loading (upward flow of fugitive biogas) at
53
the base of the methane oxidation layer. Greater uniformity facilitates the work of 54
methanotrophic bacteria, which results in greater CH4 oxidation rates (Cabral et al. 2010a;
55
Fredenslund et al. 2010; Scheutz et al. 2011). 56
The contrast between the unsaturated hydraulic properties of the constituent materials 57
forming the gas distribution and methane oxidation layers leads to the formation of a 58
capillary barrier along their interface, which leads to moisture accumulation, i.e. an 59
increasing degree of water saturation along the interface between gas distribution and 60
methane oxidation layers, from the top to the bottom of the slope. Since degree of water 61
saturation is a key parameter controlling gas flow behaviour through unsaturated soils, the 62
upward migration of fugitive biogas may be diverted within the gas distribution layer towards 63
the drier (upslope) parts of the biosystem. This may eventually lead to the creation of a 64
4
hotspot, i.e. a region of high CH4 fluxes (Bohn and Jager 2011; Cabral et al. 2010a; Röwer et
65
al. 2012) and surface CH4 concentrations that can be higher than acceptable by legislation.
66
Several environmental and biological aspects of methane oxidation in PMOBs have been well 67
documented in the technical literature (Ait-Benichou et al. 2009; Capanema and Cabral 2012; 68
Chi et al. 2012; Einola et al. 2007; Gebert et al. 2011; He et al. 2012; Huber-Humer et al. 69
2009; Ndanga et al. 2015; Roncato and Cabral 2012; Scheutz et al. 2011; Tate 2015). 70
Likewise, the literature abounds with studies that document and analyze air flow through 71
unsaturated soils (Blackwell et al. 1990; Fredlund and Rahardjo 1993; Fredlund et al. 2012; 72
Lu and Likos 2004; Vaughan 2003), the influence of water content on the coefficient of air 73
permeability (Jucá and Maciel 2006; Langfelder et al. 1968; Maciel and Jucá 2000; Marinho 74
et al. 2001; Springer et al. 1998; Tang et al. 2011), and the design of oxygen barriers to 75
prevent acid mine drainage (Bussière et al. 2003; Cabral et al. 2000; Maqsoud et al. 2011; 76
Mbonimpa et al. 2003; Yanful 1993). 77
On the other hand, very little has been published about the effects of capillary barriers on 78
CH4 oxidation. For example, Tétreault et al. (2013) conducted a series of numerical
79
simulations to assess the behaviour of two sloped PMOBs whose methane oxidation and gas 80
distribution layers formed capillary barriers. Their results showed that moisture content 81
values were high all along the interfaces, which explained the concentrated biogas fluxes 82
usually found near the top of the two large-scale experimental plots. This behaviour was also 83
observed by Berger et al. (2005), who constructed and monitored the behaviour of an inclined 84
PMOB in the laboratory. In order to minimize the pore obstruction by water associated with 85
the capillary barrier effect, Cassini et al. (2017) constructed an experimental PMOB with a 86
jagged (“zig-zag shape”) interface between gas distribution and methane oxidation layers. 87
With this very innovative concept, the pores in methane oxidation layer close to the interface 88
and near every crest would be dry enough to allow unrestricted upward flow of biogas. 89
5
Despite the fact that various field experiments have been presented in the technical literature, 90
proper design criteria for PMOBs - taking into consideration the capillary barrier effect and 91
its consequences on upward biogas flow - are still lacking. The purpose of such criteria would 92
be to construct PMOBs with the longest possible length along the interface between the gas 93
distribution and methane oxidation layers where upward gas migration is unrestricted. This 94
length is referred herein as the length of unrestricted gas migration (LUGM) It is the only 95
design criterion considered herein. 96
Samples from the methane oxidation layers of two experimental PMOBs constructed at the 97
St-Nicephore (Quebec, Canada) landfill were analyzed in the laboratory in order to determine 98
their main geotechnical parameters and subsequently to assess gas flow under unsaturated 99
conditions at various initial dry density and water content values. A design parameter, namely 100
the volumetric content at occlusion (θa_occ), associated with the design criterion LUGM, is
101
proposed (see also Ahoughalandari and Cabral 2016). Its determination can be achieved 102
using simple geotechnical tools, such as the water retention curve and compaction (Standard 103
Proctor) curve. Ultimately, design steps are proposed based on the use of the line of optima of 104
the compaction curve, alone or combined with the water retention curve and air permeability 105
function, when the latter two are available. 106
The main limitation of the proposed methodology to obtain the fundamental parameters used 107
in the design of PMOBs is associated with the limited number of materials actually 108
characterized in order to develop design parameter. However, the methodology was also 109
applied to materials whose main characteristics were obtained from the literature. 110
111
Fig. 1 Schematic layout of a passive methane oxidation biosystem 112
113
6 2 Materials and Methods
114
2.1 Materials 115
The material used to construct the methane oxidation layer of the first experimental PMOB 116
was a mixture of five volumes of compost and one volume of coarse sand (D10 = 0.07mm,
117
D85 = 0.8mm, and the coefficient of uniformity (Cu) = 4.3) with the following characteristics:
118
organic matter content (fOC) equal to 17.8% go-m/gdry-soil; specific gravity (Gs) equal to 2.24;
119
optimum water content (wopt) and maximum dry density (ρd-max) equal to 43% and 1080
120
kg/m3, respectively (Standard Proctor). The methane oxidation layer of the second PMOB
121
was constituted of uniform sand (D50 = 0.15mm and Cu = 2.25) with Gs = 2.71, wopt ~ 12.0%,
122
ρd-max = 1750 kg/m3.
123
The sand-compost mixture has been reported to show high methane oxidation capacity both 124
in laboratory and field conditions (Cabral et al. 2010b; Roncato and Cabral 2012). The fine 125
sand was selected by Ndanga et al. (2015) to be used in a multi-layer methane oxidation layer 126
that showed very high methane oxidation rate both in laboratory-scale column experiments 127
and in the field. 128
129
2.2 Testing 130
The Standard Proctor test for both materials was performed according to ASTM-D698 131
(2012). Several test points were chosen to obtain the water retention curve and coefficient of 132
air permeability, ka (m/s), of the materials for a wide range of initial dry density and water
133
content values (circles in Fig. 2). The compaction effort and method to prepare samples to 134
determine the water retention curve and ka were different from those used to obtain the
135
compaction curve (Standard Proctor). 136
7 137
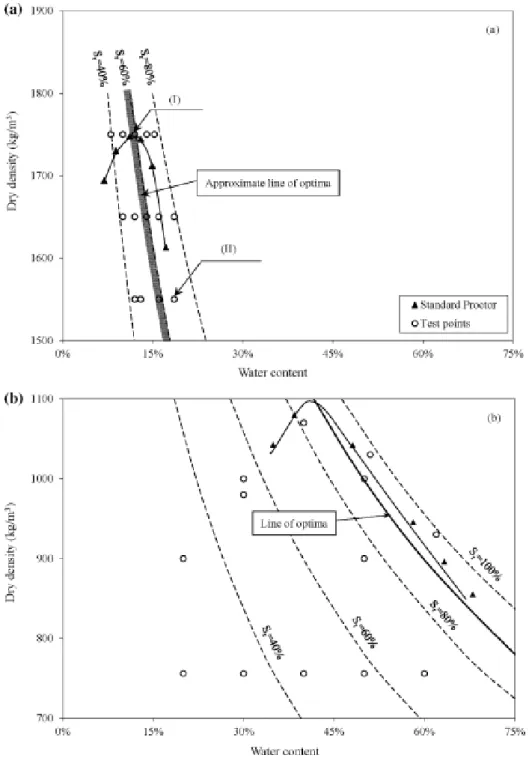
Fig. 2 Standard Proctor curves and test points of (a) fine sand, and (b) sand-compost mixture 138
139
Test points to determine ka and water retention curve were selected along 3 constant initial
140
dry density paths (1550 kg/m3, 1650 kg/m3 and 1750 kg/m3) for the fine sand. In the case of
141
the sand-compost mixture, the test points were selected as follows: 4 initial water content and 142
initial dry density values superimposing the Standard Proctor curve (herein denominated 143
“Proctor path”) and 3 constant initial dry density paths (750 kg/m3 (in situ value), 900 kg/m3
144
and 1000 kg/m3). Samples with the required amount of water were kept in plastic bags for at
145
least 48 hours before testing to allow the homogenization of moisture. 146
147
2.1.1 Water Retention Curve 148
The water retention curves were obtained using the modular laboratory instrument HYPROP 149
(UMS GmbH) and following its manual (UMS 2013). With this instrument, it is possible to 150
determine the water retention curve (drying path) of a vertical soil column based on the 151
evaporation method proposed by Wind (1968). 152
153
2.1.2 Coefficient of Air Permeability 154
The coefficient of air permeability (ka) was measured using a soap flow meter connected to
155
the inlet of an adapted triaxial cell (see schematic as insert in Fig. 4). Each sample was 156
compacted in a membrane surrounded by a rigid mold adapted to the triaxial cell. This mold 157
is equipped with two holes on both sides, through which vacuum is applied during sample 158
preparation. The application of vacuum through these holes ensures that the flexible 159
8
membrane sticks adequately to the mold and to the sample, thereby preventing air from 160
flowing between the membrane and the sample. Once the sample preparation is completed, 161
vacuum application is discontinued, but the mold remains in place. The mold was found to be 162
an excellent substitute for the required confining pressure during the air permeability 163
experiments. Several tests were performed to verify this assertion. In order to avoid any air 164
leakage, both ends of the sample were sealed with two O-rings. 165
Finally, the ka for each test point (circles in Fig. 2) was calculated for differential air pressure
166
values ranging from 0.5 to 5.0 kPa, in increments of 0.5 kPa, as follows: 167 168 ν A ) P (P g P Δx μ Q 2 k 2 s 2 e s a − × × × × × × × = (1) 169 170
where Ps (Pa) is the absolute outlet air pressure, Pe (Pa) is the absolute inlet air pressure, Q is
171
the volumetric air flow rate (m3/s), A is the cross-sectional area of the sample (m2), ∆x is the
172
sample’s height (m), g is the acceleration of gravity (m/s2), µ is the dynamic viscosity of air
173
at ambient temperature (Pa.s), and ν is the kinematic viscosity of air at ambient temperature 174
(m2/s).
175
In addition, the gas intrinsic permeability (m2) of the porous medium, which is independent
176
of the nature of the migrating gas, was calculated as follows: 177 178 g ν k K= a× (2) 179 180
9 3 Results
181
3.1 Fine Sand 182
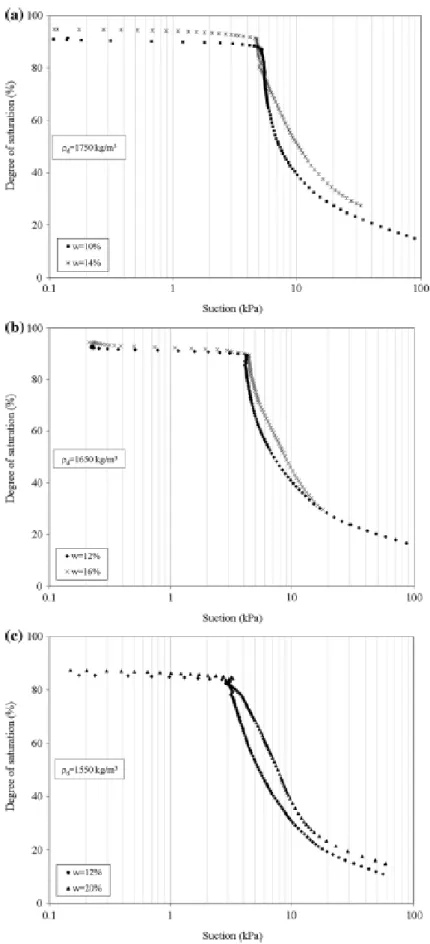
Fig. 3 presents the water retention curves of fine sand samples at each of the three values of 183
initial dry density (Fig. 2a) and two initial water content values: one on the dry and the other 184
on the wet side of the line of optima. Water retention curves of the remaining test points 185
(circles in Fig. 2a) led to results quite similar to those shown in Fig. 3 and are therefore not 186
presented. As can be observed, for all initial dry density values in Fig. 3, the air entry values 187
of the sand are easily identifiable: they correspond to the suction values where the samples 188
start to desaturate abruptly. It is noteworthy that the samples underwent negligible reduction 189
in degree of water saturation for suction values lower than their respective air entry values. 190
As expected, Fig. 3 shows that the air entry value increases from ~3 kPa to ~5 kPa with the 191
increase in initial dry density value from 1550 kg/m3 to 1750 kg/m3. Otherwise, air entry
192
values for this material are approximately the same for both the dry and wet sides of optima. 193
194
Fig. 3 Water retention curves of fine sand samples at two initial water content values (one dry 195
and the other wet of the line of optima) and three different values of initial dry density; (a) 196
1750 kg/m3, (b) 1650 kg/m3 and (c) 1550 kg/m3
197 198
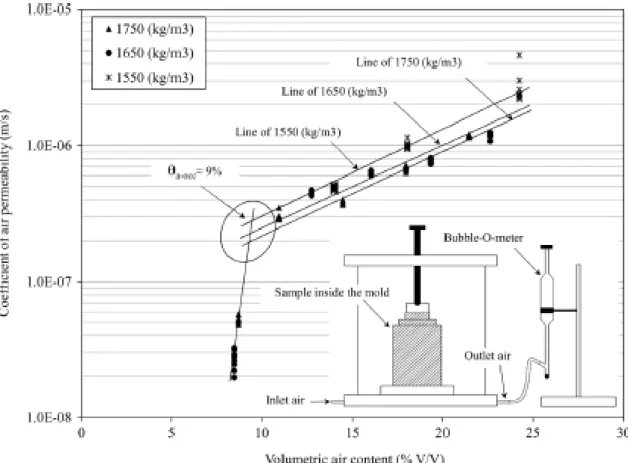
Fig. 4 Variations in the coefficient of air permeability of fine sand with volumetric air content 199
(θa), at several values of differential pressure
200
201
The relationship between the measured coefficient of air permeability and volumetric air 202
content, herein denominated ka-function, is presented in Fig. 4 for the three values of initial
10
dry density. Volumetric air content (θa) is defined as the ratio of the volume of air-filled pores
204
to the total volume of a representative sample of the soil. Each point in Fig. 4 represents the 205
value of ka obtained at a particular θa and differential pressure value. Variations in volumetric
206
air content (θa) are attributed to the simultaneous changes in initial dry density and water
207
content of the sample. It is not clearly visible in the plot, but several data points 208
corresponding to several values of differential pressure nearly coincide, indicating that the 209
magnitude of the differential air pressure had a minor effect on the ka value of the compacted
210
samples tested. 211
Fig. 4 shows that the logarithm of the coefficient of air permeability (ka) decreases steadily
212
between θa = 25% and ~9%. However, in the region indicated by an ellipse in Fig. 4, i.e.
213
when θa ~ 9%, the pattern of decrease in ka changes, with small decreases in θa leading to
214
much more important decreases in ka. The value of θa associated with this change in pattern is
215
denominated herein “occlusion value”, or θa-occ. In the particular case of Fig. 4, θa-occ ≈ 9%,
216
which is in fact the practical threshold of detectable air flow during the experiments. This 217
value corresponds to the degree of water saturation between 70% and 75%. The latter values 218
are greater than the degree of water saturation associated with the line of optima (55%-60%; 219
Fig. 2a). Therefore, what defines the point of occlusion, i.e. θ = θa-occ, occurred on the wet
220
side of the line of optima. 221
There is probably a transition zone for the region defined by 8.5% < θa < 11%, for which air
222
permeability tests were not performed. In any case, it appears from the shape of the graph that 223
the radius of curvature within this zone would be small. 224
According to Fig. 4, at a given θa, the ka tends to decrease as the initial dry density increases,
225
but the differences are rather small. For example, the tests singled out by arrows (I) and (II) 226
11
in Fig. 2a have nearly the same θa (≈ 15%), and ka (~ 4x10⁻⁷ m/s for (I), and ~ 5x10⁻⁷ m/s for
227
(II)). 228
Since the ambient temperature was constant during air permeability tests, Fig. 4 can also 229
represent the pattern of gas intrinsic permeability variations with θa. Accordingly, it would be
230
possible to use the data in Fig. 4 to assess the CH4 flow behaviour, instead of the flow
231 behavior of air. 232 233 3.2 Sand-compost Mixture 234 235
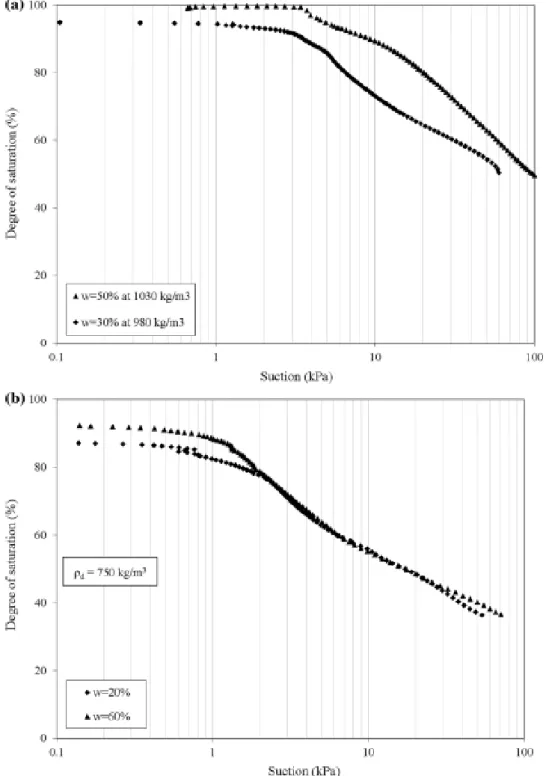
Fig. 5 Water retention curves of sand-compost mixture samples at two initial water content 236
values (dry and wet of optima) and at: (a) Standard Proctor dry densities (about 1000 kg/m3),
237
and (b) in situ dry density (750 kg/m3)
238 239
Fig. 5 presents the water retention curves of representative samples of the sand-compost 240
mixture. As the initial dry density value was the same on each initial dry density path, very 241
small differences were observed between water retention curves obtained for the “test 242
points”, indicated in Fig. 2b. Therefore, only representative water retention curves are 243
presented in Fig. 5. Both water retention curves in Fig. 5a were obtained with samples 244
prepared at two initial dry density and water content values along the Standard Proctor curve, 245
one on the dry side and the other on the wet side. Those presented in Fig. 5b were obtained 246
with samples compacted to attain 750 kg/m3, which is the in situ dry density of a PMOB
247
tested at the St-Nicephore landfill. 248
12
The air entry values are not as well defined as they were for the fine sand. Indeed, degree of 249
water saturation started to decrease gradually for suction values lower than the value 250
associated with the commencement of the desaturation zone. Accordingly, the radii of 251
curvature around the air entry values are bigger than those observed in water retention curves 252
of the fine sand. Air entry values values were ~1 kPa for the samples compacted at initial dry 253
density value equal to 750 kg/m3 and greater than 4 kPa for initial dry density value ~ 1000
254
kg/m3.
255 256
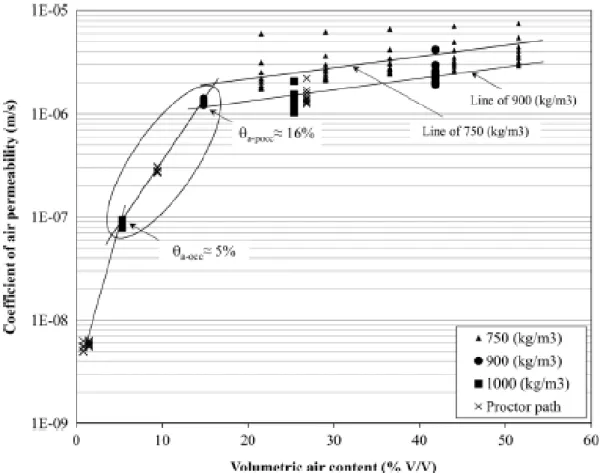
Fig. 6 Variations in coefficient of air permeability of sand-compost mixture with volumetric 257
air content at several differential pressure values 258
259
The air permeability function (ka-function) of the sand-compost mixture is shown in Fig. 6
260
where, for each test point, the ka value was also measured at several differential pressure
261
values. As in the previous case, data points corresponding to several values of differential 262
pressure coincide. Since all tests were performed at constant ambient temperature, the plot in 263
Fig. 6 can also represent the pattern of gas intrinsic permeability. 264
The curve in Fig. 6 can be subdivided into three zones, which are delimited by two 265
volumetric air content values. The first one is θa ≈ 5%. Below this value the obtainment of the
266
ka was challenging (the soap bubble inside the flowmeter was nearly immobile) and θa ≈ 5%
267
can be considered as the “occlusion value”, or θa-occ. The second delimiting value is θa ≈
268
16%. For lower θa values soap bubble movement inside the flowmeter was easily measurable,
269
therefore although the ka-function is steep, it is not as much as when θa < 5%. In the 3rd zone
270
(θa > 16%) the ka-function is considerably flatter. A practical nomenclature for this second
13
delimiting value (θa ≈ 16%) is conservative occlusion value, or conservative θa-occ. In the
272
case of the sand-compost, a transition zone can therefore be identified between conservative 273
θa-occ and θa-occ (ellipse in Fig. 6).
274
For the sand-compost, conservative θa-occ corresponds to the degree of water saturation
275
between 73% and 77%, which is lower than the degree of water saturation associated with the 276
line of optima (~90% in Fig. 2b). θa-occ occurs when the degree of water saturation lies
277
between 91% and 92%, i.e. approximately the degree of water saturation at the line of optima 278
(and the degree of water saturation value associated with air entry value; Fig. 5b). 279
Springer et al. (1998) also identified 3 zones in the ka-function obtained following tests with
280
silty sand samples, compacted by dropping and stabbing on a constant dry density path. The 281
first zone was identified as the zone of emergence of air permeability at air entry value. The 282
second was associated with the maximum rate of air permeability variation until the 283
gravitational drainage ceased, and the third was associated with the lowest rate of changes for 284
lower values of volumetric water content (therefore greater values of volumetric air content 285
on a constant dry density path). 286
287
4 Discussion 288
4.1 Relationships between the shapes of the Standard Proctor Curve, water 289
retention curve and air permeability function 290
291
The establishment of a relationship between unsaturated gas and water flow has been the 292
focus of several studies. For example, Ball et al. (1988) adapted an exponential relationship 293
between hydraulic conductivity and water-filled porosity to relate the air permeability to the 294
14
air-filled porosity, and validated it experimentally using samples of silty and clayey loam. 295
Ba-Te et al. (2005) obtained a relationship for the coefficient of air permeability (ka) as a
296
function of suction, by substituting the fitting equation of the water retention curve by an 297
empirical relationship between ka and degree of water saturation. They validated this
298
relationship using data sets from Singapore residual soils and Japanese soils. Kamiya et al. 299
(2006) developed an apparatus to measure ka, degree of water saturation and suction,
300
simultaneously. Their results show a clear similarity between the shapes of water retention 301
curves and curves of ka versus suction for a river silty sand and three types of sandy soils.
302
Ultimately, such relationships – in fact, the parameters that describe the shape of the curves – 303
may be used to infer the point where pores become occluded (θa-occ and/or conservative
304
θa-occ). This is an essential step in determining the length of unrestricted gas migration
305
(LUGM). 306
Relationships derived for materials tested in this study 307
The relationships between water retention curves, air permeability functions (ka-functions)
308
and Standard Proctor curves were identified in the cases of the fine sand and sand-compost 309
mixtures tested in this study. For both materials, the shapes of water retention curve in the 310
vicinity of the air entry value (Fig. 3 and Fig. 5) show similarities with the corresponding 311
ka-functions in the vicinity of θa-occ, for fine sand (Fig. 4), and between conservative θa-occ
312
and θa-occ, for sand-compost (Fig. 6).
313
It can be observed that the narrower the horizontal distance between the isolines of the degree 314
of water saturation on the Standard Proctor curves (Fig. 2), the steeper the slope of the 315
desaturation zone in the water retention curves (Fig. 3 and Fig. 5), and the steeper the slope of 316
ka-functions where θa > θa-occ (fine sand; Fig. 4) or θa > conservative θa-occ (sand-compost;
317
Fig. 6). The Standard Proctor curve for the sand-compost mixture (Fig. 2b) spans over a 318
15
much greater range of water content values than that of the fine sand (Fig. 2a). Accordingly, 319
the isolines of degree of water saturation are wider apart in the case of sand-compost. On a 320
constant dry density path, from the isoline corresponding to the degree of water saturation at 321
occlusion value for the fine sand (70%-75%: see section 3.1) a reduction of 20% in degree of 322
water saturation corresponded to a meager decrease of ~5% in water content. In the case of 323
the sand-compost mixture the same 20% decrease from the isoline associated with the degree 324
of water saturation at occlusion value (91%-92%: see section 3.2) would lead to ~18% 325
decrease in water content. In practical terms, this means that slight changes in water content 326
in the fine sand may lead to pore occlusion, while the sand-compost mixture requires greater 327
increments in moisture to reach occlusion. 328
For fine sand, the water retention curve along the slope of the desaturation zone (Fig. 3a,b 329
and c) is considerably steeper than for the sand-compost mixture (Fig. 5a,b). Indeed, a 20% 330
reduction of degree of water saturation corresponds to only 4 kPa increase in suction for fine 331
sand (Fig. 3), but nearly 35 kPa for sand-compost (Fig. 5). When θa > θa_occ or θa >
332
conservative θa_occ, the slope of the ka-function is steeper for fine sand. Indeed, a 15%
333
reduction of volumetric air content in fine sand leads to nearly one order of magnitude 334
decrease of ka, whereas it remains within the same order of magnitude for the sand-compost
335
mixture. It is noteworthy that the slope of the ka-function reflects the sensitivity of ka value to
336
changes in volumetric air content (or degree of water saturation under constant dry density 337
conditions). 338
339
Relationships derived for materials tested in other studies 340
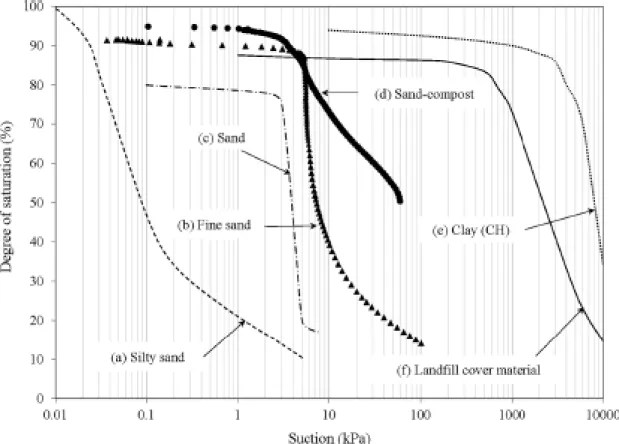
Fig. 7 presents the water retention curve of materials tested in several other studies, in 341
addition to representative water retention curves of the fine sand (Fig. 3) and sand-compost 342
16
(Fig. 5). As can be observed, the air entry values of the landfill cover material (Marinho et al. 343
2001), the clay (Jucá and Maciel 2006) and the silty sand (Springer et al. 1998) are not very 344
well defined, as is the case of the sand-compost tested in this study. The shapes of the water 345
retention curve show that desaturation of these materials occurs gradually, in particular in the 346
region where suction values are lower than those associated with the desaturation zone. 347
Similarly to the fine sand tested in this study, the air entry value of the sand tested by Kamiya 348
et al. (2006) is clearly identified and both materials show abrupt desaturation once the air 349
entry value is attained. 350
The steepest desaturation zone observed in Fig. 7 occurred for the fine sand tested in this 351
study, followed by the sand tested by Kamiya et al. (2006). The steepness of the desaturation 352
zone of the 3 other materials, namely landfill cover (Marinho et al. 2001), silty sand (Springer 353
et al. 1998) and sand-compost (this study) are rather similar, with the least steep being that of 354
the sand-compost. In comparison with other published cases, the soils tested in the present 355
study can be considered as representative of two extremes. 356
357
Fig. 7 Water retention curves of (a) silty sand adapted from Springer et al. (1998), (b) fine 358
sand (this study), (c) sand adapted from Kamiya et al. (2006), (d) sand-compost (this study), 359
(e) clay (CH) adapted from Jucá and Maciel (2006), and (f) landfill cover material adapted 360
from Marinho et al. (2001) 361
362
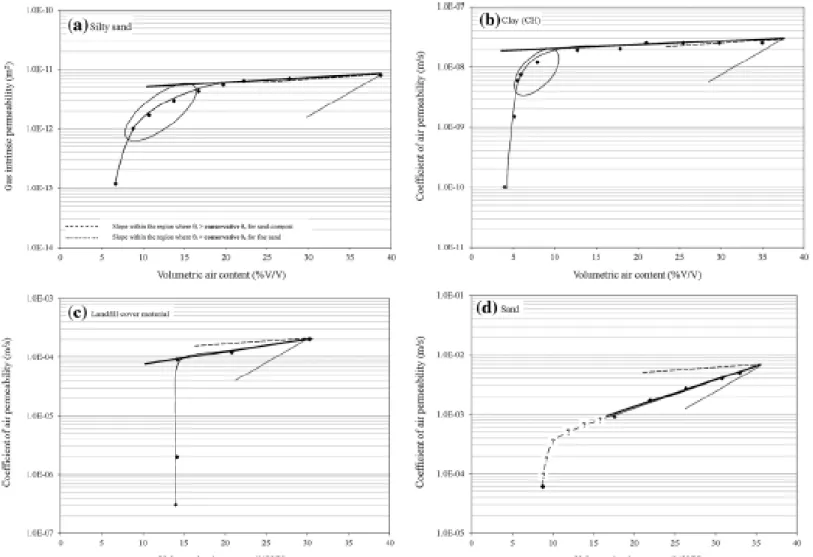
Fig. 8 ka-functions of materials from other studies, adapted from (a) Springer et al. (1998),
363
(b) Jucá and Maciel (2006), (c) Marinho et al. (2001), and (d) Kamiya et al. (2006) 364
17
Fig. 8 shows the ka-functions of the materials whose water retention curves were presented in
366
Fig. 7. In all figure, the curves were drawn based on the data published by the respective 367
authors. The specific gravity (Gs) was assumed equal to 2.67 for the cases where the actual
368
value was not available. A simple sensitivity analysis showed that varying Gs within a range
369
that is common for the soils in Fig. 8 (~2.62-2.74) did not affect the results presented and the 370
analyses thereof. For the silty sand in Fig. 8a (Springer et al. 1998), the ka-function is in the
371
form of gas intrinsic permeability versus volumetric air content, because it was not possible 372
to show it otherwise without making too many additional assumptions. The thick solid line 373
represents the slope of the corresponding ka-function for volumetric air content values greater
374
than the onset of the abrupt decrease in ka, as was considered in this study. The slope of
375
ka-functions of the fine sand (Fig. 4; for θa > θa-occ) and sand-compost mixture (Fig. 6; for θa
376
> conservative θa-occ) are represented by a dotted line and a dashed line, respectively.
377
In Fig. 8a and b, a transition zone is observed within the region with 8% < θa < 17% and
378
5% < θa < 12%, respectively (indicated by an ellipse). Therefore, the conservative θa-occ
379
would be equal to 12% for the clay and 17% for the silty sand. For the landfill cover, despite 380
the gradual desaturation in the vicinity of its air entry value (Fig. 7), a transition zone was not 381
identified in its ka-function (Fig. 8c). Based on the water retention curve of the sand tested by
382
Kamiya et al. (2006) (Fig. 7), one could expect a ka-function similar to that found for the fine
383
sand of this study, i.e. a ka-function without a transition zone. It is not clear whether there is a
384
transition zone in Fig. 8d, due to the lack of test results in the zone where 10% < θa < 20%.
385
The steepest slope of the curve, where volumetric air content is greater than that given by the 386
onset of the abrupt variations in ka with volumetric air content, is clearly associated with fine
387
sand, followed by the sand tested by Kamiya et al. (2006) (Fig. 8a), the landfill cover material 388
(Fig. 8c) and the sand-compost, the clay (Fig. 8b), and the silty sand (Fig. 8d). The latter 3 389
18
have very similar slopes. The clay sample studied by Jucá and Maciel (2006) seems to be an 390
atypical clay, as far as the slope of the desaturation zone of the water retention curve is 391
concerned. For this material, however, the variation of ka with volumetric air content is
392
minimal for θa > conservative θa-occ, therefore, the ka-function behaves as expected for a
393
clayey material. Despite the similarity between the slope of the desaturation zones in water 394
retention curves of sand-compost of this study and landfill cover material (Marinho et al. 395
2001), the slope of the ka-function is slightly steeper for the case of landfill cover material
396
(Marinho et al. 2001) than that associated with sand-compost. 397
Generally, these results seem to indicate that, with the exception of the landfill cover 398
material, the shape of the water retention curve in the vicinity of the air entry value (Fig. 7) 399
corresponds to the shape of the ka-function in the vicinity of the onset of abrupt decrease in ka
400
or within the region with conservative θa-occ < θa < θa-occ. Moreover, a steep slope of the
401
desaturation zone of the water retention curve is associated with a steep slope (thick solid 402
line) of the ka-function.
403 404
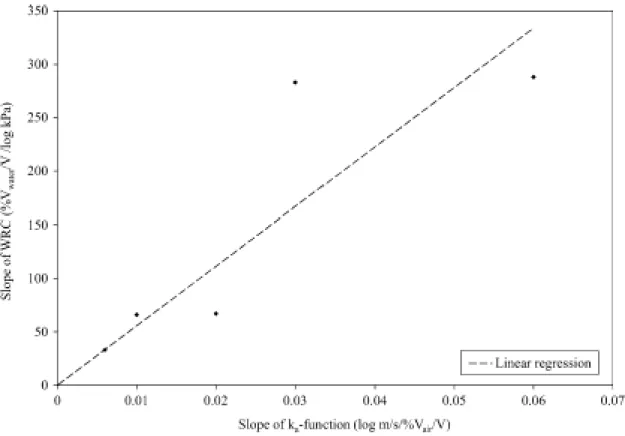
Fig. 9 Relationship between the slope of desaturation zones of WRCs and the slope of 405
ka-functions for θa > θa-occ or θa > conservative θa-occ, for materials from other studies and
406
this study 407
408
For all the materials presented in Fig. 7, except for the clay studied by Jucá and Maciel 409
(2006), calculations were made to determine the absolute value of the slope of the best fitting 410
line for the desaturation zones of the water retention curves and ka-functions, for volumetric
411
air content values greater than those at the onset of the abrupt decrease in ka value. The
412
results of these calculations, shown in Fig. 9, are quantitatively consistent with the 413
19
discussions about Fig. 7 and Fig. 8. Indeed, it is possible to observe a clear trend in the 414
relationship between the slopes of the ka-function and water retention curve: the greater the
415
slope of water retention curve, the greater the slope of ka-function.
416 417
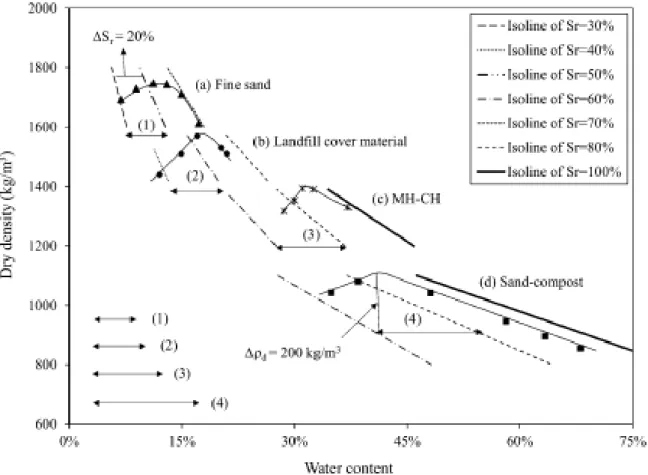
Fig. 10 Compaction curves of (a) fine sand (this study), (b) Landfill cover material adapted 418
from Marinho et al. (2001), (c) MH-CH adapted from Langfelder et al. (1968), and (d) 419
sand-compost (this study) 420
421
Fig. 10 presents the Standard Proctor curves of the materials tested in this and in other studies 422
found in the technical literature. For sake of comparison, the horizontal distances between 423
isolines of degree of water saturation 20% apart (represented by arrows in Fig. 10) were 424
measured for a dry density value 200 kg/m3 lower than the optimum dry density. This
425
arbitrary value was chosen so that the arrows are of identifiable enough dimensions in the 426
figure. The shortest distance is associated with the fine sand (this study), followed by the 427
landfill cover material (Marinho et al. 2001), the MH-CH (Langfelder et al. 1968) and 428
sand-compost (this study). 429
430
Fig. 11 The ka-function of the MH-CH material adapted from Langfelder et al. (1968),
431
accompanied by materials tested in this study 432
433
This same order above is observed when the slope of the ka-functions of the same materials
434
are compared. Indeed, as can be observed in Fig. 11, the steepest slope is associated with the 435
ka-function of the fine sand, followed by the MH-CH (Langfelder et al. 1968) and the
20
sand-compost. Based on this limited amount of data, it is tempting to state that the shorter the 437
distance between isolines of degree of water saturation, the steeper the slope of the 438
ka-function. However, as indicated in Fig. 11, the slope of the ka-function of the landfill cover
439
(Marinho et al. 2001) is slightly less steep than that of the MH-CH (Langfelder et al. 1968), 440
despite the fact that the distance between isolines of degree of water saturation is slightly 441
shorter for the landfill cover material. 442
It is well known that the slope of the desaturation zone of water retention curves of 443
fine-grained soils is less steep than in the case of coarse-grained soils, while compaction 444
curves of fine-grained materials spread over a wider range of water content values than the 445
compaction curves of coarse-grained materials. 446
Considering the above discussion, valuable information about gas flow behavior through 447
PMOBs can thus be extracted from examination of the shapes of the compaction curve, and 448
the water retention curve. In other words, critical design steps can be accomplished using 449
simple and easy-to-obtain data, such as compaction curves and water retention curve. 450
451
4.2 Relationships between degree of water saturation associated with occlusion value 452
and degree of water saturation at the line of optima and at air entry value 453
Results of air permeability tests obtained by Langfelder et al. (1968) with clay or silty 454
samples compacted dynamically (Standard Proctor and other), statically or by kneading, 455
show that close to the optimum water content, slight increases in water content cause several 456
orders of magnitude reduction in the ka value. Similar findings were obtained by Marinho et
457
al. (2001) and Jucá and Maciel (2006) who tested silty samples. According to Leroueil and 458
Hight (2013), the pores of soils compacted on the wet side of optimum are occluded, i.e. the 459
air-phase is in the form of discontinuous bubbles, whereas the air phase is continuous on the 460
21
dry side of optimum. All this seems to indicate that occlusion occurs near optimum water 461
content. This was also observed in the case of the sand-compost mixture, where the degree of 462
water saturation at the line of optima coincides with occlusion of air pores (see discussion in 463
section 3.2). For the fine sand, however, the degree of water saturation associated with 464
occlusion value is greater than that given by the line of optima (see section 3.1). 465
In addition, according to the ka-function (Fig. 6) and water retention curves (Fig. 5) of the
466
sand-compost mixture, the degree of water saturation associated with the air entry value 467
provided a reasonable estimate of degree of water saturation at pore occlusion. In the case of 468
fine sand, the degree of water saturation at air entry value (Fig. 3) would not be a good 469
indicator of occlusion, because the pores would be occluded at a degree of water saturation 470
lower than that associated with the air entry value (see section 3.1).The abrupt decrease of 471
coefficient of air permeability values with decreasing suction (therefore with increasing 472
degree of water saturation), for suction values lower than the air entry value, has been 473
reported in the literature (e.g. Fredlund et al. 2012). However, in certain cases, the abrupt 474
decrease in coefficient of air permeability that characterizes occlusion begins at a degree of 475
water saturation value lower than that associated with air entry value (Kamiya et al. 476
2006).This seems to indicate that further investigation is required in order to find a more 477
precise indicator of pore occlusion based on water retention curve. 478
479
4.3 Design Steps 480
The above discussion shows that easily available data (such as the Standard Proctor curve 481
and/or water retention curve) can be used to infer the shape of ka-function and, eventually the
482
degree of water saturation associated with θa-occ (or with conservative θa-occ). Ultimately, this
22
information can be used to obtain the design parameters required to determine the length of 484
unrestricted gas migration (LUGM). 485
For methane oxidation layers constituted of materials similar to the fine sand biogas can flow 486
unrestricted across the interface between gas distribution and methane oxidation layers, as 487
long as the volumetric air content remains greater than occlusion value. The latter is to be 488
obtained in the manner explained in the remainder of this section. LUGM would be the length 489
of the interface between the methane oxidation and gas distribution layers, taken horizontally, 490
along which θa is greater than θa-occ of methane oxidation layer material. In the case of
491
methane oxidation layers constructed with materials similar to the sand-compost mixture, gas 492
flow would be considered reasonably unrestricted beyond the point along the interface where 493
θa becomes lower than conservative θa-occ.
494
The occlusion or conservative occlusion values would be obtained as follows: 495
a) If the ka-function is available, the occlusion value is defined as the volumetric air
496
content at which the soap bubble inside the flowmeter is nearly immobile. It is arbitrary, but 497
it is nonetheless a practical definition. In cases where the conservative occlusion value can 498
be identified via the ka-function (e.g. sand-compost mixture; Fig. 6), using the conservative
499
occlusion value to define the occlusion and to calculate LUGM leads to a conservative 500
design. 501
b) In the absence of the ka-function, for methane oxidation layer materials that behave in
502
a manner similar to the fine sand, one can resort to the degree of water saturation 503
corresponding to the line of optima (of the Standard Proctor) to calculate the occlusion value 504
and LUGM. A certain level of conservatism is imbedded in this approach. 505
c) In the absence of the ka-function, for materials that behave in a similar manner to the
506
sand-compost mixture (i.e. air entry value not well defined), using the degree of water 507
23
saturation 10% to 20% lower than that corresponding to the line of optima, i.e. degree of 508
water saturation at optima minus 10% to 20%, would lead to volumetric air contents in the 509
vicinity of conservative θa-occ. This ensures at least viable biogas migration. LUGM would be
510
therefore defined based on conservative θa-occ.
511
This arbitrary selection in c above was verified based on the results presented by Maciel and 512
Jucá (2000) on sandy clay samples, for which the difference between the degree of water 513
saturation at the start and end of what has been defined herein as the transition zone, i.e. 514
conservative θa-occ > θa > θa-occ (see for example, Fig. 6) was approximately 20%. Likewise,
515
Springer et al. (1998) and Ba-Te et al. (2005) reported nearly 14% and 13% changes in 516
volumetric water content within the transition zone for a silty sand and for Japanese fine 517
soils, respectively. Here again, more refined design procedures will eventually be developed 518
with further studies concerned with the hydraulic behaviour of PMOBs. 519
520
4.4 Further design considerations 521
As discussed in section 4.1, the slope of ka-functions where θa > θa-occ (fine sand) or θa >
522
conservative θa-occ (sand-compost) corresponds to the slope of the desaturation zone in the
523
water retention curves. It is therefore possible to use the slope of the desaturation zone of the 524
water retention curve - or the slope of ka-function where θa is greater than occlusion or
525
conservative occlusion value - to help in the selection of the methane oxidation layer 526
material. Shallower slopes of the curves lead to greater uniformity of volumetric air content 527
and degree of water saturation along the interface between methane oxidation and gas 528
distribution layers. This greater uniformity leads more efficient biogas distribution at the base 529
of the methane oxidation layer. 530
24 5 Conclusions
532
In this study a key criterion for designing passive methane oxidation biosystems, 533
denominated length of unrestricted gas migration (LUGM) was defined, and steps to obtain 534
the parameters needed to determine it, were presented. These parameters, i.e. θa and
535
conservative θa-occ, were defined as the threshold of unrestricted upward flow of biogas. The
536
flow of biogas was considered reasonably unrestricted when: 1) θa > θa-occ for methane
537
oxidation layer materials similar to the fine sand tested in this study, and 2) when θa >
538
conservative θa-occ for methane oxidation layer materials similar to the sand-compost
539
mixture. 540
Similarities were found between the shapes of air permeability function around θa-occ (and/or
541
conservative θa-occ) and water retention curve around the air entry value, as well as between
542
the width over which the Standard Proctor curve spans and the slope of air permeability 543
function and water retention curve. It was also shown that in the absence of air permeability 544
function, one can resort to the degree of water saturation at the line of optima or degree of 545
water saturation at air entry value to obtain the value of θa-occ and/or conservative θa-occ. The
546
methodology presented to obtain θa-occ and conservative θa-occ helps in the selection of the
547
appropriate material for methane oxidation leyer. One that would provide the longest possible 548
LUGM, therefore the lowest risk of hotspot creation. 549
550
References 551
Ahoughalandari, B., and Cabral, A.R. 2016. Influence of capillary barrier effect on biogas 552
distribution at the base of passive methane oxidation biosystems: Parametric study. doi: 553
10.1016/j.wasman.2016.11.026. 554
25
Ait-Benichou, S., Jugnia, L.-B., Greer, C.W., and Cabral, A.R. 2009. Methanotrophs and 555
Methanotrophic Activity in Engineered Landfill Biocovers. Waste Management 29(9): 2509-556
2517. 557
ASTM-D698. 2012. Standard Test Methods for Laboratory Compaction Characteristics of Soil 558
Using Standard Effort (12,400 ft-lbf/ft3 (600 kN-m/m3)). ASTM International, West 559
Conshohocken, PA. 560
Ba-Te, Zhang, L., and Fredlund, D. 2005. A General Air-phase Permeability Function for 561
Airflow through Unsaturated Soils. In Slopes and Retaining Structures Under Seismic and 562
Static Conditions. pp. 1-15. 563
Ball, B.C., O’Sullivan, M.F., and Hunter, R. 1988. Gas Diffusion, Fluid Flow and Derived Pore 564
Continuity Indices in Relation to Vehicle Traffic and Tillage. Journal of Soil Science 39: 327-565
339. 566
Berger, J., Fornés, L.V., Ott, C., Jager, J., Wawra, B., and Zanke, U. 2005. Methane Oxidation 567
in a Landfill Cover with Capillary Barrier. Waste Management 25: 369-373. 568
Blackwell, P.S., Ringrose-Voase, A.J., Jayawardane, N.S., Olssons, K.A., Mckenzie, D.C., and 569
Mason, W.K. 1990. The Use of Air-filled Porosity and Intrinsic Permeability to Air to 570
Characterize Structure of Macropore Space and Saturated Hydraulic Conductivity of Clay 571
Soils. Journal of Soil Science 41: 215-228. 572
Bohn, S., and Jager, J. 2011. Low Gas Emissions of Mechanically and Biologically Treated 573
Waste and Microbial Methane Oxidation as an Adapted Method for Mitigation of Emissions. 574
In XIII International Waste Management and Landfill Symposium CISA Publisher S. 575
Margherita di Pula, Italy. 576
Bussière, B., Aubertin, M., and Chapuis, R.P. 2003. The Behavior of Inclined Covers Used as 577
Oxygen Barriers. Canadian Geotechnical Journal 40: 512-535. 578
26
Cabral, A., Racine, I., Burnotte, F., and Lefebvre, G. 2000. Diffusion of Oxygen through a Pulp 579
and Paper Residue Barrier. Canadian Geotechnical Journal 37: 201-217. 580
Cabral, A.R., Létourneau, M., Yanful, E., Song, Q., McCartney, J.S., and Parks, J. 2010a. 581
Geotechnical Issues in the Design and Construction of PMOBs. In UNSAT 2010, Barcelona. 582
pp. 1361-1367. 583
Cabral, A.R., Moreina, J.F.V., and Jungia, L.B. 2010b. Biocover Performance of Landfill 584
Methane Oxidation: Experimental Results. Journal of Environmental Engineering 136: 785-585
793. 586
Capanema, M.A., and Cabral, A.R. 2012. Evaluating Methane Oxidation Efficiencies in 587
Experimental Landfill Biocovers by Mass Balance and Carbon Stable Isotopes. Water Air Soil 588
Pollut 223(9): 5623-5635. 589
Cassini, F., Scheutz, C., Skov, B.H., Mou, Z., and Kjeldsen, P. 2017. Mitigation of methane 590
emissions in a pilot-scale biocover system at the AV Miljø Landfill, Denmark: 1. System 591
design and gas distribution. Waste Management. doi:
592
http://dx.doi.org/10.1016/j.wasman.2017.01.013. 593
Chi, Z.F., Lu, W.J., Li, H., and Wang, H.T. 2012. Dynamics of CH4 Oxidation in Landfill
594
Biocover Soil: Effect of O2/CH4 Ratio on CH4 Metabolism. Environmental Pollution 170:
8-595 14. 596
Einola, J.-K.M., Kettunen, R.H., and Rintala, J.A. 2007. Responses of Methane Oxidation to 597
Temperature and Water Content in Cover Soil of a Boreal Landfill. Soil Biology & 598
Biochemistry 39: 1156-1164. 599
Fredenslund, A.M., Scheutz, C., and Kjeldsen, P. 2010. Tracer Method to Measure Landfill 600
Gas Emissions from Leachate Collection Systems. Waste Management 30: 2146–2152. 601
Fredlund, D.G., and Rahardjo, H. 1993. Soil Mechanics for Unsaturated Soils. John Wiley & 602
Sons, Inc. 603
27
Fredlund, D.G., Rahardjo, H., and Fredlund, M.D. 2012. Unsaturated Soil Mechanics in 604
Engineering Practice. John Wiley & Sons, Inc., Hoboken, NJ, USA. pp. 9. 605
Gebert, J., Groengroeft, A., and Pfeiffer, E.M. 2011. Relevance of Soil Physical Properties for 606
the Microbial Oxidation of Methane in Landfill Covers. Soil Biol Biochem 43: 1759-1767. 607
He, R., Wang, J., Xia, F., Mao, L., and Shen, D. 2012. Evaluation of Methane Oxidation 608
Activity in Waste Biocover Soil During Landfill Stabilization. Chemosphere 89: 672-679. 609
Huber-Humer, M., Röder, S., and Lechner, P. 2009. Approaches to Assess Biocover 610
Performance on Landfills. Waste Management 29: 2092-2104. 611
Jucá, J., and Maciel, F. 2006. Gas Permeability of a Compacted Soil Used in a Landfill Cover 612
Layer. In Fourth International Conference on Unsaturated Soils. Edited by G.A. Miller and 613
C.E. Zapata and S.L. Houston and D.G. Fredlund. American Society of Civil Engineers, 614
Carefree, Arizona, United States. pp. 1535-1546. 615
Kamiya, K., Bakrie, R., and Honjo, Y. 2006. A New Method for the Measurement of Air 616
Permeability Coefficient of Unsaturated Soil. In Fourth International Conference on 617
Unsaturated Soils. Edited by G.A. Miller and C.E. Zapata and S.L. Houston and D.G. Fredlund. 618
American Society of Civil Engineers, Carefree, Arizona, United States. pp. 1741-1752. 619
Langfelder, L.J., Chen, C.F., and Justice, J.A. 1968. Air Permeability of Compacted Cohesive 620
Soils. Journal of the Soil Mechanics and Foundations Division 94(4): 981-1002. 621
Leroueil, S., and Hight, D.W. 2013. Compacted Soils: From Physics to Hydraulic and 622
Mechanical Behaviour. In First Pan-American Conference on Unsaturated Soils. Edited by 623
C.M. Bernardo Caicedo, Laureano Hoyos, Julio Esteban Colmenares, Ivan Rafael Berdugo, 624
Cartagena, Colombia. pp. 41-59. 625
Lu, N., and Likos, W.J. 2004. Unsaturated Soil Mechanics. John Wiley & Sons, Inc. pp. 556. 626
28
Maciel, F., and Jucá, J. 2000. Laboratory and Field Tests for Studying Gas Flow Through MSW 627
Landfill Cover. In Geo-Denver. Edited by C.D. Shackelford and S.L. Houston and N.Y. Chang. 628
American Society of Civil Engineers, Denver, Colorado, United States. pp. 569-585. 629
Maqsoud, A., Bussière, B., Aubertin, M., Chouteau, M., and Mbonimpa, M. 2011. Field 630
Investigation of a Suction Break Designed to Control Slope-Induced Desaturation in an 631
Oxygen Barrier. Canadian Geotechnical Journal 48: 53-71. 632
Marinho, F.A.M., Andrade, M.C.J., and Jucá, J.F.T. 2001. Air and Water Permeability of a 633
Compacted Soil Used in a Solid Waste Landfill in Recife, Brazil. In the Third BGA 634
Geoenvironmental Engineering Conference. Thomas Telford Publishing, Thomas Telford Ltd., 635
Edinburg, Scotland. pp. 437-442. 636
Mbonimpa, M., Aubertin, M., Aachib, M., and Bussière, B. 2003. Diffusion and Consumption 637
of Oxygen in Unsaturated Cover Materials. Canadian Geotechnical Journal 40: 916-932. 638
Ndanga, É.M., Bradley, R.L., and Cabral, A.R. 2015. Does Vegetation Affect the Methane 639
Oxidation Efficiency of Passive Biosystems? Waste Management 38: 240-249. 640
Roncato, C.D.L., and Cabral, A.R. 2012. Evaluation of Methane Oxidation Efficiency of Two 641
Biocovers: Field and Laboratory Results. Journal of Environmental Engineering 138(2): 164-642
173. 643
Röwer, I.U., Gebert, J., Streese-Kleeberg, J., Kleinschmidt, V., Melchior, S., Scharff, H., and 644
Pfeiffer, E.-M. 2012. Heterogeneous Emission from a Biocover Designed for Methane 645
Oxidation. In 7th Intercontinental Landfill Research Symposium (ICLRS). Poster presentation,
646
Luleä, Sweden. 647
Scheutz, C., Fredenslund, A.M., Chanton, J., Pedersen, G.B., and Kjeldsen, P. 2011. Mitigation 648
of Methane Emission from Fakse Landfill Using a Biowindow System. Waste Management 649
31: 1018-1028. 650
29
Scheutz, C., Kjeldsen, P., Bogner, J.E., De Visscher, A., Gebert, J., Hilger, H.A., Huber-651
Humer, M., and Spokas, K. 2009. Microbial Methane Oxidation Processes and Technologies 652
for Mitigation of Landfill Gas Emissions. Waste Management and Research 27(5): 409-455. 653
Springer, D.S., Loaiciga, H.A., Cullen, S.J., and Everett, L.G. 1998. Air Permeability of Porous 654
Materials Under Controlled Laboratory Conditions. Groundwater 36(4): 558-565. doi: 655
10.1111/j.1745-6584.1998.tb02829.x. 656
Tang, A.M., Cui, Y.-J., Richard, G., and Défossez, P. 2011. A Study on the Air Permeability 657
as Affected by Compression of Three French Soils. Geoderma 162: 171-181. 658
Tate, K.R. 2015. Soil Methane Oxidation and Land-Use Change - from Process to Mitigation. 659
Soil Biology & Biochemistry 80: 260-272. 660
Tétreault, P., Cabral, A.R., and Abdolahzadeh, A.M. 2013. Non-Uniform Distribution of 661
Biogas under a Biocover due to Capillary Barrier Effect: Case Studies. In GEOMontreal, 662
Montreal, Canada. 663
UMS. 2013. HYPROP-UMS User's Manual. In Art. no. HYPROP Version 02. UMS GmbH 664
München. 665
Vaughan, P.R. 2003. Observations on the Behaviour of Clay Fill Containing Occluded Air 666
Bubbles. Géotechnique 53(2): 265-272. 667
Wind, G.P. 1968. Capillary Conductivity Data Estimated by a Simple Method. In R.E. Rijtema 668
and H. Wassink (ed.) Water in the Unsaturated Zone: Proc. UNESCO/IASH Symp., 669
Wageningen, the Netherlands. pp. 181-191. 670
Yanful, E.K. 1993. Oxygen Diffusion through Soil Covers on Sulphidic Mine Tailings. Journal 671
of Geotechnical Engineering 119(8): 1207-1228. 672
30
31
32
Fig. 3 Water retention curves of fine sand samples at two initial water content values (one dry and the other wet of the line of optima) and three different values of initial dry density; (a) 1750 kg/m3, (b) 1650 kg/m3 and (c) 1550 kg/m3
33
Fig. 4 Variations in the coefficient of air permeability of fine sand with volumetric air content (θa), at several values of differential pressure
34
Fig. 5 Water retention curves of sand-compost mixture samples at two initial water content values (dry and wet of optima) and at: (a) Standard Proctor dry densities (about 1000 kg/m3),
35
Fig. 6 Variations in coefficient of air permeability of sand-compost mixture with volumetric air content at several differential pressure values
36
Fig. 7 Water retention curves of (a) silty sand adapted from Springer et al. (1998), (b) fine sand (this study), (c) sand adapted from Kamiya et al. (2006), (d) sand compost (this study), (e) clay (CH) adapted from Jucá and Maciel (2006), and (f) landfill cover material adapted from Marinho et al. (2001)
37
Fig. 8 ka functions of materials from other studies, adapted from (a) Springer et al. (1998), (b) Jucá and Maciel (2006), (c) Marinho et al. (2001),
38
Fig. 9 Relationship between the slope of desaturation zones of WRCs and the slope of ka-functions for θa > θa-occ or θa > conservative θa-occ, for materials from other studies and
39
Fig. 10 Compaction curves of (a) fine sand (this study), (b) Landfill cover material adapted from Marinho et al. (2001), (c) MH CH adapted from Langfelder et al. (1968), and (d) sand compost (this study)
40
Fig. 11 The ka function of the MH-CH material adapted from Langfelder et al. (1968),