HAL Id: hal-01611984
https://hal.archives-ouvertes.fr/hal-01611984
Submitted on 30 Mar 2018
HAL is a multi-disciplinary open access
archive for the deposit and dissemination of
sci-entific research documents, whether they are
pub-lished or not. The documents may come from
teaching and research institutions in France or
abroad, or from public or private research centers.
L’archive ouverte pluridisciplinaire HAL, est
destinée au dépôt et à la diffusion de documents
scientifiques de niveau recherche, publiés ou non,
émanant des établissements d’enseignement et de
recherche français ou étrangers, des laboratoires
publics ou privés.
Radiative pyrolysis of wet wood under intermediate heat
flux: Experiments and modelling
Victor Pozzobon, Sylvain Salvador, Jean-Jacques Bézian, Mouna El-Hafi,
Yannick Le Maoult, Gilles Flamant
To cite this version:
Victor Pozzobon, Sylvain Salvador, Jean-Jacques Bézian, Mouna El-Hafi, Yannick Le Maoult, et
al.. Radiative pyrolysis of wet wood under intermediate heat flux: Experiments and modelling. Fuel
Processing Technology, Elsevier, 2014, 128, pp.319-330. �10.1016/j.fuproc.2014.07.007�. �hal-01611984�
Radiative pyrolysis of wet wood under intermediate heat flux:
Experiments and modelling
Victor Pozzobon
a,⁎
, Sylvain Salvador
a, Jean Jacques Bézian
a, Mouna El-Hafi
a,
Yannick Le Maoult
b, Gilles Flamant
caUniversité de Toulouse, Mines Albi, centre RAPSODEE, UMR CNRS 5302, Campus Jarlard, route de Teillet, 81013 Albi CT Cedex 09, France bUniversité de Toulouse, Mines Albi, ICA (Institut Clément Ader), Campus Jarlard, route de Teillet, 81013 Albi CT Cedex 09, France cProcesses, Materials and Solar Energy laboratory, PROMES-CNRS, 7, rue du Four solaire, 66120 Odeillo-Font Romeu, France
a b s t r a c t
Keywords: Biomass Pyrolysis Radiative Thermally thick Steam gasification Experiment ModellingAn experimental study of thermally thick biomass (beech wood spheres) pyrolysis under high radiative heat flux was performed. The influence of sample diameter (5–20 mm), incident heat flux (60–180 kW/m2) and initial
moisture content (1–50 wt%) was studied. Char yields and temperature histories were monitored. Initial moisture content impact was highlighted. Indeed, steam coming from the sample core drying can gasify the external char layer, reducing therefore the char yield and increasing syngas production. This study was supported by a 2D unsteady numerical model of biomass degradation (mass, momentum and heat conservation coupled with Broido-Shafizadeh reaction scheme). This model gave more insight about phenomena occurring inside the degrading sample. It revealed that a pyrolysis front follows up a drying one. Therefore, steam is forced out of the sample through a high temperature char layer, making char steam gasification chemically possible.
1. Introduction
With the increase in energy cost, mankind is looking for new and re-newable energy sources. Among the different alternatives, biomass and solar energy emerge. Biomass is the fourth wider energy source avail-able, after coal, oil and natural gas[1]. It can be used to produce heat via combustion, methane via methanation or syngas via gasification. Furthermore, biomass is a renewable source of energy and its use has a near zero green house effect. There also are several ways of producing power thanks to solar energy. Without a concentration step, electricity is produced using photovoltaic modules. With a concentration step, extremely high temperatures are reached and thermally activated chemical reactions can be led, such as water cracking[2].
The combination of these two energy sources seems promising, more specifically, the combination of lignocellulosic biomass gasifica-tion and concentrated solar energy. Indeed, liquid fuel can be produced using syngas coming from biomass gasification. This syngas is produced at around 800 °C by gasifying char produced during biomass pyrolysis. Biomass transformation into syngas is currently performed in autothermal reactors. The needed heat for this endothermal process is
classically produced by burning a fraction of biomass which results in a decrease of the conversion efficiency to syngas. Gasification tempera-ture are reachable using concentrated solar energy. Thus, gasification process can be powered thanks to solar energy.
Two major advantages come from this combination: syngas is free of combustion fumes and therefore not diluted by nitrogen and carbon dioxide. The produced fuel can be used on demand and therefore solar energy captured during the day is available at any time. Other advantages can be listed: syngas yield is higher than classical processes with respect to the inlet biomass (the currently burnt biomass would be gasified). The produced gas may be processed to obtain liquid fuel that is highly useful in transport applications.
The pyrolysis step which predates gasification or combustion, is im-portant to understand, because the main products yields (gas, tar and char) dramatically depend on the pyrolysis condition. A high biomass heating rate will favor tar over char, as to a high final temperature will do the opposite. Char yield is a key feature to design a gasification process. It dictates the required quantity of heat and oxidating agent to convert the biomass. The influence of pyrolysis conditions can be very subtle. Depending on its history, the produced char exhibits different chemical composition[1], chemical reactivity[3]or physical shape (porosity, mechanical failure, …).
The number of studies on lignocellulosic biomass solar gasification increases. But, it remains low. First, image furnaces (either lamp or
⁎ Corresponding author.
solar) have only been seen as a way to achieve very high heating rates through high radiative heat flux, e.g. 800 kW/m2[4–7]. Nowadays, radi-ation is considered as a heat source by itself. The potential of several solar receivers for lignocellulosic biomass gasification has been assessed
[8]. Fluidized beds seem to be a promising technology[9,10], but, small and similar particles are required[11,12]. Consequently, this process needs a well controlled grinding step. Dense packed bed reactors allow the use of larger biomass feedstock. In the case of fixed bed solar receiver, ash may turn out to be a real problem. Indeed they may form a radiative shield because of their high emissivity[10]. Cyclonic
[13]and tubular[14]reactors as well as rotating kilns[15]have also been tested. In order to design such reactors on a large scale, there is a need for characterizing single piece biomass behavior under high radiative power.
This paper presents an experimental and a numerical approach of thermally thick beech wood samples pyrolysis under radiant power. The influence of key parameters has been investigated. Beech samples, with diameters from 5 to 20 mm, have been exposed to mean incident heat flux ranging from 60 to 180 kW/m2. Initial moisture content, ranging from 1 to 50 wt%, is demonstrated to have a major impact on sample temperature history and char yield. Thanks to sample final mass measurement and core temperature monitoring, char yield, drying, pyrolysis and heating times have been calculated.
Nomenclature Latin symbols A tensors
a ellipse semi-major axis, m b ellipse semi-minor axis, m Cp specific heat capacity, J/kg/K D mass diffusion tensor, m2/s ^
dp mean pore radius, m
d sample diameter, m Ea activation energy, J/mol
f(β) heat flux distribution around a sample, W/m2 h convection heat transfer coefficient, W/m2/K k frequency factors, s-1
n
! normal vector,− K permeability, m2 P pressure, Pa
Q heat source term, W/m3 R ideal gas constant, J/mol/K S surface, m2
V volume, m3 T temperature, K t time, s
u
! intrinsic velocity vector, m/s x ! position vector, m Y mass faction,− Greek symbols α absorptivity,− β angle, rad ∆h reaction heat, J/kg ∆P typical pressure drop, Pa ∆T typical temperature difference, K
ϵ emissivity,−
λ thermal conductivity tensor, W/m/K μ dynamic viscosity, Pa.s
ξ porosity,− ρ apparent density, kg/m3 σ Stefan-Boltzmann constant, W/m2/K4 ϕ heat flux, W/m2 ω reaction term, kg/m3/s Subscripts c char eff effective g gas phase
i,j accounting for the different species (wood, char, liquid water, steam, tar, gas)
lw liquid water nit nitrogen p pore s solid phase sur surrounding w wood 2. Experimental
An image furnace was used to submit spherical wood samples with different diameters and different initial moisture contents to high adiative heat flux[5,16].Two parameters were monitored: the final char mass and the core temperature history.
2.1. Experimental device
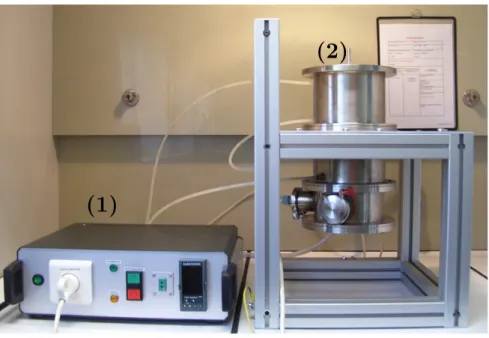
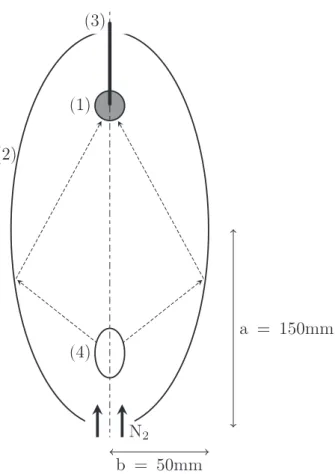
The used image furnace (Figs. A.1 and A.2) was first developed to study solids radiative properties at high temperature[17]. This furnace consists of an elliptical mirror (a = 150 mm, b = 50 mm) which directs every ray coming from the 750 W tungsten lamp at first focus to the sample at second focus. The heat flux on the sample surface is theoret-ically not uniform because the elliptical reflector is a non imaging optical device. This device allows to reach average heat flux as high as 180 kW/m2on 5 mm diameter samples. Wood samples can reach 1000 K at the center with a 25 K/s heating rate.
Samples are placed so that the wood fiber direction are parallel to the ellipse semi-major axis. They are held by a 1 mm diameter K type thermocouple which monitors the sample core temperature. Lamp power can be adjusted to achieve heat flux ranging from 60 to 180 kW/m2. The mirror walls are water cooled in order to control boundary conditions. A 400 ml/mn nitrogen sweep is used to ensure that the sample atmosphere is inert and to prevent tars from soiling the mirror.
2.2. Calibration
Thermally thin (Biot number of the steel sphere = 0.046) stainless steel spheres with a diameter of 5, 10 and 20 mm, were used to lead a calibration campaign. Thermal balance may be written as in Eq.(1)for a small Biot number body. Once steady state is reached, assuming that heat transfer is mainly radiative, equilibrium temperature can be linked to the mean incident heat flux as written in Eq.(2).
ρVCpdTdt ¼αϕS−ϵσS T4−T4sur ! " −hS T−Tð nitÞ ð1Þ ϵσS T4−T4 sur ! " ¼ α ϕ S ð2Þ
In all radiative problem, emissivity and absorptivity are of great influence on the thermal behavior of the bodies. Oxidized stainless steel emissivity is 0.8 and does not vary much with temperature[18]. Its absorptivity was measured using an integrating sphere from 530 nm to 25 μm mounted on a Bruker Vertex FTIR spectrometer; it is 0.80. The lamp spectrum was established in from former work[19]. It is distributed equally among the near infrared and the visible range. Beech wood and char reflectivities were also measured (Fig. A.3) and their absorptivities with respect to the lamp spectrum were calculated.
Beech wood absorptivity is 0.37 and char absorptivity is 0.88. Both measurements are in good agreement with reported values[20–23]. 2.3. Sample characterization
A pack of beech wood spheres calibrated 10 and 20 mm diameter was purchased. Due to the impossibility to manufacture 5 mm diameter beech sphere, cylinders (height 5 mm, diameter 5 mm) were used instead (Fig. A.5).The wood spheres mass distribution and moisture were charac-terized. The mean density of the pack of sphere was 701 (±59) kg/m3. The initial wood moisture content was 9 wt%. It was modified in two ways. To reach 50 wt% moisture (close to the one when the wood is har-vested) some of the spheres were immersed for 6 weeks in demineralizated water. To reach almost zero moisture several spheres were dried out for 24 hours at 105 °C in a drying apparatus. Both batches were followed and mass was monitored until it reached a steady value. 2.4. Experimental procedure
The following procedure was strictly followed for every run: • the virgin sample was drilled along wood fibers
• the virgin sample was weighted
• the lamp power was pre-tuned to set the desired incident heat flux, the sample was placed in the furnace, nitrogen flow rate was set • oxygen was purged
• temperature monitoring and lamp power were turned on
• once the core temperature stabilized, power and temperature recording were turned off
• once the core temperature settled below 40 °C, the sample was taken out of the furnace
• the pyrolyzed sample was weighted and stored • the furnace was cooled down and cleaned
Every measurement point was repeated at least three times. 2.5. Experimental results
Good repeatability can be achieved with this experimental set up as illustrated inFig. A.4.
This campaign has also shown that the sample position has to be accurately set. The nitrogen sweep flow rate has almost no impact on sample heating rate, which support the assumption of mainly radiative heat transfer occurs.
Let us also note that the sample geometry changes during a run. The charred sample is smaller than the initial wood one and has an oval shape (Fig. A.5). Its mean diameter is 74% of the initial diameter; its volume is 40% of the initial one. These proportions are commonly found in literature[24].
2.5.1. Temperature histories
Fig. A.6reports the core temperature histories. They exhibit different shapes depending on the initial moisture content. The main difference can be observed during the drying phase. Dried samples logically show no sign of deviation in the core temperature curve from 20 to 200 °C. An inflection can be found in core temperature profiles of the 9 wt% initial moisture content samples. It is due to the endothermicity of the drying process. However, there is not enough water to vaporize to create a tem-perature plateau. A still more pronounced plateau is found for the 50 wt% initial moisture content samples. The time required to heat and dry the 50 H2Owt% samples is 4 times higher than the one to dry 9 H2Owt% samples. This may have a strong impact on a large scale process.
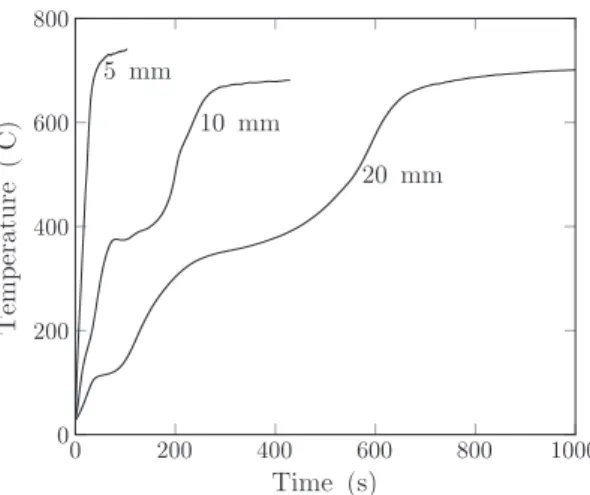
Around 400 °C, temperature histories exhibit another variation (Fig. A.7). These variations range from a temperature profile inflection point for 5 mm sample to a temperature plateau for 10 and 20 mm sam-ples. These behaviors are due to the pyrolysis endothermic reactions. At the end of the run, temperature histories also reach the same final core
temperature. This may be explained by the fact that the final tempera-ture only depends on the incident heat flux, the sample size and not on the initial moisture content.
2.5.2. Final char yields analysis
The final char mass is the resulting sample mass minus ash. It is commonly divided by the initial wood mass to derive the char yield which is an important data for process design.
Final char yield analysis reveals an interesting behavior. First as one can see inFig. A.8, the larger the sphere size, the more char is produced. This results from the fact that larger sample diameter results in a lower heating rate. The char yield of a 20 mm diameter sample is twice that of a 5 mm sample. It may have an impact on large scale process feed preparation. The difference between heating rate also explains the fact that for a given sample diameter, the higher the incident heat flux, the less char is produced, as reported inFig. A.9. This trend is in agreement with standard literature: a high heating rate leads to a small char yield. One can note that the highest char yield is surprisingly obtained for the intermediate 9 wt% initial moisture content (Fig. A.10): 1 wt% mois-ture sample exhibits lower char residues and 50 wt% moismois-ture samples produce even less char residues.
The 1 wt% moisture behavior may be explained by the fact that there is no drying plateau (Fig. A.6), so, compared to the 9 wt% sample, the sample heating rate is not lowered by the drying stage. Therefore, less char is produced. In order to explain the 50 wt% initial moisture content sample lower char yield, another mechanism can be suggested: steam gasification. The steam produced by drying would outflow through a high temperature char matrix close to the particule surface and gasify part of the char. To our knowledge, such a situation of direct char gasi-fication by steam from drying inside a particule has not been reported in the literature before. Despite the inert atmosphere, not only pyrolysis would occur but coupled pyrolysis and steam gasification. Furthermore, a simple calculation shows that a 50 wt% moisture sample contains more than enough water to gasify the produced char.
2.5.3. Drying, pyrolysis and heating times
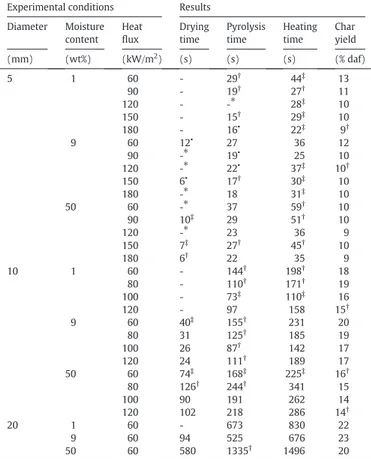
All of the results from the experimental campaign are recapitulated in
Table A.1. One can find the char yield for every tested configuration. Whenever it was possible, we also provide the total drying, pyrolysis and heating times as defined in (Fig. A.4); time evaluation method is available inAppendix A. Drying time is defined as the time required for the whole sample to dry. Pyrolysis time is defined as the time required for the core temperature to increase over the pyrolysis plateau tempera-ture. One can still observe temperature inflections after the pyrolysis plateau (Fig. A.4). These variations are attributed to the exothermic decomposition of lignin[25]. We have decided not to take them into ac-count when evaluating the pyrolysis time because these variations have not been always observed. Heating time is defined as the time required for the sample core to reach its maximum temperature.Table A.1also provides an indication of the data dispersion, defined as the ratio stan-dard deviation/mean value. Data dispersion above 10% are notified. One can see that char yield is the most reliable result. Drying, pyrolysis and heating times are less reliable. The total heating time decreases with an increase of the incident heat flux. Even if expected tendencies are found, discrepancies are observed. The differences may come from several factors: sample positioning accuracy, thermocouple positioning inside the sample, sample mechanical failure. Mechanical failure during the sample heating phase (observed, but not reported here) allows radiative heat flux to penetrate inside of the sample.
3. Numerical model
A numerical model was developed in order to get more insight about radiative pyrolysis. This model includes heat and momentum balance, drying and pyrolysis chemical reactions. Steam gasification was not implemented. Solving the model equations seemed barely feasible
analytically, so a numerical approach was chosen. All the following work was realized using the open source equation solver OpenFOAM. 3.1. Preliminary study
Some key dimensionless numbers were calculated in order to assess assumptions validity. The use of dimensionless numbers is not common in this field of research, only few authors mentioned it[4,26,27]. The required properties values are either measured or taken from the literature (Table A.2).
Bi ¼λΔT ¼ϕd 4:9 Re ¼ρg!^duμ p¼ 4:6 10−2 Pe ¼ξρgCpλg^dp!u g ¼ 0:18 π ¼ρ ϕ lwdkdryingΔhdrying¼ 2:9 10 −2
These dimensionless numbers are used to assess the validity of key assumptions. Hence, they have been calculated in the most unfavorable cases. Biot number was assessed for wood in the longitudinal direction. The velocity used to calculate pore Reynolds and Péclet numbers is based on Darcy’s law using the highest gas overpressure reported in the literature (Table A.2).
From Biot number value, one can expect strong temperature gradi-ent inside the sample. Reynolds number value validates the use of Darcy’s law to model the flow inside the porous sample. Péclet number shows that local thermal equilibrium assumption is valid. Therefore, a unique temperature can be used to describe the problem[28]. Finally π and Biot numbers show that between heat transfer and chemical kinetic, heat transfer should be the limiting step. Thus one can expect reaction fronts to appear during the process.
3.2. Physical properties values and pyrolysis reaction scheme
Being anisotropic materials, wood and char properties values should be specified in the three directions. There is no major difference between radial and azimuthal wood properties[29]. Medium radial prop-erties were determined by dividing longitudinal propprop-erties by a scalar factor: λradial= λlongitudinal/1.9[30]and Kradial= Klongitudinal/9970[29].
Due to the large range of temperature across the sample, physical properties values should vary with temperature. It is the case for intrin-sic heat capacity and thermal conductivity of both wood and char. One should note that wood and char are insulating material. Their thermal conductivities dramatically increase with the temperature due to inter-nal radiation inside of the porous structure[31]. Both wood and char thermal conductivities increase with respect to the temperature. This increase accounts for radiation contribution.
The following correlations were used to describe wood thermal conductivity and specific heat capacity:
Cpw(T) = 2300− 1150exp(−0.0055 T), 20 b T(°C) b 240[32]. λw,longitudinal(T) = 0.291 + 0.000836 × 0.33 T, 20 b T(°C) b 500[33]. The following correlations were set to describe char thermal conduc-tivity and specific heat capacity:
Cpc(T) = 1430 + 0.355 T− 7.3210 107T−2, 40 b T(°C) b 700[34]. λc,longitudinal(T) = 2.3584− 1.4962 10−2T+ 3.8483 10−5T2− 4.3292 10−8T3+ 1.8595 10−11T4, 20 b T(°C) b 600[30].
Effective thermal conductivities are calculated following Gauthier recommendations[30], using Saastamoinen and Richard model: λeff¼ 1−ξ2=3 ! " λsþ ξ 2=3 1−ξ1=3 2λs þ ξ1=3 λg
Physical properties were either calculated or taken from literature (Table A.2).
Gas phase being a complex mixture, model molecules were used to describe it. Carbon monoxide was taken as model molecule for gas and benzene for tar. Gas phases physical properties evolution versus temperature were taken from the literature[35–42]. These properties evolutions versus temperature are described using high order polynomial expression (Janaf). The authors have checked that even out of their validity range, these expressions provide reasonable values with an increasing trends with temperature.
Depending on the degree of thermal degradation, one can find wood and/or char at a given point of the computational domain. Solid matrix physical properties are assumed to be the weighted average between wood and char properties. For example:
Ks¼ρw
Kwþ ρcKc
ρwþ ρc ð3Þ
Biomass pyrolysis is a complex thermochemical process involving more than 300 molecules[43]. The products yields depend on many fac-tors such as temperature, heating rate, pressure. Three main kinds of model exist; each consider biomass from a different point of view. The simplest models consider lumped species. These models can predict char, tar and gas yields, but not individual chemical molecule produc-tion. Other models consider the biomass as a mixture of cellulose, hemicellulose and lignin. These models allow a better prediction but re-quire to know the different product yields beforehand. The last category are capable of predicting the production of individual species consider-ing numerous chemical reactions. Nevertheless, their use is heavy to implement and no experimental feedback would have been possible in our case. Here, a modified Broido-Shafizadeh model was used (Fig. A.11)[44]. It assumes that the complexity of biomass pyrolysis can be modeled using macro-components: wood, tars, gas, intermediate solid and char. Tar cracking reactions are taken into account as they have been shown not to be negligible in the case of a thermally thick sample fast pyrolysis[45]. Kinetic parameters may be found inTable A.3. 3.3. Assumptions
Several assumptions were made in order to simplify the problem and solve it:
• the geometry is modeled by a 2D axisymmetrical mesh (Fig. A.12). As a first approach, one can assume that radial and azimuthal values are equal,
• Darcy’s law is used to model the steam, gas and tar flow inside the sample,
• drying and pyrolysis reactions are modeled using first order kinetics and Arrhenius laws,
• a unique temperature will be used to describe fluid and solid temperature at a given point,
• matter diffusion heat transport and viscous dissipation heat will be neglected,
• liquid water motion will be neglected, • gravity will be neglected,
• particle shrinkage will not be taken into account. 3.4. Equations and boundary conditions
Based on the former assumptions, the following coupled equations were solved.
3.4.1. Thermal balance ρCp ð Þeq∂T∂t þρgCpg∇: u!T ! " ¼ −∇: −λeff∇T ! " þ Q ð4Þ ρCp ð Þeq¼ ρsCpsþ ρgCpgþ ρlwCplw ð5Þ
With Q the heat source term:
Q ¼ −XΔhiωi ð6Þ
The initial and boundary conditions are:
T x!!; 0"¼ T0¼ 293K ð7Þ
On the external boundary: − n!: −λeff:∇T
! "
¼ α f βð Þ−ϵσ T4−T4sur
! "
ð8Þ With f(β) the incident heat flux around the sample (Fig. A.13). It was determined using a ray tracing method. It can be seen that the incident heat flux close to the south pole is approximately 3.5 times higher than the average heat flux.
3.4.2. Momentum balance and total gas phase mass continuity
ξMg RT ∂P ∂t −∇: ρg K ξμ ∇P ! −ρg T ∂T ∂t ¼ XN i¼1 ωi ð9Þ ρg¼ PMg RT ξ ð10Þ u ! ¼ −ξμ ∇K P ð11Þ Whereξρg
T ∂T∂taccounts for thermal expansion pressure contribution.
The initial and boundary conditions are:
P x!!; 0"¼ 101325 Pa ð12Þ On the external boundary:
P ¼ 101325 Pa ð13Þ
3.4.3. Solid and gaseous phases continuity
The different species are modeled using density fields. Solid (wood and char) and liquid (water) phases: ∂ρi
∂t ¼ ωi ð14Þ
The initial and boundary conditions are (Table A.4): ρi !; 0x
! "
¼ ρi0 ð15Þ
On the external boundary:
∇ρi¼ 0! ð16Þ
Gaseous (steam, tars and gas) phases: ∂ρgYi ∂t þ ∇ !ρu gYi ! " ¼ −∇: −D∇ρgYi ! " þ ωi ð17Þ ωi¼ XN j¼1 γijkije− Eaij RTρ iρj ð18Þ
The initial and boundary conditions are (Table A.4): Yi !; 0x
! "
¼ Yi0 ð19Þ
On the external boundary:
∇Yi¼ 0! ð20Þ
3.5. Results
The equations were solved using the CFD framework OpenFOAM. In this framework, partial differential equations are solved with a finite volume method. Mesh and time step convergence were checked before producing the following results.
3.5.1. Temperature history
Fig. A.14reports the predicted core temperature computed by the model and the experimentally measured one, in the case of a 10 mm diameter sample containing 9 wt% moisture exposed to a heat flux of 120 kW/m2.
The observed delay of the computed drying step compared to the experimental one can be explained by the simplification used in the model. Indeed, drying is a complex process[46]which was highly simplified using an Arrhenius law in this model.
The model predicts a temperature plateau around 400 °C. This plateau is due to biomass endothermic degradation. It validates the choice of the kinetic parameters set to describe beech wood pyrolysis.
The predicted final core temperature trend is in good agreement with the experimental observations. This agreement has to be analyzed care-fully. Indeed, it was experimentally observed that sample shrinkage is im-portant. Hence, the incident heat flux at the sample surface variates during a run. The surface exposed to radiation decreases while the inci-dent heat flux increases. The geometry and heat flux modification have opposite effects: the incident energy can possibly be roughly the same during a run. It would explain why the model prediction is in good agree-ment with experiagree-mental observation during the heating phase following the pyrolysis plateau. The simultaneous change in geometry and incident heat flux would also explain why the model predicts properly the final core temperature.
3.5.2. Char yield
Fig. A.15reports the numerically predicted char yield versus the incident heat flux. The model succeeds in capturing the trend and the values of the final char yield for different heat fluxes.
3.5.3. Internal fields
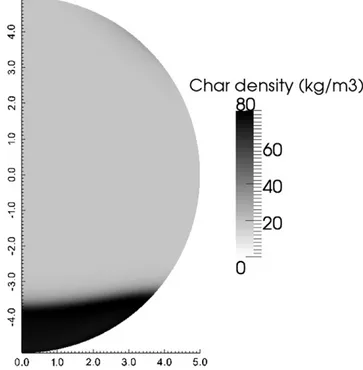
The model was used to predict the position of the pyrolysis front for a given time (Figs. A.16 and A.17): numerical front is located at 1.3 mm of the south pole and experimental one is at 1 mm of the south pole after 26 seconds of reaction. A time of 26 seconds was chosen due to techni-cal feasibility and the fact that at this time the sample still has a spheritechni-cal shape. It allows better comparison between numerical predictions and experimental observations, solid deformation not being taken into account. The discrepancy between the experimental observation and the numerical prediction has to be tempered by the fact that shrinkage was not taken into account in this numerical model. Indeed, if the numerically predicted length is corrected by the experimentally observed shrinkage factor, it becomes 0.95 mm, which is close to the experimental observation.
The model allows to investigate the eventual presence of a drying front prior to the pyrolysis front.Fig. A.18plots the normal reaction rate, which is defined as: ωnorm= ωlw/ωlw,max+ ωc/ωc,max. From the numerical
prediction, one can see a drying front followed by a pyrolysis front. There-fore, the steam released by the drying front diffuses through the high tem-perature char layer produced by the pyrolysis front. This front was numerically evidenced in both 9 wt% and 50 wt% initial moisture content samples. In order to assess the validity of the experimental steam gasifica-tion of char observagasifica-tion, the sample south pole temperature and the steam density values were computed by the numerical model for a 50 wt% moisture sample (Fig. A.19). One can see that steam is in contact with char at temperature higher than 800 °C, up to 1200 °C. Such temper-ature kinetically allows char steam-gasification reactions (not imple-mented in the model) to take place simultaneously with drying inside the sample. This observation correlates the former explanation.
Finally, one should note that the correlations for thermal conductivi-ties, thermal capacities and gas phase viscosity are used out of their validity ranges. Sample core temperature reaches 900 °C. At the same time, sample south pole temperature is around 1200 °C. These tempera-tures are much higher than the validity range upper limit of the used cor-relations. Not knowing precisely theses properties is a concern because temperature controls wood degradation reactions rates, themselves controlling products yields. In order to assess the effect of the uncertainty in the key physical property value, char thermal conductivity was varied by ± 20% (Fig. A.14). Even with theses variations, numerical model succeeds in capturing the core temperature trend and produces results in agreement with experimental observation.
4. Conclusion
The experimental apparatus enabled to submit beech wood particles to high radiative heat flux. The influence of sample diameter, initial
moisture content and incident heat flux on temperature history and char final yield was investigated. Wood moisture was identified as a key parameter. It has a considerable impact on the char production. Indeed, the water contained inside the sample, once vaporized, can gasify the external char layer.
The 2D unsteady numerical model predictions are in good agree-ment with the experiagree-mental observations. The model has also shown limitations. Shrinkage seems to be an important phenomenon that has to be taken into account. The selected biomass degradation scheme was not suited to properly predict char yield.
Nevertheless, this model evidences the presence of a drying front prior to the pyrolysis one. Its prediction lead to think that steam re-leased during the drying step diffuses out through a high temperature char matrix and reacts with it. Therefore, numerical predictions confirm the possibility of char steam-gasification by the water vapor coming from wood drying.
This particular behavior was evidenced under 120 kW/m2; it can be expected to be even more important on an large scale industrial furnace reaching heat flux as high as 10 MW/m2. Therefore, the char production would be lowered and direct syngas production may be expected to increase. For further investigation, experimental studies under higher heat flux will be carried out. The improving of model predictions is subject to a better knowledge of char thermal properties at high temperature.
Acknowledgement
This work was funded by the French “Investments for the future” program managed by the National Agency for Research under contract ANR-10-LABX-22-01.
(1)
(2)
Fig. A.1. Experimental device. (1) power supply, (2) image furnace.
Appendix A. Time extraction method
In order to determine drying, pyrolysis and heating time, core temperature histories were analyzed. We consider that a phenomenon is over when the temperature reading at the sample core inflexion stops. Indeed, for each of these phenomena an inflexion in the temperature history can be ob-served (Fig. A.20). Most of the time, drying is associated to an inflection around 300 °C, pyrolysis to a plateau around 400 °C and final heating time to a plateau at the end of the run. In order to have a repeatable method to determine times when phenomena were over, those times were derived from tangents crossing points. Indeed, one can draw tangents for every inflexion of the temperature history (Fig. A.20). The reported times are the abscissa at the tangents crossing points.
N
2(1)
(2)
(3)
(4)
a = 150mm
b = 50mm
Fig. A.2. Image furnace scheme. (1) sample, (2) mirror, (3) thermocouple, (4) lamp.
0 1 2 3 4 0 0.2 0.4 0.6 0.8 1
Wave length (um)
Reflectivit y (-) 0 100 200 300 400 500 Lamp luminance (kW/m 2.sr. u m)
Fig. A.3. Beech wood (dashed) and char (solid) infrared reflectivities. Tungsten lamp power spectral distribution (thick).
0 50 100 150 200 250 0 200 400 600 800 1000
Time (s)
Temperature (
°C)
Drying Pyrolysis HeatingFig. A.4. Core temperature versus time. Heat flux: 120 kW/m2, initial moisture content: 9 wt%, sample diameter: 10 mm.
Fig. A.5. Samples before and after exposure. From left to right: 5 mm cylinder, 10 mm sphere and 20 mm sphere.
0 100 200 300 400 0 200 400 600 800 50 wt% 9 wt% 1 wt%
Time (s)
Temperature (
°C)
Fig. A.6. Core temperature versus time for different initial moisture. Heat flux: 120 kW/m2, sample diameter: 10 mm.
0 200 400 600 800 1000 0 200 400 600 800 5 mm 10 mm 20 mm
Time (s)
Temperature (
°C)
Fig. A.7. Core temperature versus time for different sample diameter. Heat flux: 60 kW/m2, initial moisture content: 9 wt%.
0 5 10 15 20 25 0 5 10 15 20 25
Diameter(mm)
Char yield (% dry ash free)
Fig. A.8. Final char yield versus sample diameter. Heat flux: 60 kW/m2, initial moisture content: triangle = 0 wt%, square = 9 wt%, disk = 50 wt%.
60 80 100 120 0 5 10 15 20 25
Heat flux (kW/m
2)
Char yield (% dry ash free)
Fig. A.9. Final char yield versus heat flux. Heat flux: varying, initial moisture content: triangle = 0 wt%, square = 9 wt%, disk = 50 wt%, sample diameter: 10 mm.
0 10 20 30 40 50 60 0 5 10 15 20 25
Moisture content (wt%)
Char yield (% dry ash free)
Fig. A.10. Final char yield versus moisture content. Heat flux: 120 kW/m2, initial moisture content: varying, sample diameter: square = 5 mm, triangle = 10 mm.
Gas
Wood Tars
Intermediate solid Char
Water Steam
Fig. A.11. Beech wood decomposition scheme[44].
Wood
Char
0 50 100 150 200 250 0 200 400 600 800 1000
Time (s)
Temperature (
°C)
Fig. A.14. Core temperature versus time. Heat flux: 120 kW/m2, initial moisture content: 9 wt%, sample diameter: 10 mm. Thin lines: experimental results. Dotted line: numerical prediction (black), numerical prediction with ± 20% on the char thermal conductivity (gray). 60 80 100 120 0 5 10 15 20 25
Heat flux (kW/m
2)
Char yield (% dry ash free)
Fig. A.15. Final char yield versus heat flux. Initial moisture content: 9 wt%, sample diameter: 10 mm. Square = experimental observations, solid line = numerical predictions.
0 0.5 1 1.5 2 2.5 3 0 100 200 300 400
β angle (rad)
Heat flux (kW/
m
2)
Fig. A.13. Numerically calculated incident heat flux distribution around a 10 mm sample.
Fig. A.16. Cut of a sample at south pole. Heat flux: 120 kW/m2, initial moisture content: 9 wt%, sample diameter: 10 mm, time: 26 s.
Fig. A.17. Numerically predicted char density field. Heat flux: 120 kW/m2, initial moisture content: 9 wt%, sample diameter: 10 mm, time: 26 s.
Pyrolysis front
Drying front
Drying front
Fig. A.18. Numerically predicted normal reaction rate (ωnorm= ωlw/ωlw,max+ ωc/ωc,max). Reaction fronts are located in the dark regions. Heat flux: 120 kW/m2, initial moisture content: 9 wt%, sample diameter: 10 mm, time: 26 s.
0 20 40 60 80 100 120 0 200 400 600 800 1000 1200 1400
Time (s)
0 0.2 0.4 0.6 0.8 1 1.2 1.4Steam partial pressure (atm.)
Char steam gasification
Temperature (
°
C)
Fig. A.19. Sample temperature (dashed line) and steam density (solid line) evolution versus time at south pole. The period when char steal gasification is chemically possible favored is indicated. Heat flux: 120 kW/m2, initial moisture content: 50 wt%, sample diameter: 10 mm. 0 50 100 150 200 250 0 200 400 600 800 1000
Time (s)
Drying Pyrolysis HeatingTemperature (
°C)
Fig. A.20. Final times extraction method from a particle center time history. Heat flux: 120 kW/m2, initial moisture content: 9 wt%, sample diameter: 10 mm.
Table A.1 Results summary.
Experimental conditions Results Diameter Moisture content Heat flux Drying time Pyrolysis time Heating time Char yield (mm) (wt%) (kW/m2) (s) (s) (s) (% daf) 5 1 60 - 29† 44‡ 13 90 - 19† 27† 11 120 - -⁎ 28‡ 10 150 - 15† 29‡ 10 180 - 16• 22‡ 9† 9 60 12• 27 36 12 90 -⁎ 19• 25 10 120 -⁎ 22• 37‡ 10† 150 6• 17† 30‡ 10 180 -⁎ 18 31‡ 10 50 60 -⁎ 37 59† 10 90 10‡ 29 51† 10 120 -⁎ 23 36 9 150 7‡ 27† 45† 10 180 6† 22 35 9 10 1 60 - 144† 198† 18 80 - 110† 171† 19 100 - 73‡ 110‡ 16 120 - 97 158 15† 9 60 40‡ 155† 231 20 80 31 125† 185 19 100 26 87† 142 17 120 24 111† 189 17 50 60 74‡ 168‡ 225‡ 16† 80 126† 244† 341 15 100 90 191 262 14 120 102 218 286 14† 20 1 60 - 673 830 22 9 60 94 525 676 23 50 60 580 1335† 1496 20
- data not available,⁎unable to extract data,•data based on a single run,†data dispersion between 10 and 20%,‡data dispersion over 20%.
References
[1] C. Di Blasi, Combustion and gasification rates of lignocellulosic chars, Progress in Energy and Combustion Science 35 (2) (2009) 121–140,http://dx.doi.org/10.1016/j.pecs.2008. 08.001(URLhttp://www.sciencedirect.com/science/article/pii/S0360128508000440). [2] R. F. Service, Sunlight in your tank, Science 326 (5959) (2009) 1472–1475 (WOS:
000272623600010).
[3] M. Guerrero, M. Ruiz, M. Alzueta, R. Bilbao, A. Millera, Pyrolysis of eucalyptus at different heating rates: studies of char characterization and oxidative reactivity, Journal of Analytical and Applied Pyrolysis 74 (1–2) (2005) 307–314,http://dx. doi.org/10.1016/j.jaap.2004.12.008(URLhttp://www.sciencedirect.com/science/ article/pii/S0165237005000318).
[4] O. Authier, M. Ferrer, G. Mauviel, A.-E. Khalfi, J. Lede, Wood fast pyrolysis: Compar-ison of lagrangian and eulerian modeling approaches with experimental measure-ments, Industrial & Engineering Chemistry Research 48 (10) (2009) 4796–4809,
http://dx.doi.org/10.1021/ie801854c(WOS:000266081300016).
[5] J. Lédé, F. Blanchard, O. Boutin, Radiant flash pyrolysis of cellulose pellets: products and mechanisms involved in transient and steady state conditions, Fuel 81 (10) (2002) 1269–1279, http://dx.doi.org/10.1016/S0016-2361(02)00039-X (URL
http://www.sciencedirect.com/science/article/pii/S001623610200039X). [6] A. Galgano, C. Di Blasi, Modeling the propagation of drying and decomposition
fronts in wood, Combustion and Flame 139 (1–2) (2004) 16–27,http://dx.doi.org/
10.1016/j.combustflame.2004.07.004(URLhttp://www.sciencedirect.com/science/ article/pii/S0010218004001488).
[7] W.-C.R. Chan, M. Kelbon, B.B. Krieger, Modelling and experimental verification of physical and chemical processes during pyrolysis of a large biomass particle, Fuel 64 (11) (1985) 1505–1513,http://dx.doi.org/10.1016/0016-2361(85)90364-3
(URLhttp://www.sciencedirect.com/science/article/pii/0016236185903643). [8] N. Piatkowski, C. Wieckert, A.W. Weimer, A. Steinfeld, Solar-driven gasification of
carbonaceous feedstock-a review, Energy & Environmental Science 4 (1) (2011) 73–82,http://dx.doi.org/10.1039/c0ee00312c(WOS:000285748400006). [9] E. Gordillo, A. Belghit, A bubbling fluidized bed solar reactor model of biomass char
high temperature steam-only gasification, Fuel Processing Technology 92 (3) (2011) 314–321,http://dx.doi.org/10.1016/j.fuproc.2010.09.021(URLhttp://www. sciencedirect.com/science/article/pii/S0378382010003218).
[10] X. Li, J. Grace, C. Lim, A. Watkinson, H. Chen, J. Kim, Biomass gasification in a circu-lating fluidized bed, Biomass and Bioenergy 26 (2) (2004) 171–193,http://dx.doi. org/10.1016/S0961-9534(03)00084-9(URLhttp://www.sciencedirect.com/science/ article/pii/S0961953403000849).
[11] N. Piatkowski, A. Steinfeld, Solar gasification of carbonaceous waste feedstocks in a packed-bed reactor—Dynamic modeling and experimental validation, AIChE Journal 57 (12) (2011) 3522–3533,http://dx.doi.org/10.1002/aic.12545(URLhttp:// onlinelibrary.wiley.com/doi/10.1002/aic.12545/abstract).
[12] N. Piatkowski, C. Wieckert, A. Steinfeld, Experimental investigation of a packed-bed solar reactor for the steam-gasification of carbonaceous feedstocks, Fuel Processing Technology 90 (3) (2009) 360–366,http://dx.doi.org/10.1016/j.fuproc.2008.10.007
(URLhttp://www.sciencedirect.com/science/article/pii/S0378382008002671). [13] A. Z’Graggen, A. Steinfeld, Hydrogen production by steam-gasification of
carbona-ceous materials using concentrated solar energy – v. reactor modeling, optimization, and scale-up, International Journal of Hydrogen Energy 33 (20) (2008) 5484–5492,
http://dx.doi.org/10.1016/j.ijhydene.2008.07.047(URLhttp://www.sciencedirect. com/science/article/pii/S036031990800904X).
[14] J. Chen, Y. Lu, L. Guo, X. Zhang, P. Xiao, Hydrogen production by biomass gasification in supercritical water using concentrated solar energy: System development and proof of concept, International Journal of Hydrogen Energy 35 (13) (2010) 7134–7141,http://dx.doi.org/10.1016/j.ijhydene.2010.02.023(URLhttp://www. sciencedirect.com/science/article/pii/S0360319910002740).
[15] V. Minkova, S. Marinov, R. Zanzi, E. Björnbom, T. Budinova, M. Stefanova, L. Lakov, Thermochemical treatment of biomass in a flow of steam or in a mixture of steam and carbon dioxide, Fuel Processing Technology 62 (1) (2000) 45–52,http://dx. doi.org/10.1016/S0378-3820(99)00065-X(URLhttp://www.sciencedirect.com/ science/article/pii/S037838209900065X).
[16] M. Christodoulou, G. Mauviel, J. Lédé, P. Beaurain, M. Weber, H. Legall, F. Billaud, Novel vertical image furnace for fast pyrolysis studies, Journal of Analytical and Ap-plied Pyrolysis 103 (2013) 255–260,http://dx.doi.org/10.1016/j.jaap.2012.11.006
(URLhttp://www.sciencedirect.com/science/article/pii/S0165237012002276). [17] E. Kagambage, Etude et conception d’un banc de mesures d’émissivités infrarouges,
Tech. rep. Université de Reims, 2007.
[18] W.R. Wade, Measurements of total hemispherical emissivity of various oxidized metals at high temperature, Report NACA-TN-4206, NASA, Mar. 1958, (URL
http://digital.library.unt.edu/ark:/67531/metadc57049/).
[19] M. Bordival, F. Schmidt, Y.L. Maoult, V. Velay, Optimization of preform temperature distribution for the stretch-blow molding of PET bottles: Infrared heating and blow-ing modelblow-ing, Polymer Engineerblow-ing & Science 49 (4) (2009) 783–793,http://dx.doi. org/10.1002/pen.21296 (URL http://onlinelibrary.wiley.com/doi/10.1002/pen. 21296/abstract).
[20] M. Forsth, A. Roos, Absorptivity and its dependence on heat source temperature and degree of thermal breakdown, Fire and Materials 35 (5) (2011) 285–301,http://dx. doi.org/10.1002/fam.1053(WOS:000294175800003).
[21] M. Gupta, J. Yang, C. Roy, Specific heat and thermal conductivity of softwood bark and softwood char particles, Fuel 82 (8) (2003) 919–927,http://dx.doi.org/10. 1016/S0016-2361(02)00398-8(WOS:000182003900006).
[22] A. Gómez-Barea, P. Ollero, R. Arjona, Reaction-diffusion model of TGA gasification experiments for estimating diffusional effects, Fuel 84 (12–13) (2005) 1695–1704,
http://dx.doi.org/10.1016/j.fuel.2005.02.003(URLhttp://www.sciencedirect.com/ science/article/pii/S0016236105000517).
[23] S. Youcef-Ali, J. Desmons, Numerical and experimental study of a solar equipped with offset rectangular plate fin absorber plate, Renewable Energy 31 (13) (2006) 2063–2075,http://dx.doi.org/10.1016/j.renene.2005.10.008(URLhttp://www. sciencedirect.com/science/article/pii/S0960148105002922).
[24] T. Damartzis, G. Ioannidis, A. Zabaniotou, Simulating the behavior of a wire mesh reac-tor for olive kernel fast pyrolysis, Chemical Engineering Journal 136 (2–3) (2008) 320–330,http://dx.doi.org/10.1016/j.cej.2007.04.010(URLhttp://www.sciencedirect. com/science/article/pii/S1385894707002550).
[25] C. Di Blasi, C. Branca, A. Santoro, E. Gonzalez Hernandez, Pyrolytic behavior and products of some wood varieties, Combustion and Flame 124 (1–2) (2001) 165–177,http://dx.doi.org/10.1016/S0010-2180(00)00191-7(URLhttp://www. sciencedirect.com/science/article/pii/S0010218000001917).
[26] J.-S. Chern, A.N. Hayhurst, A model for the devolatilization of a coal particle suffi-ciently large to be controlled by heat transfer, Combustion and Flame 146 (3) (2006) 553–571,http://dx.doi.org/10.1016/j.combustflame.2006.04.011(WOS: 000239871400012).
[27] C. Di Blasi, Analysis of convection and secondary reaction effects within porous solid fuels undergoing pyrolysis, Combustion Science and Technology 90 (5–6) (1993) 315–340, http://dx.doi.org/10.1080/00102209308907620 (URL http://www. tandfonline.com/doi/abs/10.1080/00102209308907620).
[28] N. Puiroux, M. Prat, M. Quintard, Non-equilibrium theories for macroscale heat transfer: ablative composite layer systems, International Journal of Thermal Table A.2
Physical properties values.
Symbol Name Value Dimension Reference
α Char surface absorptivity 0.88 -
-ϵ Char surface emissivity 0.88 -
-ξw Wood porosity 0.51 -
-ξc Char porosity 0.85 -
-Ts Typical sample surface temperature 900 °C
-Tsur Surrounding typical temperature 50 °C
-∆T Typical temperature difference 850 °C
-d Sample diameter 0.01 m
-D Gas dispersion tensor typical value 8.45 10-6 m2/s [29] ϕ Mean incident radiative heat flux 120 kW/m2
-ρw Wood apparent density 701 kg/m3
-∆P Overpressure across the sample 30000 Pa [47]
Kw Wood permeability tensor typical value 7.52 10
-13m2 [29]
Kc Char permeability tensor typical value 1.0 10
-11 m2 [48]
^
dp Mean pore diameter 55.3 10-6 m [49]
Table A.3
Kinetic parameters for water vaporisation and beech wood pyrolysis.
Reaction k (s-1) E
a(kJ/mol) ∆h (kJ/kg) Reference
Water ↦ steam 5.13 106 88.0 −2.44 103 [50]
Wood ↦ gas 4.38 109 152.7 −80 [44]
Wood ↦ tars 1.08 1010 148.0 −80 [44]
Wood ↦ intermediate solid 3.75 106 111.7 −80 [44] Intermediate solid ↦ char 1.38 1010 161.0 300 [44]
Tar ↦ gas 4.28 106 108.0 42 [44]
Tar ↦ char 1 105 108.0 42 [44]
Table A.4
Species initial conditions.
Species Initial apparent density (kg/m3) Initial mass fraction (−)
Wood 701 -Char 0 -Liquid water 70 -Steam - 0 Nitrogen - 1 Tar - 0 Gas - 0
Sciences 43 (6) (2004) 541–554,http://dx.doi.org/10.1016/j.ijthermalsci.2003.11. 004(URLhttp://www.sciencedirect.com/science/article/pii/S1290072903001819). [29]E. Agoua, P. Perre, Mass transfer in wood: Identification of structural parameters
from diffusivity and permeability measurements, Journal of Porous Media 13 (11) (2010) 1017–1024 (WOS:000285561200008).
[30] G. Gauthier, Synthèse de biocarburants de deuxième génération: Etude de la pyrolyse à haute température de particules de bois centimétriques, (Ph.D. thesis) INPT EMAC, 2013.
[31] I.I. Kantorovich, E. Bar-Ziv, Heat transfer within highly porous chars: a review, Fuel 78 (3) (1999) 279–299,http://dx.doi.org/10.1016/S0016-2361(97)00258-5(URL
http://www.sciencedirect.com/science/article/pii/S0016236197002585). [32] J. Blondeau, H. Jeanmart, Biomass pyrolysis at high temperatures: Prediction of
gas-eous species yields from an anisotropic particle, Biomass and Bioenergy 41 (2012) 107–121,http://dx.doi.org/10.1016/j.biombioe.2012.02.016(URLhttp://www. sciencedirect.com/science/article/pii/S0961953412001043).
[33] T. Harada, T. Hata, S. Ishihara, Thermal constants of wood during the heating process measured with the laser flash method, Journal of Wood Science 44 (6) (1998) 425–431,http://dx.doi.org/10.1007/BF00833405(URLhttp://www.springerlink. com/content/r839347w63727705/abstract/).
[34] J. Larfeldt, B. Leckner, M.C. Melaaen, Modelling and measurements of heat trans-fer in charcoal from pyrolysis of large wood particles, Biomass & Bioenergy 18 (6) (2000) 507–514, http://dx.doi.org/10.1016/S0961-9534(00)00008-8
(WOS:000087546500007).
[35] M.W. Chase, United States, National Bureau of Standards, NIST-JANAF Themochemical Tables, fourth edition American Chemical Society; American Institute of Physics for the National Bureau of Standards, Washington, D.C.; New York, 1998.
[36] J. Millat, W.A. Wakeham, The thermal conductivity of nitrogen and carbon monox-ide in the limit of zero density, Journal of Physical and Chemical Reference Data 18 (2) (1989) 565–581,http://dx.doi.org/10.1063/1.555827URLhttp://scitation. aip.org/content/aip/journal/jpcrd/18/2/10.1063/1.555827.
[37] L.S. Zaitseva, L.V. Yakush, N.A. Vanicheva, Thermal conductivities of benzene and tolu-ene vapors, Journal of Engineering Physics 31 (5) (1976) 1292–1295,http://dx.doi. org/10.1007/BF00859307URLhttp://link.springer.com/article/10.1007/BF00859307. [38] J.V. Sengers, J.T.R. Watson, R.S. Basu, B. Kamgar-Parsi, R.C. Hendricks, Representative
equations for the thermal conductivity of water substance, Journal of Physical and Chemical Reference Data 13 (3) (1984) 893–933,http://dx.doi.org/10.1063/1. 555718(URLhttp://scitation.aip.org/content/aip/journal/jpcrd/13/3/10.1063/1. 555718).
[39] R.D. Goodwin, Benzene thermophysical properties from 279 to 900 k at pressures to 1000 bar, Journal of Physical and Chemical Reference Data 17 (4) (1988) 1541–1636, http://dx.doi.org/10.1063/1.555813 URL http://scitation.aip.org/ content/aip/journal/jpcrd/17/4/10.1063/1.555813.
[40] K. Wonsoo, C. Tong-Seek, P. Hyunsuk, A paradigm for the viscosity of fluids, Bulletin of the Korean Chemical Society 9 (4) (1998) 213–217.
[41] E. Vogel, Towards reference viscosities of carbon monoxide and nitrogen at low den-sity using measurements between 290 K and 680 K as well as theoretically calculat-ed viscosities, International Journal of Thermophysics 33 (5) (2012) 741–757,
http://dx.doi.org/10.1007/s10765-012-1185-1 (URL http://link.springer.com/ article/10.1007/s10765-012-1185-1).
[42] C.F. Bonilla, R.D. Brooks, P.L.J. Walker, The viscosity of steam and of nitrogen at atmo-spheric pressure and high temperature, Heat-Transfer Discussions, London, 1951, pp. 79–85.
[43] C. Branca, P. Giudicianni, C. Di Blasi, GC/MS characterization of liquids generated from low-temperature pyrolysis of wood, Industrial & Engineering Chemistry Re-search 42 (14) (2003) 3190–3202,http://dx.doi.org/10.1021/ie030066d(WOS: 000183991400003).
[44] W.C. Park, A. Atreya, H.R. Baum, Experimental and theoretical investigation of heat and mass transfer processes during wood pyrolysis, Combustion and Flame 157 (3) (2010) 481–494,http://dx.doi.org/10.1016/j.combustflame.2009.10.006(URL
http://www.sciencedirect.com/science/article/pii/S0010218009002843). [45] P.O. Okekunle, T. Pattanotai, H. Watanabe, K. Okazaki, Numerical and experimental
investigation of intra-particle heat transfer and tar decomposition during pyrolysis of wood biomass, Journal of Thermal Science and Technology 6 (3) (2011) 360–375,http://dx.doi.org/10.1299/jtst.6.360(WOS:000295920800004). [46] P. Perré, I.W. Turner, A 3-d version of TransPore: a comprehensive heat and mass
transfer computational model for simulating the drying of porous media, Interna-tional Journal of Heat and Mass Transfer 42 (24) (1999) 4501–4521,http://dx.doi. org/10.1016/S0017-9310(99)00098-8(URLhttp://www.sciencedirect.com/science/ article/pii/S0017931099000988).
[47] B. Moghtaderi, The state-of-the-art in pyrolysis modelling of lignocellulosic solid fuels, Fire and Materials 30 (1) (2006) 1–34,http://dx.doi.org/10.1002/fam.891
(WOS:000235521800001).
[48] M.G. Grønli, M.C. Melaaen, Mathematical model for wood pyrolysis comparison of experimental measurements with model predictions, Energy and Fuels 14 (4) (2000) 791–800,http://dx.doi.org/10.1021/ef990176q(URLhttp://dx.doi.org/10. 1021/ef990176q).
[49] P. Hass, F.K. Wittel, S.A. McDonald, F. Marone, Pore space analysis of beech wood: The vessel network, Holzforschung 64 (2010) 639–644 (URLhttp://www. comphys.ethz.ch/hans/p/516.pdf).
[50] K.M. Bryden, K.W. Ragland, C.J. Rutland, Modeling thermally thick pyrolysis of wood, Biomass and Bioenergy 22 (1) (2002) 41–53,http://dx.doi.org/10.1016/ S0961-9534(01)00060-5(URLhttp://www.sciencedirect.com/science/article/ pii/S0961953401000605).