HAL Id: hal-02270621
https://hal.archives-ouvertes.fr/hal-02270621
Submitted on 26 Aug 2019HAL is a multi-disciplinary open access
archive for the deposit and dissemination of sci-entific research documents, whether they are pub-lished or not. The documents may come from teaching and research institutions in France or abroad, or from public or private research centers.
L’archive ouverte pluridisciplinaire HAL, est destinée au dépôt et à la diffusion de documents scientifiques de niveau recherche, publiés ou non, émanant des établissements d’enseignement et de recherche français ou étrangers, des laboratoires publics ou privés.
The triggering factors of the Móafellshyrna debris slide
in northern Iceland: Intense precipitation, earthquake
activity and thawing of mountain permafrost
Þorsteinn Sæmundsson, Costanza Morino, Jón Kristinn Helgason, Susan
Conway, Halldór Pétursson
To cite this version:
Þorsteinn Sæmundsson, Costanza Morino, Jón Kristinn Helgason, Susan Conway, Halldór Pétursson. The triggering factors of the Móafellshyrna debris slide in northern Iceland: Intense precipitation, earthquake activity and thawing of mountain permafrost. Science of the Total Environment, Elsevier, 2018, 621, pp.1163-1175. �10.1016/j.scitotenv.2017.10.111�. �hal-02270621�
1
The triggering factors of the Móafellshyrna debris slide in
1northern Iceland: intense precipitation, earthquake activity
2and thawing of mountain permafrost.
3Þorsteinn Sæmundsson(a), Costanza Morino(b), Jón Kristinn Helgason(c), Susan J. 4
Conway(d), Halldór G. Pétursson(e). 5
(a) Department of Geography and Tourism, University of Iceland, Askja, Sturlugata 7, 101 Reykjavík,
6
Iceland
7
(b) School of Environment, Earth & Ecosystems, The Open University, Milton Keynes MK7 6AA, UK
8
(c) Icelandic Meteorological Office, Avalanche Centre, Suðurgata 12, 400 Ísafjörður, Iceland
9
(d) Laboratoire de Planétologie et Géodynamique de Nantes UMR-CNRS 6112, 2, rue de la Houssinière,
10
BP 92208, 44322 NANTES Cedex 3, France
11
(e) Icelandic Institute of Natural History. Borgum við Norðurslóð, 602 Akureyri, Iceland
12 13
Abstract
14
On the 20th September 2012, a large debris slide occurred in the Móafellshyrna Mountain in the
15
Tröllaskagi peninsula, central north Iceland. Our work describes and discusses the relative
16
importance of the three factors that may have contributed to the failure of the slope: intense
17
precipitation, earthquake activity and thawing of ground ice. We use data from weather stations,
18
seismometers, witness reports and field observations to examine these factors. The slide initiated
19
after an unusually warm and dry summer followed by a month of heavy precipitation.
20
Furthermore, the slide occurred after three seismic episodes, whose epicentres were located ~60
21
km NNE of Móafellshyrna Mountain. The main source of material for the slide was ice-rich
22
colluvium perched on a topographic bench. Blocks of ice-cemented colluvium slid and then broke
23
off the frontal part of the talus slope, and the landslide also involved a component of debris slide,
24
which mobilised around 312 000 - 480 000 m3 (as estimated from field data and aerial images of
25
erosional morphologies). From our analysis we infer that intense precipitation and seismic activity
26
prior to the slide are the main preparatory factors for the slide. The presence of ice-cemented
27
blocks in the slide’s deposits leads us to infer that deep thawing of ground ice was likely the final
28
triggering factor. Ice-cemented blocks of debris have been observed in the deposits of two other
29
recent landslides in northern Iceland, in the Torfufell Mountain and the Árnesfjall Mountain. This
30
suggests that discontinuous mountain permafrost is degrading in Iceland, consistent with the
31
decadal trend of increasing atmospheric temperature in Iceland. This study highlights a newly
32
identified hazard in Iceland: landslides as a result of ground ice thaw. Knowledge of the detailed
33
distribution of mountain permafrost in colluvium on the island is poorly constrained and should be
34
a priority for future research in order to identify zones at risk from this hazard.
35 36
2
1. Introduction
37
On the 20th September 2012, the local residents of the Þrasastaðir farm in the Fljótin 38
area (Tröllaskagi peninsula, central north Iceland; Figs. 1,3), heard a loud rumbling noise 39
coming from the Móafellshyrna Mountain, as a large debris slide descended the north-40
western side of the mountain (Fig. 3). Nine days after the failure, we observed large 41
blocks of ice-cemented deposits within the debris slide deposits. 42
Rapid mass movements, including rock falls, rock avalanches, debris flows and debris 43
slides, are common geomorphological processes in Iceland and present a significant and 44
direct threat to many towns, villages and farmhouses (Decaulne 2005; 2007). 45
Precipitation, snow melt, temperature variations and earthquake activity are the most 46
common triggering factors for landslides in Iceland (Sæmundsson et al., 2003; 47
Sæmundsson and Decaulne, 2007, Decaulne & Sæmundsson 2007). However, during 48
the last decade, three, somewhat unusual, rapid mass movements have occurred in 49
northern Iceland: on the Torfufell Mountain (Eyjafjörður valley, central north Iceland) on 50
14th October 2011, on the Móafellshyrna Mountain on 20th September 2012 (case study 51
of this paper), and on the Árnesfjall Mountain (Westfjords) on 10th July 2014 (Sæmunds-52
son et al., 2013; Sæmundsson et al., 2014 a/b). In all these landslides ice-cemented 53
debris was found within the deposits, a phenomenon that has never been reported 54
previously in Iceland. The source areas of these slides are all located on steep (~45-60°) 55
NW to NE facing-slopes, where discontinuous permafrost might be expected (e.g. 56
Gorbunov, 1988; King, 1986). The source areas at Torfufell and Móafellshyrna are 57
located at elevations of 750-870 m a.s.l., within the zone of discontinuous permafrost in 58
Iceland as calculated by Etzelmüller et al. (2007a), whereas at Árnesfjall the source area 59
is located at about 400 m a.s.l., which is much lower altitude than ever observed for 60
mountain permafrost in Iceland (Etzelmüller et al., 2007a). Intense precipitation was 61
recorded prior to all of these slides (Sæmundsson et al., 2013; Sæmundsson et al., 2014 62
a/b). In this paper, we present the case study of the Móafellshyrna debris slide, where we 63
examine three factors could have contributed to this failure: intense precipitation, 64
earthquake activity and ground-ice degradation (via increased annual temperatures). We 65
emphasise the field evidence of ground ice-thaw, because permafrost degradation has 66
never previously been considered as a triggering factor for gravitational mass 67
movements in Iceland, although permafrost degradation is considered to be an 68
preparatory factor for paraglacial slope failure (McColl 2012). 69
3
In the following sections we describe a) the state of knowledge of permafrost in Iceland, 70
b) seismic conditions in Iceland and their role in previous mass wasting events, c) 71
general meteorological conditions in Iceland. We then report our results, reconstructing 72
the conditions that favoured the occurrence of the landslide. We then discuss our results, 73
dividing the factors that induced the landslide into, i) preparatory and ii) triggering (as per 74
McColl, 2012). We finally posit that Móafellshyrna landslide was preconditioned by 75
combination of intense precipitation in the weeks prior to the slide and the seismic activity 76
on 18th and 19th September and that the degradation of ground-ice was the final trigger. 77
4 78
5
Figure 1 – The Móafellshyrna site, located in the Tröllaskagi peninsula, northern Iceland (see Fig. 3 for
79
detailed location), and the location of the weather stations used for this study. The hillshaded digital
80
elevation model used as a basis of this map is from the Digital Elevation Model over Europe (EU-DEM)
81
from the Global Monitoring for Environment and Security service for geospatial reference data access
82
project (GMES RDA). The table provides details on the Icelandic Meteorological Office weather stations,
83
whose datasets have been used for this study. Symbols “X” and “-“ mean that data are or are not available
84
at the stations, respectively.
85
1.1 Permafrost distribution in Iceland
86
During the last decade our knowledge of the regional distribution of permafrost in Iceland 87
has increased considerably (e.g. Etzelmüller et al., 2007a/b; Farbrot et al., 2007a/b; 88
Kellerer-Pirklbauer, 2007; Lilleören et al., 2013; Kneisel et al., 2007; Kneisel, 2010). 89
There are several published works on permafrost in the central highlands of Iceland 90
dating back to the 1950s, and these studies focused on geomorphological features, such 91
as palsas and patterned ground (e.g., Thorarinsson, 1951; 1964; Friedman et al., 1971; 92
Schunke, 1974; Stingl and Herrmann, 1976; Priesnitz and Schunke 1978; Hirakawa, 93
1986; Thorhallsdottir, 1994; 1996; 1997; Sæmundsson et al., 2012). These works both 94
mapped permafrost conditions and a recent study at the Orravatnsrústir palsa site, NE of 95
the Hofsjökull ice cap, showed clear indications of declining permafrost conditions from 96
2000-2010 in the highlands (Sæmundsson et al., 2012). Studies have also sought to 97
better define the spatial distribution of mountain permafrost in Iceland. Such studies used 98
inventories of rock glaciers and stable ice-corded moraines combined with meteorological 99
data analyses (e.g., Etzelmüller et al., 2007a/b; Farbrot et al., 2007a/b; Kellerer-100
Pirklbauer, 2007; Lilleören et al., 2013) and Electrical Resistivity Tomography (e.g., 101
Kneisel et al., 2007; Kneisel, 2010; Sæmundsson et al., 2012). These works did not 102
comment on the dynamics of the permafrost. 103
Etzelmüller et al. (2007a) published the first regional distribution map of mountain perma-104
frost in Iceland. This was the first attempt to understand the overall extent of mountain 105
permafrost on the island. The map was based on a model which used meteorological 106
data calibrated with ground surface temperature data and validated using ground 107
temperature data from four shallow boreholes and an inventory of rock glaciers. 108
According to Etzelmüller et al. (2007a), mountain permafrost is widespread in the 109
northern and eastern Iceland above 800-900 m, covering 8% of the island, or around 110
8.000 km2. 111
6
A warming trend in atmospheric temperature has been observed in Iceland over the last 112
two centuries. In Stykkishólmur in western Iceland records show an increase of about 113
0.7°C per century (Nawri & Björnsson, 2010; Jónsson, 2008). From 1975 to 2008 the 114
warming rate was much higher or about 0.35°C per decade (Ministry for the Environment 115
of Iceland, 2010). However, so far relatively little attention has been paid to the 116
consequences of the recent climate change on the possible degradation of mountain 117
permafrost in Iceland. 118
1.2 Seismic activity in northern Iceland
119
The seismic activity in Iceland is related to its position on the Mid-Atlantic plate boundary, 120
which crosses the island and its location over the Icelandic Hotspot (e.g. Tryggvason et 121
al.,1983; Wolfe et al., 1997; Allen et al., 2002; Bjarnason, 2008; Einarsson, 2008;
122
Thordarson & Höskuldsson 2002). The seismic activity in the northernmost region of the 123
island is related to the Tjörnes Fracture Zone (Einarsson and Björnsson, 1979; 124
Sæmundsson, 1974), which is defined by three seismically active lineaments - the 125
Grímsey Oblique Rift, the Húsavík Flatey Fault and the Dalvík lineament; (e.g., 126
Sæmundsson, 1974; Gudmundsson, 2000; 2006) - and includes the Eyjafjarðaráll N-S 127
extensional graben, located north offshore the Tröllaskagi peninsula (Fig. 2). It was 128
activity on this fault system which caused the earthquakes prior to the Móafellshyrna 129
slide. 130
Earthquakes are known to have triggered landslide and rockfall activity in Iceland in the 131
past (e.g. Jónsson, 1957; Jónsson and Pétursson, 1992; Thorarinsson, 1937, 1959; 132
Halldórsson, 1984; Jensen, 2000; Sæmundsson et al., 2003; Ágústsson and Pétursson, 133
2013), but no study has explored in detail the influence of earthquake activity as a 134
preparatory and/or triggering factor on rockfall or landslides in Iceland, as has been done 135
elsewhere in the world (e.g., Harp and Jibson, 1996; Yin et al., 2009). The above 136
mentioned Icelandic studies relate mass movements to larger earthquakes than those 137
prior to the slide in Móafellshyrna, e.g. in June 2000, when two earthquakes of magnitude 138
6.4 occurred in Iceland, with the epicentre in the middle of the southern lowlands. 139
Rockfall activity was reported as a result of this event as far as 75 km from the epicentre 140
(Sæmundsson et al., 2003). 141
7 142
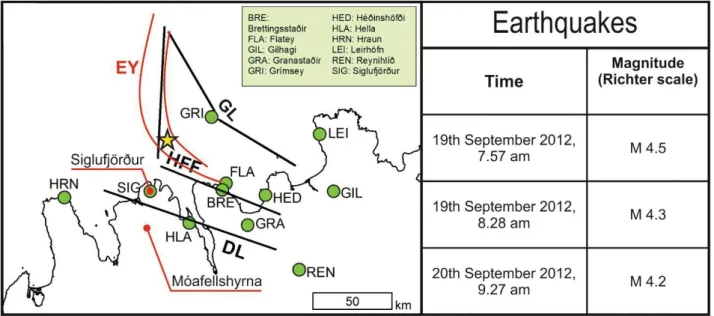
Figure 2 - The structural elements of the Tjörnes Fracture Zone marked in black (Grímsey lineament
143
(GOR), Húsavík-Flatey fault (HFF) and Dalvík lineament (DL); from Stefánsson et al., 2008) and the
144
Eyjafjarðaráll graben marked in red (EY); the position of the epicenter zone for the earthquakes preceding
145
the Móafellshyrna slide is marked with a yellow star, the Icelandic Meteorological Office (IMO)
146
seismometers in the area marked with the green dots and the labels refer to their abbreviated names, as
147
given in full in the key. On the right are reported the timing and magnitude of the earthquake sequence in
148
the Eyjafjarðaráll graben from 19th to 20th September 2012 (from Gudmundsson et al., 2014).
149
1.3 General weather conditions in Iceland
150
Weather patterns in Iceland are highly variable, with frequent and strong variation in 151
precipitation and temperature; this is mainly because Iceland is located on the main path 152
taken by North Atlantic low-pressure systems (Einarsson 1984). The mean annual air 153
temperature for the period 1971–2000 was 4–5°C in the south, 3–4°C in the east and 154
west and 2–3°C in northern coastal parts of the country (Tveito et al., 2000). Hence 155
precipitation can fall as both snow and rain. The two main dominant precipitation wind 156
direction in the Tröllaskagi area are NE and SW (Brynjólfsson and Ólafsson 2008, 157
Arnalds et al., 2001). The precipitation is heaviest during strong NE winds. 158
Consequently, mean annual precipitation increases from about 500 – 1000 mm per year 159
in the central and northern parts of the country to more than 3000 mm/yr in the southeast 160
(Crochet et al., 2007). During the winter months from October to April the precipitation in 161
the outer part of the Tröllaskagi peninsula is almost exclusive snow or sleet and the main 162
part of the snow avalanche activity is associated with strong north-easterly wind. The 163
northern part of Tröllaskagi peninsula is generally a heavy snow prone area and 164
Siglufjörður and Fljótin area are generally considered to be one of the heaviest snow 165
prone areas in Iceland (Arnalds et al. 2001). 166
8
2. Geographic and Geologic Setting of Móafellshyrna
167
The Tröllaskagi peninsula is a mountain massif located between the Eyjafjörður fjord in 168
the east and the Skagafjörður fjord in the west (Fig. 1). The peninsula is topped by flat 169
summits reaching up to 1000 – 1500 m a.s.l. and sculptured by glacial erosion with 170
glacially carved fjords, valleys and cirques. Such over-steepened landscapes are 171
recognised as one of the key pre-conditioning factors for failures (McColl 2012). Over 172
150 alpine glaciers, mainly north facing, have been mapped in this massif (Sigurðsson 173
and Williams, 2008). 174
The bedrock in the outermost part of the Tröllaskagi peninsula falls within the Tertiary 175
basalt series (16-3.3 M years; e.g., Moorbath et al., 1968; McDougall et al., 1984; 176
Watkins and Walker, 1977). This series is mostly jointed basaltic lava flows, composed of 177
2 to 30 m thick individual flows separated by lithified sedimentary horizons (from few 178
centimetres up to tenths of meters thick) (Sæmundsson 1979; Sæmundsson et al.,1980). 179
The bedrock is heavily jointed and intersected by dikes, and the general dip angle of the 180
lava beds is towards the southwest (Sæmundsson et al., 1980; Johannesson and 181
Sæmundsson, 2009; Hjartarson & Sæmundsson 2014). 182
The Tröllaskagi peninsula is located on the main path of the North Atlantic low pressure 183
system, with a variable and turbulent weather. Winters are long and mild and summers 184
brief and cool (Einarsson, 1984). The Mean Annual Air Temperature (MAAT) for the 185
period 1971-2000 was 2-3°C in the northern coastal areas (Tveito et al., 2000; Crochet et 186
al., 2007). The data series for the Tröllaskagi area between 1940-1970 show MAAT of
2-187
4°C in the coastal areas and -2 to -4°C at the summits (Einarsson, 1964). According to 188
Crochet et al. (2007), the annual precipitation from 1971-2000 in the Tröllaskagi area 189
varies from 1000-1500 mm in the coastal lowlands up to 2000-2500 mm on the summits. 190
Localised orographic effects mean that in the Tröllaskagi peninsula precipitation is higher 191
near the coastline when there are northerly winds (Brynjólfsson and Ólafsson 2008). 192
Conversely, the precipitation is likely to be higher in the lowlands in the interior of the 193
Tröllaskagi peninsula area than at the coast during periods with southerly winds. In the 194
mountains of the peninsular the orographic effect would also play a role during southerly 195
winds precipitation may in fact be even higher at a higher elevation. According to Arnalds 196
et al. (2001), more than half of the recorded precipitation in Siglufjörður occurs
197
throughout the winter months (Oct-Apr), where the precipitation is almost exclusively 198
snow or sleet. This can also be said about the rest of Tröllaskagi peninsula. Avalanches 199
9
during winter months in Tröllaskagi peninsula can be associated with strong north-200
easterly winds with snowfall or snowfall during south-westerly winds associated with 201
lower wind speed. Slush flows are not common in Tröllaskagi area. 202
The Móafellshyrna Mountain is located in the Fljótin area in the outermost part of the 203
Tröllaskagi peninsula in central north Iceland (Figs.1, 3). The mountain is 1044 m high, 204
with narrow alpine-mountain ridge orientated in the north-south direction. It is located 205
between the Móafellsdalur tributary valley in the west and the Hvarfdalur tributary valley 206
in the east (Fig. 3). In the outermost part of the western valley side of Móafellsdalur are 207
old remnants of a landslide that originated from the western mountain side. The age of 208
these old landslide deposits is not known. Jónsson (1957, 1976) stated that the landslide 209
activity in Iceland was most intense shortly after the last deglaciation. His statement has 210
been confirmed by later studies (e.g. Jonson et al. 2004, Sigurgeirsson and Hjartarson 211
2011, Mercier et al. 2012 and 2013, Coquin et al. 2015 and 2016, Decaulne et al. 2016). 212
The farm Þrasastaðir, the innermost inhabited farm in the Stífludalur valley, is situated on 213
the northern side of the Stífludalur on the northern side of the Fljótaá River facing the 214
Móafellshyrna mountain. The residents of the farm witnessed and observed the slide 215
(Fig. 3) and their report is given in Section 4.1. 216
The landscape in the Fljótin area is predominantly carved by glacial erosion. The area 217
was heavily glaciated during the maximum extent of the last glaciation, but the 218
deglaciation history of the area is not well documented. Researchers suggest that the 219
area was deglaciated in Early Preboreal times (e.g., Norðdahl and Pétursson, 2005; 220
Norðdahl et al., 2008; Ingólfsson et al., 2010; Coquin et al. 2016). The upper part of the 221
valley sides (up to 600-900 m a.s.l.) are often very steep, with fractured and loose 222
bedrock produced by, erosion during deglaciation, unloading by the glacier, frost 223
shattering and freeze-thaw processes, while the lower parts are more gentle and 224
generally covered by glacial deposits or talus. 225
10 226
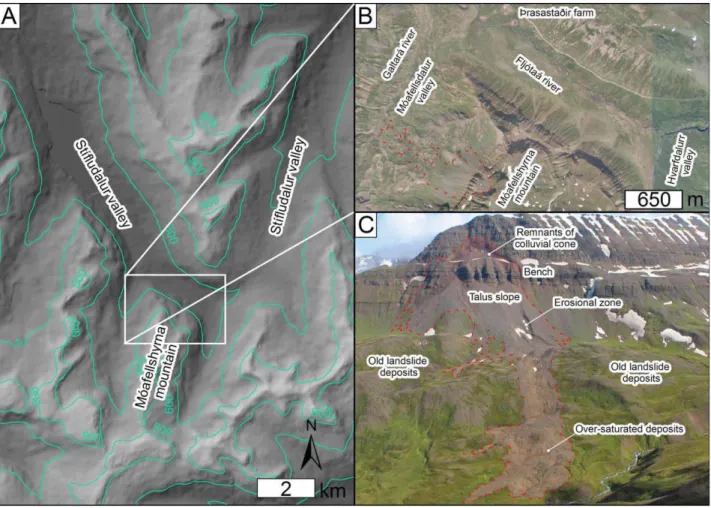
Figure 3 – Geographical setting of Móafellshyrna mountain (see Fig. 1 for location). (A) Hillshaded digital
227
elevation model and contours (in green, metres above sea level) of the Móafellshyrna region. Elevation
228
data are from EU-DEM from GMES RDA. (B) Aerial photograph of the Móafellshyrna site taken before the
229
slide in 2012 from the website Samsyn. (C) Oblique photo of the Móafellshyrna debris slide in July 2015
230
taken by Costanza Morino. In panels B and C the perimeter of the slide is marked with red dashed line
231
taken from the trimble data for the deposits and reconstructed from photographs for the upper part, in C
232
this line has been manually traced onto the oblique image.
233 234
3. Methods
235
The triggering factors of the Móafellshyrna debris slide event in September 2012 were 236
analysed using meteorological data from the Icelandic Meteorological Office (IMO) for the 237
three months prior to the slide and for the period 2010-2012. Data for the seismic activity 238
of the north coast were also obtained from the IMO. We also interviewed the inhabitants 239
of the valley and performed our own field investigations. 240
3.1 Meteorological data
241
Only two weather stations in the northern part of the Tröllaskagi peninsula measure 242
precipitation, one located in the town of Siglufjörður at 6 m a.s.l. (35 km north of the site) 243
11
and the other one in the town of Ólafsfjörður at 5 m a.s.l. (21 km northeast of the site). 244
Three weather-stations were used for this study that collect temperature records: two 245
operated by IMO - Siglufjörður (WMO (World Meteorological Organization) ID: 4157), 246
Ólafsfjörður (WMO ID: 4155) and one station located at the Öxnadalsheiði highlands 247
pass (WMO ID: 4859) at 540 m a.s.l. operated by the Icelandic Road and Coastal 248
Administration (Fig. 1). A problem in our approach is that the majority of the stations used 249
to establish mean atmospheric temperatures are located near the coast and therefore at 250
low altitudes. This leads to a potential bias when evaluating trends in temperature, 251
because such stations may not be representative of the atmospheric temperatures 252
experienced in the highlands. To overcome this, we applied the environmental lapse rate 253
of 0.649°C per 100 m (Sheridan et al. 2010) to the mean temperatures recorded at all 254
three stations as an estimate of the temperature at the source zone of the Móafellshyrna 255
debris slide. We do not attempt to correct the precipitation data collected near the coast 256
for the inland conditions, because this would not only require a temperature correction, 257
but we would need to take into account variations in wind speed, wind direction and 258
pressure in a meteorological model, which is beyond the scope of this paper. 259
3.2 Direct report from witnesses
260
The local residents of the farm Þrasastaðir witnessed the release of the landslide, and 261
were interviewed on the day of the event regarding the earthquake activity prior to the 262
slide, timing of the slide and the events that occurred during the first few hours of the 263
slide. The slide was photographed by the first author only a few hours after it had 264
occurred. Ongoing rockfall activity on the slope prohibited more detailed observations 265
immediately after the event. It was not considered safe to perform field analysis until 29th 266
September 2012, when direct observations and measurements were made. The site was 267
revisited in summer 2015 to track changes in the slide. 268
3.3 Field measurements and survey
269
The boundary of the landslide body was mapped on the 29th June 2012 with Trimble 270
GEOXT from the GeoExplorer CE series with an accuracy of 1-2 m. Thickness 271
measurements of the slide were performed both with direct measurements in the field on 272
29th September 2012 and from aerial photographs and erosional and depositional 273
features mapped. For geomorphological mapping both ground photographs and aerial 274
photographs from the National Land Survey of Iceland (www.lmi.is) and Loftmyndir ehf 275
(www.map.is) and the UK’s Natural Environment Research Council Airborne Research 276
12
and Survey Facility (NERC ARSF) flown in 2015 were used in concert with field 277
observations. Landslide volume estimates were derived from morphometric properties of 278
the deposits measured directly in the field and from aerial photographs. 279
4. Results
280 281 4.1 Witness report 282The residents of the Þrasastaðir farm, located at the junction between the Móafellsdalur 283
and the Stífludalur valleys and 1.7 km from the terminal deposits of the landslide (Fig. 3), 284
were interviewed only few hours after the slide. They recounted that on the 20th of 285
September 2012 at around 12:30 they heard a rumbling noise, which originated from the 286
Móafellshyrna mountain. They also recounted that a black tension crack, in the snow 287
covered mountain, progressively formed above the colluvial cone at around 850 m a.s.l. 288
They saw large blocks of debris that broke off the frontal part of the cone and fell onto the 289
talus slope below. This activity was most intense in the first 1-1.5 hours, but they reported 290
that there were intermittent noises and rock fall activity throughout the day. 291
The residents of the Þrasastaðir farm felt all the three earthquakes that occurred on the 292
19th and 20th September, with the last one only three hours before the debris slide event. 293
It was estimated that less than 1 m of snow was on the ground at the time of the slide. 294
4.2. The debris slide morphology
295
The debris slide detached from a main scarp at an elevation of 880 m a.s.l. (Fig. 4A). The 296
source material of the landslide was a colluvial cone composed of talus deposits perched 297
on a topographic bench at 790 m a.s.l. (Fig. 3C), and lying against a rockwall composed 298
of lava and tephra layers of the Tertiary Basalt formation dipping less than 10° towards 299
SSW. The colluvial material comprises a mixture of materials derived from the above 300
rockwall (basalt with intercalated sediment layers) and under nominal conditions (with or 301
without ice) should lie stable against the rockwall under the angle of repose. 302
The colluvial material partially slid off the steep rockwall ledge at the edge of the bench, 303
as described by the local residents. From field observations and aerial photographs we 304
estimate that the horizontal displacement in the upper part of the cone was around 40 m 305
(Fig. 4A). Later observations revealed that the bedrock was exposed from beneath the 306
colluvium as it slid (at the time of the slide it was hidden by a thin veneer of mud, which 307
was later cleaned by rainfall). Part of the colluvial deposits remained perched on the 308
13
topographic bench after the event (Fig. 3C, 4B). Based on field observation, we 309
estimated that the thickness of the frontal part of the still ice-cemented colluvial cone that 310
was preserved at the edge of the bench after the slide was around 20-30 m thick (Fig. 311
4B). As the colluvial cone slid off the rockwall edge, large blocks of ice-cemented debris 312
broke off and fell onto the talus slope located below the topographic bench (Fig. 3C). Fig. 313
3B shows decametre-scale blocks of ice cemented colluvium that have remained on the 314
bench. A 300 m long, 80-100 m wide and 8-10 m deep channel was carved into the talus 315
slope deposits (Fig. 3C, 4C), entraining further material to the landslide. This channel 316
shows that the landslide materials must already have been fluidised (saturated) in order 317
to scour out this channel. 318
At 495-505 m a.s.l. at the foot of the talus slope, we observed that both loose muddy 319
debris and blocks of ice-cemented deposits comprised the landslide deposits (Figs. 320
4C,D,E). We infer that these ice cemented blocks had fallen from the topographic bench, 321
as they had the same aspect and size of those still perched in the source area (Fig. 4B). 322
These blocks ranged from less than 1 m up to 12 m wide and from less than 1 m up to 10 323
m tall. The ice-cemented blocks were composed of layers of sand to boulder-size (up to 324
50 cm in long-axis) angular rock fragments (Fig. 4F), interbedded with layers composed 325
of clay to sand-size materials. The red colour of the horizons of fine material (Fig. 4E) 326
derives from the original source material, namely paleo-soils interbedded in the lava 327
layers composing the Tertiary Basalt Formation. Nine days after the failure, from visual 328
inspections we estimated a content of ground ice that was cementing the blocks of 329
around 15-20% of the total volume (Fig. 4F), i.e. pore-filling ice, rather than excess ice. 330
No massive ice deposits were observed. 331
14 332
15
Figure 4 – (A) An overview of the western side of the Móafellshyrna Mountain after the debris slide. The
333
uppermost and lowermost elevation limits of the debris slide path are labelled in m a.s.l. as are the
334
locations of panels B to G. (B) The ice-cemented blocks perched, up to 20 m in thickness on the 100 m
335
high rockwall. (C) The erosional area in the lower talus slope below the rockwall. Note the large block of
336
ice-cemented deposits on the right. (D) Landslide debris and an ice-cemented block resting at 495-505 m
337
a.s.l. (E) The same large block of ice-cemented deposits as in D, around 12 m wide and 4 m high. (F)
338
Close up of the block in E showing stratified deposits of coarse angular clasts with an icy matrix. (G)
339
Looking downwards onto the deposits in the terminal part of the slide. Photos: Þ. Sæmundsson, A taken on
340
the 20th September and B-G taken on the 29th September 2012.
341
Some of the landslide deposits came to rest below the talus slope at 495-505 m a.s.l. 342
(Fig. 4D), where the average slope angle is less than 10°, but the rest traversed down the 343
mountain slope, finally stopping at 330 m elevation (Fig. 4G), a few meters from the river 344
Galtará draining the bottom of the valley (Fig. 3). The part of the material that continued 345
down the mountain side is composed of clay to boulder-size material which followed a 346
well-defined path with distinct lateral boundaries. The deposit boundaries are upstanding 347
with 1-2 m of relief. The lack of sorting in the deposits, their lobate planform and their 348
upstanding boundaries are consistent with this landslide being classed as a debris side 349
transforming to a debris avalanche from the Hungr et al. (2001, 2014) classification, i.e. 350
loose debris fluidised by the inclusion of water exceeding the pore-space (Iverson 1997) 351
without a well-defined central channel and generally shallow motion. This shows that 352
water volumes of 20-40% of the final deposits were required to mobilise this flow and that 353
it was not a dry rock avalanche. 354
Based on aerial photographs the dimensions of the upper colluvial cone perched on the 355
bench was around 80 m in height and around 150 m wide at the lower end prior to the 356
slide. Based on photographs taken after the slide the total movement of the cone was 357
estimated around 40 m and the frontal part of the cone perched on the bench was 150 m 358
wide and about 20-30 m thick (Fig. 4B). Based on these dimensions we estimated that 359
the volume of the deposits that broke off the frontal part of the cone and fell down onto 360
the lower talus had a volume up to ~120 000 – 180 000 m3
. From the dimensions of the 361
channel carved into the lower talus on the southern side of the slide (with 80-100 m, 362
depth 8-10 m, length 300 m) (Fig. 4C) we calculated that an additional volume of ~192 363
000 - 300 000 m3 of material was mobilized. Combining these volumes gives an estimate 364
of the total volume of material mobilized in the event of 312 000 - 480 000 m3. From GPS 365
measurements the areal extent of the landslide is ~0.3 km2, giving an average depth of 366
16
deposits of 1-2 m, consistent with our direct observations of thickness at the deposit-367 boundaries. 368 4.3 Antecedent conditions 369 4 4.3.1 Precipitation 370
The spring and summer months preceding the Móafellshyrna event were dry, and the 371
autumn was unusually wet (Figs. 5, 6) (Jónsson 2013). From April until 28th August 2012, 372
dry conditions prevailed in the outer part of the Tröllaskagi peninsula, with only one day 373
with precipitation greater than 10 mm: 23rd to 24th July, when 70 to 90 mm of rain was 374
recorded at Siglufjörður and Ólafsfjörður weather stations (Fig. 7). 375
From 20th August to 20th September around 1/3 of the precipitation for 2012 fell in the 376
area (~400-550 mm). For comparison, the average annual precipitation in the town of 377
Ólafsfjörður is ~400 mm for the period 2000-2012 (Figs. 5 & 6). In detail, from 28th August 378
to 8th September the cumulative precipitation in Siglufjörður was 190 mm and 120 mm in 379
Ólafsfjörður, with an additional 30 to 40 mm precipitation at these stations on the 3rd, 6th 380
and 7th September. From 9th to 11th September an unseasonal and severe snowstorm hit 381
the north eastern and northern parts of the country (Jónsson 2013, Hermannsdóttir 382
2012). Following this snowfall, around 100 mm rain was measured in only two days at 383
Siglufjörður and almost 150 mm at Ólafsfjörður. The precipitation continued from 11th to 384
17th September either as snow, sleet or rain at these weather stations. From September 385
17th to 19th less than 10 mm of precipitation was recorded, but at the time of the event 386
540 mm precipitation had been recorded in Siglufjörður and 490 mm at Ólafsfjörður 387
weather stations since 23rd July, which corresponds to 40-45% of the mean annual 388
precipitation from 2000-2012 (Fig. 5). The monthly precipitation data from Ólafsfjörður 389
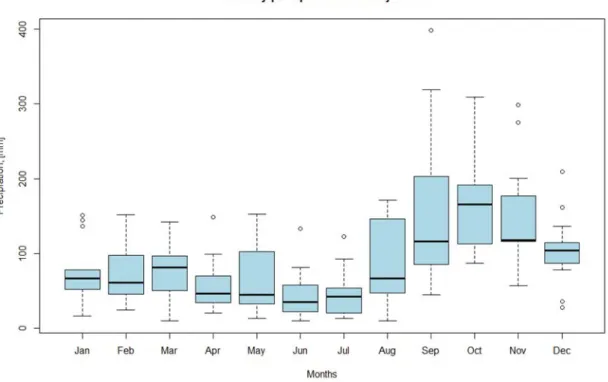
station from 2000 to 2012 show that September is the month with maximum precipitation 390
for any given year, with a range between 70 and 250 mm (Figs. 5 & 6). The year of 2012, 391
however, had precipitation exceeding the average for this month (Fig. 5) 392
Unfortunately, there is no weather station located in the mountainous region of 393
Tröllaskagi area and as previously mentioned there is no weather station in Fljótin area. 394
This means that we cannot report absolute precipitation data for the Móafellshyrna site, 395
but it is reasonable to assume that on a month by month basis the trends should be 396
similar to those of surrounding weather stations. Predicting whether precipitation falls as 397
snow or rain at Móafellshyrna is outside the scope of this study and is complicated by a 398
17
number of factors including snow drifting, wind-dependant snowmelt and variable 399
orographic effects dependant on wind direction (Brynjólfsson and Ólafsson 2008) – see 400
Section 1.3. Snow was visible on the ground on the day of the slide and was less than 401
1m thick from eye witness accounts (equivalent to ~100 mm of precipitation, depending 402
on snow density) Therefore, the majority of the precipitation received up to 20th 403
September had been absorbed by the ground. The fact that snow was present on the 404
ground argues against a sudden influx of water into the ground via snowmelt, known to 405
trigger other mass wasting phenomena in Iceland (e.g. Decaulne et al. 2005). Hence, we 406
did not pursue an analysis of the wind data from the weather stations, because this would 407
only be important if melt or precipitation were the primary triggers for the slide. 408
18 410
411
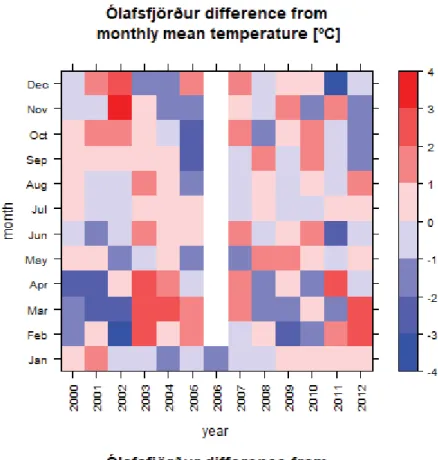
Figure 5 – Matrix plots of the difference between the average monthly temperature (top) 412
and precipitation (bottom) and the average value for that month for the period 2000-2012 413
for the Ólafsfjörður station (Data supplied by the IMO in 2016). 414
19 415
Figure 6 – A boxplot of the precipitation data from the Ólafsfjörður station for each month between the
416
years 2000 to 2012 (Data from IMO 2016). The end of the dotted lines is where the max and min values of
417
precipitation were measured for each month, excluding the outliers that are displayed as dots. The blue
418
boxes is where the 50% of accumulated measured precipitation falls and the black lines are the medians of
419
each month.
20 date te m per at ur e ( ºC ) 0 5 10 15 20
Jul 15 Aug 01 Aug 15 Sep 01 Sep 15
OXAN 0 5 10 15 20 SIFJO 0 5 10 15 20 OLFJO date p re c ip it a ti o n (mm)
Jul 15 Aug 01 Aug 15 Sep 01 Sep 15
20 40 60 80 100 0 200 400 600 SIFJO 20 40 60 80 100 0 200 400 600 OLFJO c u mu la ti v e p re c ip it a ti o n (mm) -5 5 1 5 Adjusted Tempertures date te m per at ur e ( ºC )
Jul 15 Aug 01 Aug 15 Sep 01 Sep15
21 422
22
Figure 7- Top: daily precipitation (black bars), cumulative precipitation (blue lines) for temperature
423
measurements from the Siglufjörður (SIFJO) and Ólafsfjörður (OLFJO) weather stations. Middle: daily
424
temperature data from the Siglufjörður (SIFJO), Ólafsfjörður (OLFJO) and Öxnadalsheiði (OXAN) weather
425
stations. Bottom: mean temperature data for all three stations adjusted to 880 m altitude of Móafellshyrna
426
(red=SIFJO, green= OXAN and blue=OLFJO). All data from 1st July to 30th September 2012 (Data
427
obtained from IMO in 2016).
428 429 430 4 4.3.2 Temperature 431
The temperature patterns in 2012 were also unusual, the summer and spring were 432
unusually warm on the whole, but the autumn was particularly cold (Fig. 5; Jónsson 433
2013). The average temperature measured in the town of Ólafsjörður was in 10.4°C July 434
and 10.9°C in August in 2012. The average temperatures for these months for the period 435
2000-2012 are 9.8°C and 9.6°C respectively. The average temperature for September 436
2012 was on the other hand 5.7°C compared to the average temperature of 7.2°C for 437
2000-2012. 438
The average daily air temperature from 6th to 20th September at the Siglufjörður and 439
Ólafsfjörður stations ranged from 3 to 6°C and at the Öxnadalsheiði weather station 440
fluctuated around zero, but lowered to approximately -3°C the night before the slide (Fig. 441
7). Our corrected temperature data indicate average daily temperatures of at the altitude 442
of the Móafellshyrna slide of around -1 to -2°C in the days preceding the slide and hence 443
night-time temperatures would have been even lower. During the evening of 19th 444
September, a drop below 0°C in the atmospheric temperature in the mountains was 445
measured in the Öxnadalsheiði weather station (Fig. 7). The snow on the ground at the 446
time of the Móafellshyrna debris slide shows that similar sub-freezing conditions also 447
prevailed at this altitude prior to the slide. These low temperatures combined with the 448
snow cover are strong evidence that sudden influx of water from precipitation was not the 449
trigger for the Móafellshyrna slide. 450
4.3.3 Earthquake sequence
451
In the Eyjafjarðaráll graben, three earthquakes with magnitudes M 4.2 to M 4.5 were 452
registered on 19th and 20th September (Gudmundsson et al., 2014). Their epicentres are 453
located 25-27 km north-northeast of the town of Siglufjörður, and 60 km north-northeast 454
of the Móafellshyrna site (Fig. 4). On the morning of 19th September, one day prior to the 455
23
slide, two earthquakes with magnitudes M 4.5 and M 4.3 occurred at 07:57 and 08:28 456
respectively. A number of smaller aftershocks continued to occur throughout the day 457
following these earthquakes. Another earthquake of magnitude M 4.2, occurred at 9:27 458
on the 20th September, approximately three hours prior to the first observations of the 459
Móafellshyrna slide (Fig. 4). 460
461
5. Discussion
462
The Móafellshyrna debris slide is a rare example of a gravitational mass movement 463
where three triggering factors may have contributed to the failure of the slope: heavy 464
precipitation, earthquake activity and ground ice degradation (via rising average surface 465
temperatures). We infer that precipitation was the main preparatory factor for this debris 466
slide for the following reasons. Heavy prolonged precipitation was recorded across the 467
area, where nearly half of the usual annual precipitation fell in less than one month (Fig. 468
5). Many case studies have shown that high magnitude water input, either by rainfall 469
(Rapp and Nyberg 1981) or snowmelt (Decaulne et al. 2007), leads to oversaturation of 470
soil directly triggering debris flows and shallow landslides. These studies also point out 471
the role of intense rainfall as a preparatory (rather than direct trigger) factor to failure (e.g. 472
Rapp, 1964, 1985 and 1995; Johnson and Rahn, 1970; Johnson and Rodine, 1984; 473
Rapp and Nyberg, 1981; Addisson, 1987; Innes, 1989; Luckman, 1992; Becht, 1995; 474
Cannon and Reneau, 2000; Sæmundsson et al., 2003, Decaulne et al 2007, 475
Sæmundsson and Decaulne 2007, Guzzetti et al. 2007). However, the role of water 476
infiltration in triggering of shallow landslides and debris flow in permafrost areas is rarely 477
well documented (Harris and Gustafsson, 1993). We do not favour sudden water input as 478
a direct trigger of the Móafellshyrna debris slide, because snow was present on the 479
ground at the time of the failure. However, we think this is a necessary pre-condition for 480
the failure to occur. 481
The direct influence of the seismic activity and associated ground acceleration on the 482
motion of the debris in the source area seems unlikely, as the event did not occur 483
immediately following any seismic event. Earthquakes are a common triggering factor for 484
landslide activity and are considered as a major cause for landslides worldwide (e.g. 485
Keefer, 1984, 1994, 2002, Malamund et al. 2004). Yet, no other debris flow or rockfall 486
activity was reported on the northern part of the Tröllaskagi area on 19th or 20th 487
24
September, which might be expected if ground acceleration were sufficient to trigger 488
mass movement. However, the short time interval (3hrs) between the last earthquake 489
and the failure indicates a possible connection between the slide and the seismic events. 490
Selby (1993) argued that “stability of the slope, orientation of the earthquake in relation to 491
the slide mass, earthquake magnitude, focal depth, seismic attenuation and after-shock 492
distribution” are factors that determine whether earthquakes trigger landslides. According 493
to Keefer (1984), the maximum area likely to be affected by landslides in a seismic event 494
increases from approximately 0 km2 at M=4.0 up to 500.000 km2 at M=9.2. According to 495
Malamund et al. (2004) the lowest earthquake-magnitude is M 4.3 +/-0.4. for triggering 496
gravitational mass movements. Tatard et al. (2010) state that earthquakes of M4 and 497
lower have little or no influence on landslide triggering. Nevertheless, several studies 498
(e.g., Sassa et al., 2007, Walter and Joswig, 2008) mention that small earthquakes 499
(maximum M 3.6 in southern Italy according to Del Gaudio et al., 2000) and repeated 500
shocks can influence hydrogeological settings and can possibly cause landslides, 501
sometimes with delay between the earthquake and the mass movement. Jibson et al. 502
(1994) also discuss delayed landslide movements, from larger earthquakes (M 7.0), and 503
state that the simplest explanation for the delay is a change in the ground-water 504
conditions. Based on the above mentioned studies, it is unlikely that an earthquake of M 505
4.3 was the only triggering factor for the Móafellshyrna debris slide, having taken place 506
60 km away from the epicentre. On the other hand, since the Móafellshyrna slide 507
occurred only three hours after a seismic event, the seismic sequence is likely playing 508
some indirect role. 509
The ground water flow system of the colluvial cone composing the source material of the 510
Móafellshyrna landslide is expected to be very limited. This is due to several factors: i) 511
the catchment area above the source area is not very large (around 350 m long); ii) the 512
colluvial cone is confined uphill by a vertical rockwall, and downhill by the edge of the 513
topographic bench; iii) the presence of ground ice cementing the deposits; iv) the sub-514
horizontal dipping of the bedrock layers where the deposits are perched. However, it has 515
been shown that talus slopes can contain multiple and distinct groundwater flow systems 516
beneath or within them, and that they have a rapid and localised response to precipitation 517
and melt inputs (Roy and Hayashi, 2009; McClymont et al., 2010). One component of the 518
groundwater flow in the colluvial cone of Móafellshyrna may originate in the pervasive 519
system of sub-horizontal and sub-vertical discontinuities affecting the bedrock. If a 520
25
groundwater system was present before the failure, the response of the water table 521
should be rapid. Since seismic activity can release water by coseismic liquefaction or 522
consolidation of loose sediments (e.g., Manga et al., 2003; Montgomery et al., 2003), a 523
change in the hydrogeological equilibrium of the colluvial cone caused by seismic activity 524
could have contributed to the occurrence of the failure. 525
Field evidence from the Móafellshyrna debris slide strongly suggests the involvement of 526
ground ice thaw in triggering the event. Because the month of the event had 527
temperatures lower than average and the days prior to the event were mostly below zero 528
Celsius (as evidenced by snow on the ground), we do not think thaw water from the 529
ground ice in the perched talus contributed significantly to the event. However, longer 530
term, deeper thawing caused by an annual rise in temperature and therefore a shift in the 531
permafrost table, including an anomalously warm preceding summer, we believe is a 532
more likely contributor. In recent years, there has been an increasing interest worldwide 533
in the influence of climate warming and associated decline of mountain permafrost on the 534
occurrence of mass wasting phenomena (e.g., Rebetez et al., 1997; Gruber et al. 2004; 535
Gruber and Haeberli, 2007; Fischer et al., 2006; Sattler et al., 2011; Stoffel and Huggel, 536
2012; Damm and Felderer, 2013; Stoffel et al., 2014). The increasing frequency of rapid 537
mass movements, such as debris flows, debris slides, rock falls and rock avalanches, in 538
mountainous areas have been linked in several cases with mountain permafrost 539
degradation (e.g., Clague et al., 2012; Wirz et al., 2013; Barboux et al., 2015; Darrow et 540
al., 2015; Haeberli et al., 2016). Loss of ice-cementation, the presence of segregated ice,
541
increased hydrostatic pressure and the associated reduction of shear strength can all 542
lead to reduction of stability with increasing atmospheric temperature via permafrost 543
degradation (e.g., Gruber and Haeberli, 2007; Krautblatter et al., 2013; Pogliotti et al., 544
2015). Although, these previous studies have focused on the stability of massive rock 545
masses, a similar (perhaps exaggerated) effect might be expected in ice cemented talus. 546
The increase of mean annual temperature, which has been observed in Iceland over the 547
last few decades (Björnsson et al. 2008), should be leading to degradation of 548
discontinuous permafrost in Iceland, which is thought to be present in the Tröllaskagi 549
peninsula (Etzelmüller et al., 2007a). Our observations of the ice-cemented deposits 550
shows that the Móafellshyrna slide originated from deposits containing pore-filling ground 551
ice and equally that these deposits were still frozen at the time of the slide. Together 552
these argue for a permafrost origin for this ground ice. The increasing average 553
26
temperatures over the last decades (Björnsson et al. 2008, Jónsson 2013) before the 554
event may have initiated the degradation of ground ice in the talus cone where the slide 555
initiated, but not from the top-down, but from the base-up. This thawing may have: i) 556
lubricated of the base of the cemented colluvial cone, ii) lowered the effective friction 557
angle (cohesion), and hence iii) caused the slow movement of the colluvial cone perched 558
on the bench and the sliding along a detachment surface of the whole ice-cemented 559
mass. The warming of the rock mass onto which the colluvial deposit was previously 560
cemented could have been brought about by a combination of propagation of the thermal 561
wave through the rock mass from the warmer southeast-facing side (e.g., Noetzli et al.
562
2007) and the delivery of warmer liquid water (derived from the intense precipitation) to 563
the talus-rock interface from the south-westward dipping strata. Hence, the rupture 564
occurred beneath the permafrost table. Perhaps the ice-cemented colluvium was in effect 565
forming an underground “ice dam” that was holding back water saturated debris until its 566
own weight and the seismic shaking caused it to fail. However, we cannot substantiate 567
this link with certainty as we lack direct temperature measurements in the talus cone. Our 568
hypothesis is supported by the slow widening of the tension crack at the top of the source 569
area as observed by the eye-witnesses and the fact that the landslide was fluidised (a 570
water content higher than expected for such a small catchment) even as it fell down the 571
talus slope (causing the channelized erosion). 572
Ice-cemented deposits have been observed in two other landslides in Iceland, e.g. on the 573
Torfufell mountain (source area at ~750 m a.s.l.) and the Árnesfjall Mountain (source 574
area at ~350 m a.s.l.). These further events provide additional evidence to support our 575
hypothesis that the lower limit of permafrost degradation extents to lower altitudes. The 576
source zones for the Móafellshyrna and the Torfufell slides are at the lower elevation limit 577
of discontinuous mountain permafrost in northern Iceland (i.e., 840 m a.s.l.; Etzelmüller et 578
al., 2007a). On the other hand, the source zone of the slide in the Árnesfjall Mountain is
579
at an unexpected much lower elevation, which shows that the knowledge of mountain 580
permafrost in Iceland is incomplete. The setting of talus perched on benches is not a rare 581
situation in Iceland because of the sub-horizontal basalt layers create topographic 582
benches on which loose material can accumulate. Hence investigating whether those 583
with permafrost conditions, particularly above inhabited areas, contain ground ice and 584
establishing its condition, should be a priority. 585
27
6. Conclusions
586
The debris slide in the Móafellshyrna Mountain began with a slow movement of a 587
perched colluvial cone, as described by the local residents of Þrasastaðir. This colluvium 588
is composed of stratified ice-cemented deposits at 840 m elevation and large blocks and 589
boulders broke off the frontal part of the cone and fell onto the talus slope below. The 590
mass movement transformed into a rapid debris slide, travelling down the mountainside 591
with the final deposits coming to rest at 330 m a.s.l. The total volume of the slide is 592
estimated to be around 312 000 – 480 000 m3
(including the initial mass and mass added 593
via bulking), covering an area of 0.3 km2. 594
We suggest that heavy precipitation prior to the slide was the main preparatory factor, 595
with over 400 mm of precipitation recorded in one month prior to the event after an 596
unusually dry summer season. The influence of seismic activity is unclear, but the close 597
temporal association between the last earthquake series and the failure suggests that the 598
shaking could have pre-conditioned the landslide weakening the cohesion between the 599
ice-cemented colluvium and the bedrock and/or changing of the hydrology. The presence 600
of ice-cementing the source colluvium at 880 m confirms the presence of discontinuous 601
mountain permafrost at that elevation. We suggest that the partial thaw of these deposits 602
was a trigger for the failure for three reasons: i) the landslide followed an usually warm 603
spring and summer, ii) mean annual air temperatures are generally increasing in Iceland 604
and iii) the colluvial cone initially slid as a single cohesive mass suggesting basal 605
lubrication/melting. The fact that two other recent landslides contain similar ice cemented 606
deposits suggests that mountain permafrost degradation could be more prevalent in 607
triggering landslides jn Iceland than has previously been thought. 608
The ice-cemented deposits within the slides of the Móafellshyrna, Torfufell and Árnesfjall 609
Mountains have highlighted the need for a more detailed understanding of the distribution 610
and condition of mountain permafrost within perched talus deposits in Iceland. Future 611
studies should focus on the relationship between rapid mass wasting processes and the 612
degradation of mountain permafrost in such deposits Iceland. These three landslides 613
occurred in uninhabited areas, but future similar landslides might not, and therefore they 614
could pose a potential hazard to society and infrastructure in the island. 615
616
Acknowledgements
28
This work would not have been possible without a postgraduate studentship grant from 618
the CENTA Doctoral Training Partnership funded by the U.K. Natural Environment 619
Research Council (NERC) and the British Geological Survey University Funding Initiative. 620
Aerial photos used in this research are courtesy of NERC Airborne Research and Survey 621
Facility via the European Facility for Airborne Research (EuFAR), projects HidHaz and 622
EUFAR15_48. Especially we would like to thank Íris Jónsdóttir and Jón Elvar Númason 623
residents at the Þrasastaðir farm for their valuable information and detailed description of 624
the behaviour of the slide and all their hospitality and help at the site. Thanks to Gestur 625
Hansson, a snow observer in Siglufjörður, for providing us with photos and assisting us at 626 the site. 627 628
References
629Addisson, K. 1987: Debris flow during intense rainfall in Snowdonia, North Wales: a
630
preliminary survey. Earth Surface Processes and Landforms 12, 561-566.
631
Ágústsson, K. & Pétursson, H.G. 2013: Skriður og grjóthrun. In: Sólnes, J. (ed).
632
Náttúruvá á Íslandi, eldgos og jarðskjálftar. Háskólaútgáfan. pp. 639-645. (in
633
Icelandic).
634
Allen, R.G. Nolet, Morgan, W.J., Vogfjörð, K.S., Netles, M., Ekström, G., Bergsson, B.H.,
635
Erlendsson, P., Foulger, G., Jakobsdóttir, S.S., Julian, B., Pritchard, M., Ragnarsson,
636
S. & Stefánsson, R. 2002: Plume driven plumbing and crustal formation in Iceland. J.
637
Geophys. Res. 107(B8), doi:10.1029/2001JB000584
638
Arnalds, Þ., Sauermoser, S., Jóhannesson, T., Grímsdóttir, T. 2001: Hazard zoning for
639
Siglufjörður – Technical report. Icelandic Meteorological Office, Report 01020.
VÍ-640
ÚR11. 68 pp. Reykjavík.
641
Barboux, C., Strozzi, T., Delaloye, R., Wegmüller, U., & Collet, C. 2015: Mapping slope
642
movements in Alpine environments using TerraSAR-X interferometric methods. ISPRS
643
Journal of Photogrammetry and Remote Sensing, 109, 178-192.
644
Becht, M. 1995: Slope erosion processes in the Alps. In: O: Slaymaker (ed.): Steepland
645
Geomorphology, 54-61.
646
Bjarnason, I. Th. 2008: An Iceland hotspot saga. Jökull 58, 3-16.
647
Björnsson, H., Sveinbjörnsdóttir, Á.E., Daníelsdóttir, A.K., Snorrason, Á., Sigurðsson,
648
B.D., Sveinbjörnsson, E., Viggósson, G., Sigurjónsson, J., Baldursson, S.,
649
Þorvaldsdóttir, S. & Jónsson, T. 2008: Hnattrænar loftslagsbreytingar og áhrif þeirra á
650
Íslandi – Skýrsla vísindanefndar um loftslagsbreytingar. (e. Global warming and it´s
651
effect on Iceland). Umhverfisráðuneytið. (in Icelandic).
652
Brynjólfsson, S. & Ólafsson, H. 2008: Precipitation in the Svarfadardalur region,
North-653
Iceland. Meteorology and Atmospheric Physics 103: 57-66.
654
Clague, J.J., Huggel, C., Korup, O. & McGuire, B. 2012: Climate change and hazardous
655
processes in high mountains. Revista de la Asociación Geológica Argentina, 69(3), pp.
656
328-338.
29
Coquin, J., Mercier, D., Bourgeois, O., Cossart, E. & Decaulne, A., 2015: Gravitational
658
spreading of mountain ridges coeval with Late Weichselian deglaciation: impact on
659
glacial landscapes in Tröllaskagi, northern Iceland. Quaternary Science Reviews 107.
660
197-213.
661
Coquin, J., Mercier, D., Bourgeois, O., Feuillet, T. & Decaulne, A. 2016: Is gravitational
662
spreading a precursor for the Stífluhólar landslide (Skagafjörður, Northern Iceland)?
663
Géomorphologie: Relief, Processus, Environment. Vol. 22, no 1, p. 9-24.
664
Crochet, P., Jóhannesson, T., Jónsson, T., Sigurdsson, O., Björnsson, H., Pálsson, F. &
665
Barstad, I. 2007: Estimating the spatial distribution of precipitation in Iceland using a
666
linear model of orographic precipitation. Journal of Hydrometereology, 8(6): 18
1285-667
1306.
668
Damm, B. & Felderer, A. 2013: Impact of atmospheric warming on periglacial degradation
669
and debris flow initiation – a case study from the eastern European Alps. Quaternary
670
Science Journal. Vol. 62, (2), 136-148.
671
Darrow, M.M., Gyswyt, N.L., Simpson, J.M., Daanen, R.P. & Hubbard, T.D. 2016: Frozen
672
debris lobe morphology and movement: an overview of eight dynamic features,
673
southern Brooks Range, Alaska. The Cryosphere, 10(3), p.977.
674
Decaulne, A. 2005: Slope processes and related risk appearance within the Icelandic
675
Westfjords during the twentieth century. Nat. Hazards Earth Syst. Sci., 5, 309-318.
676
Decaulne, A. 2007: Snow-avalanche and debris-flow hazards in the fjords of
north-677
western Iceland, mitigation and prevention. Natural Hazards, 41(1), 81-98.
678
Decaulne, A., Sæmundsson, Þ. & Pétursson, O. 2005: Debris flow triggered by rapid
679
snowmelt: A case study in the Gleiðarhjalli area, Northwestern Iceland. Geografiska
680
Annaler. 87 A(4): 487-500.
681
Decaulne, A. & Sæmundsson, Þ. 2007: Spatial and temporal diversity for debris-flow
682
meteorological control in subarctic oceanic periglacial environments in Iceland. Earth
683
Surface Processes and Landforms. 32(13), 1971–1983.
684
Decaulne, A., Cossart E., Mercier, D., Feuillet, T., Coquin. J. & Jónsson, H.P. 2016: An
685
early Holocene age for the Vatn landslide (Skagafjörður, central northern Iceland):
686
Insights into the role of postglacial landsliding on slope development. The Holocene.
687
Vol. 26(8) 1304–1318.
688
Del Gaudio, V., Trizzino, R., Calcagnile, G., Calvaruso, A. & Pierri, P. 2000: Landsliding
689
in seismic areas: The case of the AcquaraǦVadoncello landslide (southern Italy), Bull.
690
Eng. Geol. Environ., 59(1), 23–37.
691
Einarsson, M. A. 1984: Climate in Iceland. In: H.van.Loon (ed), World survey of
692
climatology, 15, climate of the oceans: 673-697. Amsterdam, Elsevier.
693
Einarsson, P. 2008: Plate boundaries, rifts and transforms in Iceland. Jökull 58. 35-58.
694
Einarsson, P. and Björnsson, S. 1979: Earthquakes in Iceland. Jökull, 29. 37-46.
695
Etzelmüller, B., Farbrot, H., Guðmundsson, Á., Humlum, O., Tveito, O.E. & Björnsson, H.
696
2007a: The regional distribution of mountain permafrost in Iceland. Permafrost and
697
periglacial processes, 18: 185-1999.
698
Etzelmüller, B., Schuler, T.V., Farbrot, H. & Gudmundsson, A. 2007b: Permafrost in
699
Iceland: Thermal state and climate change impact. American Geophysical Union, Fall
700
Meeting 2007, abstract #C31A-02.
30
Farbrot, H., Etzelmüller, B., Gudmundsson, A., Humlum, O., Kellerer-Pirklbauer, A.,
702
Eiken, T. & Wangensteen. B. 2007a: Rock glaciers and permafrost in Trollaskagi,
703
northern Iceland. Zeitschrift Fur Geomorphologie 51: 1–16.
704
Farbrot, H., Etzelmüller, B., Schuler, T.V., Gudmundsson, A., Eiken, T., Humlum, O. &
705
Björnsson, H. 2007b: Thermal characteristics and impact of climate change on
706
mountain permafrost in Iceland. Journal of Geophysical Research 112:
707
Fischer, L., Kaab, A., Huggel, C. & Noetzil, J. 2006: Geology, glacier retreat and
708
permafrost degradation as controlling factors of slope instabilities in a high mountain
709
rock wall: the Monte Rosa east face. Natural Hazards and Earth System Science, 6
710
(5), pp. 761-772.
711
Friedman, J.D., Johansson, C.E., Oskarsson, H., Svensson, H., Thorarinsson, S. &
712
Williams Jr., R.S. 1971: Observations on Icelandic polygon surfaces and palsa areas.
713
Photo interpretation and field studies. Geografiska Annaler A53, 115–145.
714
Gorbunov, A. P. 1988: The alpine permafrost zone of the USSR. In Proceedings, Fifth
715
International Conference on Permafrost, Vol. 1.
716
Gudmundsson, A. 2000: Dynamics of Volcanic Systems in Iceland: Example of
717
Tectonism and Volcanism at Juxtaposed Hot Spot and Mid-Ocean Ridge Systems.
718
Annual Review of Earth and Planetary Sciences. Vol. 28, 107–140.
719
Gudmundsson, A. 2006: Infrastructure and evolution of ocean-ridge discontinuities in
720
Iceland. Journal of Geodynamics, 43, 6-29.
721
Gudmundsson, G.B., Martin Hensch, Matthew Roberts and the SIL monitoring group
722
2014: The fall 2012 earthquake sequence in Eyjafjarðdaráll, western Húsavík-Flatey
723
Fault. International Workshop on Earthquakes in North Iceland, Húsavík, North
724
Iceland, 6-8 June 2013, pp.71-73.
725
Guzzetti, F., Peruccacci, S., Rossi, M. & Stark, C.P. 2007: Rainfall thresholds for the
726
initiation of landslides in central and southern Europe. Meteorology and Atmospheric
727
Physic, 98, 239–267. DOI 10.1007/s00703-007-0262-7
728
Gruber, S., Hoelzle, M. & Haeberli, W. 2004: Permafrost thaw and destabilization of
729
Alpine rock walls in the hot summer of 2003. Geophysical Research Letters, Vol. 31,
730
L13504, doi:10.1029/2004GL020051.
731
Gruber, S. & Haeberli, W. 2007: Permafrost in steep bedrock slopes and its
temperature-732
related destabilization following climate change. Journal of Geophysical Research.
733
Vol. 112, F02S18, doi:10.1029/2006JF000547.
734
Haeberli, W., Schaub, Y. & Huggel, C. 2016: Increasing risks related to landslides from
735
degrading permafrost into new lakes in de-glaciating mountain ranges.
736
Geomorphology, Vol.293 (B), 405-417.
737
Halldórsson, P. 1984: Skagafjarðarskjálftinn 1963. Veðurstofa Íslands, Reykjavík (in
738
Icelandic).
739
Harris, S.A. & Gustafsson, C.A. 1993: Debris flow characteristics in an area of continuous
740
permafrost, St Elias Range, Yukon Territory. Zeitschrift fur Geomorphologie NF 37,
41-741
56.
742
Harp, E.L. & Jibson, R.W. 1996: Landslides triggered by the 1994 Northridge, California,
743
earthquake. Bulletin of the Seismological Society of America 86.1B: S319-S332.