Development and Evaluation of Diversion Strategies
under Incident Response using Dynamic Traffic
Assignment System
by
Akhilendra Singh Chauhan
B.Tech. in Civil Engineering (2001) Indian Institute of Technology, Kanpur, India
Submitted to the Department of Civil and Environmental Engineering in partial fulfillment of the requirements for the degree of
Master of Science in Transportation
at the
MASSACHUSETTS INSTITUTE OF TECHNOLOGY
September 2003
0 Massachusetts Institute of Technology, 2003. All rights reserved.
A uthor ... ... Departmeniii4{ivil and Environmental Engineering
August 9, 2003
Certified by ...
Moshe E. Ben-Akiva Edmund K. Turner Professor of Civil and Environmental Engineering Thesis Supervisor
Certified by ...
Accepted by ...
Haris N. Koutsopoulos Associate Professor of Civil and Environmental Engineering Northeastern University Thesis Supervisor -a I I I MASSACHUSETTS INSTITUTCh OF TECHNOLOGY ... Heidi Nepf irman, Departmental Committee on Graduate Studies
Development and Evaluation of Diversion Strategies under
Incident Response using Dynamic Traffic Assignment System
by
Akhilendra Singh Chauhan
Submitted to the Department of Civil and Environmental Engineering on August 9, 2003, in partial fulfillment of the
requirements for the degree of
Master of Science in Transportation
Abstract
Integrating Intelligent Transportation Systems (ITS) technologies with traffic surveillance promises to reduce the cost incurred by non-recurrent traffic congestion by improving transportation agencies' ability to respond to and clear such incidents. Advance Traffic Management Systems (ATMS) and Advance Traffic Information Systems (ATIS) are examples of ITS sub-systems, which are increasingly becoming prevalent in the Traffic Management Center (TMC) of a city in order to address various traffic management issues. Dynamic Traffic Assignments (DTA) system can be used for dynamic traffic management purposes, like reducing delay on major highways, improving safety, efficiency and capacity of transportation network, and improving wide-area emergency responses through information sharing and coordination. DynaMIT-P is a DTA-based planning tool that operates in an offline mode, in which traffic managers investigate and prepare standard response strategies to different traffic and incident scenarios. The objective of this thesis is to apply DynaMIT's DTA capabilities to the Lower Westchester County (LWC) ITS subsystem and to use calibrated system to perform illustrative analyses of incident response strategies. First, DynaMIT-P has been calibrated in order to estimate traffic conditions in the LWC network with precision sufficient for ITS purposes. The results of two case studies, focusing on the evaluation of the diversion response strategy in case of an incident on the LWC network, illustrate the functionality
and potential of the system.
Thesis Supervisor: Moshe E. Ben-Akiva Title: Edmund K. Turner Professor
Department of Civil and Environmental Engineering
Thesis Supervisor: Haris N. Koutsopoulos
Title: Associate Professor of Civil and Environmental Engineering Northeastern University
Acknowledgements
I would like to express my deepest regards and thanks to Prof. Moshe E. Ben-Akiva and
Prof. Haris N. Koutsopoulos for their constant support and guidance. Their constant guidance has been invaluable to my research at MIT. In particular, I would like to thank Haris for his constructive comments in my research at ITS lab. I was always benefited from the many discussions I had with him. Working with him has provided me with a deep understanding of the simulation and transportation research. He is one of the few persons I respect the most in my life, for his vision, thinking and help.
I am grateful to Rama and Costas for their willingness to help at any hour and for
lending a patient ear to all my queries. These are the two people without whom this work would not have materialized. Rama was extremely helpful in order to understand nitty-gritty details of the DynaMIT. It was almost impossible without him to understand the various aspects of different models used in the DynaMIT. Costas was the other person who worked along with me on this project. I learnt a lot from him, especially about the DynaMIT software details. He was a like bridge between NYSDOT and me. His comments and discussions have helped me in clearing several obstacles along the way of this thesis.
My special thanks to Srini, Deepak and Kunal for their friendship, support and
help in shaping not only my research but my future career as well. Srini was very helpful
by giving his valuable comments on my thesis. He is the only person with whom I have
shared my good moments at the lab. He helped me a lot during my first year at the ITS lab. Whenever I wanted to take some time off, Deepak and Srini frequently invited me for dinner!!! During those dinner hours, I have shared many good moments away from the academia. I also wish to thank Rama (Bob), Dinu, Anshiv and other members of the gang at their home.
It is impossible to forget the moments I had with Miguel, Maya, Phani, Ale and Michael. Miguel and I have shared light moments during the evening coffee time at the food court. He is my best American friend, who helped to understand American slang and culture. Maya was always very supportive with my research and course work. Phani and I
hours and hours in discussing problem sets. No doubt, he is a great cook!! Ale and Mike always used to pass some light comments, which made life easy.
Other two best friends, I made at MIT, were the members of the TDS group!! Emmanuel, Saurabh and I had really good time and they have really lightened my academic and research load. I would not forget my great non-academic and academic moments with Nandu and Vimal, my roommates at MIT during the first year.
I am also grateful to my fellow people at the MIT ITS program for their help,
friendship and support. I thank Tomer for his comments and discussions and Marge for sharing lighter moments. I also like to thank Dan, Joe, Zhili, Bhanu, Emily and Charisma for making the lab a lively place to work. I would also like to express my thanks to all my friends at MIT and IIT.
I like to thank administrative staff at the Center of Transportation and Logistics (CTL), especially Leanne Russell for attending to all my requests promptly.
I thank most kindly Federal Highway Administration (FHWA) and New York
State Department of Transportation (NYSDOT) for their financial support.
Finally, I express my indebtedness to my parents, brothers and sisters for their love, encouragement and inspiration, which have given me strength on numerous occasions.
Contents
1 Introduction 17
1.1 B ackground ... 18
1.2 Motivation and Thesis Objectives ... 21
1.3 T hesis O utline ... 22
2 Literature Review: Calibration Methodology and Modeling of Information Dissemination 23 2.1 D T A system s ... 24
2.1.1 Simulation-based DTA systems ... 24
2.1.2 Model Components in DTA system ... 27
2.2 Calibration Methodology for DTA systems ... 30
2.2.1 Overall Calibration Approach ... 30
2.2.2 Demand Calibration ... 31
2.2.3 Supply Calibration ... 33
2.3 DTA System for Short-Term Planning Applications ... 35
2.4 Sum m ary ... 38
3 Development of Incident Scenarios and Evaluation of Diversion Strategies using DynaMIT-P 39 3.1 DynaMIT: An Overview ... 39
3.2 DynaMIT-P: Planning Version of DynaMIT ... 41
3.2.1 Main Components of DynaMIT-P ... 42
3.3 DynaMIT-P for the Incident Scenarios and Diversion Strategies (in general planning) ... 46
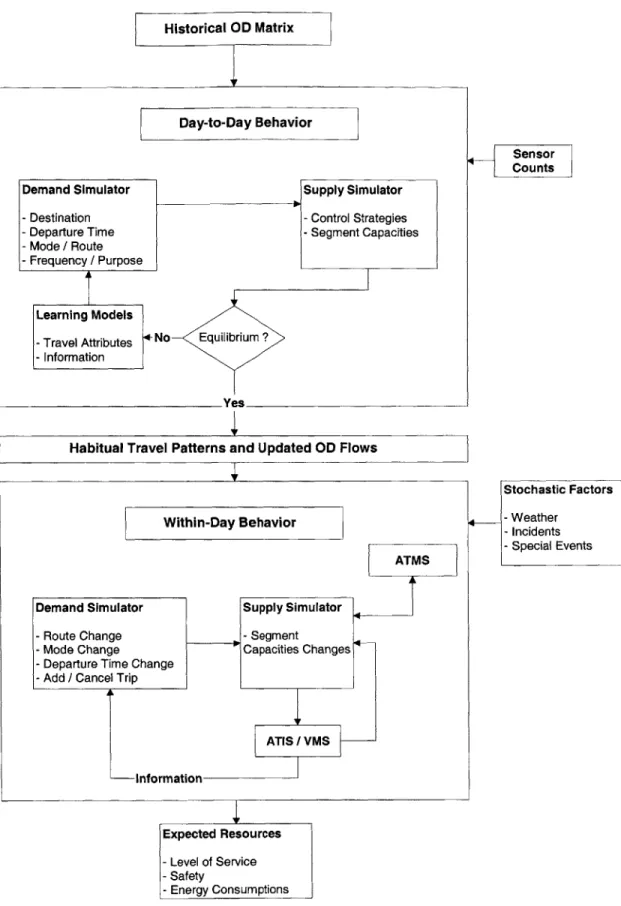
3.3.1 Modeling Day-to-Day Behavior in DynaMIT-P ... 49
3.3.2 Modeling Within-Day Behavior in DynaMIT-P ... 52
3.4 Representation of Incident Scenarios in DynaMIT-P ... 52
3.5.2 Modeling ATIS/VMS with Predictive Information ... 55
3.5.3 Dissemination of VMS/HAR Information in DynaMIT-P... 56
3.6 Framework of the Planning Tool for LWC Case Study ... 57
3.6.1 Development of Incident Scenarios... 57
3.6.2 Evaluation of Diversion Strategies... 60
3.7 Sum m ary ... 63
4 Calibration of DynaMIT-P for the Lower Westchester County 65 4.1 The Lower Westchester County (LWC) Dataset ... 65
4.1.1 Network Description ... 65
4.1.2 Available Data Sources ... 67
4.2 Calibration Results ... 87
4.2.1 Supply Simulator Parameters ... 87
4.2.2 Demand Simulator Parameters ... 89
4.4 Sum m ary... 98
5 Case Study 99 5.1 Scenario 1... .... 99
5.1.1 N o Incident ... 99
5.1.2 Incident without VMS ... 102
5.1.3 Incident with VMS (Diversion Strategy)... 106
5.1.4 Comparison of Different Cases: No Incident, Incident without VMS and Incident with VMS... 111
5.2 Scenario 2 ... 114
5.2.1 N o Incident ... 115
5.2.2 Incident without VMS ... 118
5.2.3 Incident with VMS (Diversion Strategy)... 120
5.2.4 Comparison of Different Cases: No Incident, Incident without VMS and Incident with VMS... 123
6 Conclusion 129 6.1 Thesis C ontribution ... 129 6.2 Scope of Future Research ... 130
A DynaMIT-P Input Files
B The vms.dat File
Figure 2-1 Figure 2-2 Figure 2-3 Figure 2-4 Figure 4-1 Figure 4-2 Figure 4-3 Figure 4-4 Figure 4-5 Figure 4-6 Figure 4-7 Figure 4-8 Figure 4-9
The Lower Westchester County Network ... 66 O-D Pairs for LWC Network ... 68
Location of the Sensors on the LWC Network ... 71 Sensor Count Variation for a Freeway (1-95, North and South) Bound)
S ensor ... . . 74 Sensor Count Variation for a Freeway (1-287, East and West Bound) S ensor ... . 75 Sensor Count Variation for a Parkway (Saw Mill River Parkway, North and South Bound) Sensor ... 76 Speed-Density-Flow Variation from Acoustic Sensor Data, located
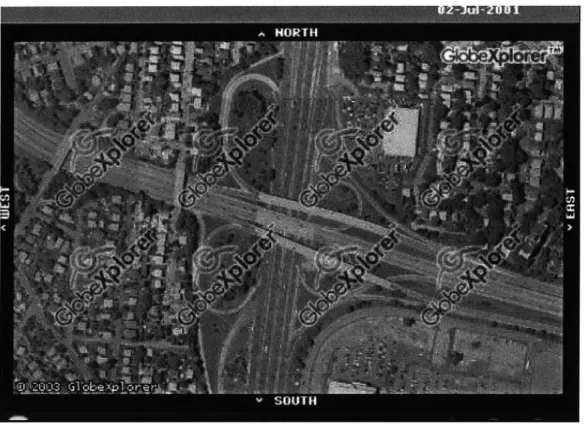
near Exit-5 on 1-287 Eastbound Freeway ... 80 Hourly Sensor Count Variation ... 81 NYMTC Representation of Interchange of 1-87 with Cross County
P ark w ay ... 82
List of Figures
The Overall Framework ...
The Demand Calibration Problem ... Iterative Demand Calibration Framework ... Three-stage Supply Calibration ...
The DynaMIT Overview ... System Framework of the Planning Tool using a DTA system ... Modeling Day-to-Day Behavior in DynaMIT-P ... Travelers Response to VMS ... Example to illustrate link-VMS and path-VMS ... Development of Incident Scenario ... Evaluation of Diversion Strategy using Predictive ATIS Strategy in
D ynaM IT -P ... Figure Figure Figure Figure Figure Figure Figure 3-1 3-2 3-3 3-4 3-5 3-6 3-7 31 32 33 35 40 48 51 54 56 59 62
Figure 4-11 Figure 4-12 Figure 4-13 Figure 4-14 Figure 4-15 Figure 4-16 Figure 4-17 Figure 4-18 Figure 4-19
from G lobeX plorer ... 83
Example of using TransCAD and GlobeXplorer Image to Construct Detailed Interchange required for the purpose of Traffic Modeling
in D ynaM IT ... 86
Network showing Origin Nodes (1,2,3,4) and Destination Nodes
(5,6,7); Examples of Paths for the OD pair 4-6 ... 92
Travelers' Equilibrium Travel Times (after convergence) between all
OD Pairs "1, 2, 3, 4 - 5,6, 7" ... 93
Network showing Origin Nodes (1,2,3,4,8) and Destination Nodes
(9,10,11); Examples of Paths for the OD pairs is marked with dark color... . . .. 94
Travelers' Equilibrium Travel Times (after convergence) between all
OD Pairs "1, 2, 3, 4, 8 -9, 10, 11" ... 94
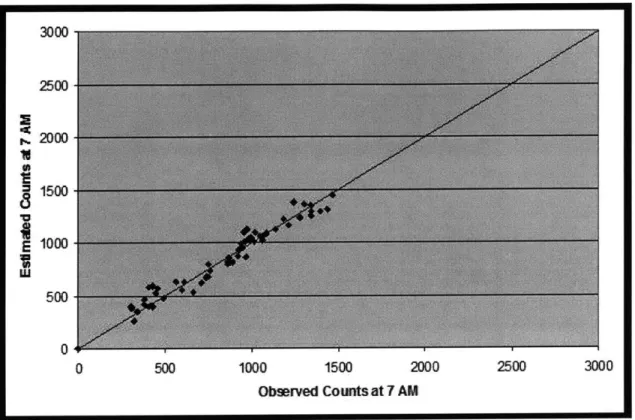
Estimated vs. Observed Sensors Count from 6:00 AM to 7:00 AM .... 96 Estimated vs. Observed Sensors Count from 7:00 AM to 8:00 AM .... 96 Estimated vs. Observed Sensors Count from 8:00 AM to 9:00 AM .... 97 Estimated vs. Observed Sensors Count from 9:00 AM to 10:00 AM ... 97
Figure 5-1 Network showing Origin Nodes (1,2,3,4) and Destination Nodes
(5,6,7); Examples of Paths for the OD pair 4-6 ... 100
Figure 5-2 Travelers' Equilibrium Travel Times (after convergence) between all
O D Pairs "1, 2, 3, 4 - 5, 6, 7" ... 100
Figure 5- 3 Frequency of Experienced Travel Times for all OD Pairs
"1, 2, 3, 4 - 5, 6, 7" ... 10 1
Figure 5-4 Average Travel Times between OD Pairs "1, 2, 3, 4 - 5, 6, 7" ... 102
Figure 5-5 Location of the Incident 1 and Examples of Paths for the OD Pair 4-6 ... 103 Figure 5-6 Impact of Incident 1. Travelers' Experienced Travel Times for all OD
P airs ... 10 4 Figure 5-7 Impact of Incident. Frequency of Experienced Travel Times for all OD
pairs "1, 2, 3, 4 - 5, 6, 7" ... ... 105
Figure Figure Figure 5-8 5-9 5-10 Figure 5-11 Figure 5-12 Figure 5-13 Figure 5-14 Figure Figure 5-15 5-16 Figure 5-17 Figure 5-18 Figure Figure 5-19 5-20 Figure 5-21 "1, 2 , 3, 4 - 5, 6, 7" ... 106 Location of VMS Message ... 107
Impact of VMS. Travelers Experienced Travel Times for all OD pairs.. 109 Impact of VMS. Frequency of Experienced Travel Times for all OD
pairs "1, 2, 3, 4 - 5, 6, 7" ... 109
Impact of VMS. Average Travel Time for all OD pairs
"1, 2, 3, 4 - 5, 6, 7" ... 110
Network showing Origin Nodes (1,2,3,4,8) and Destination Nodes
(9,10,11); Location of Incident 2 and Examples of Paths for the OD pairs
in dark color... 116
Travelers' Experienced Travel Times (after convergence) between all
OD Pairs "1, 2, 3, 4, 8 - 9, 10, 11" ... 116
Frequency of Experienced Travel Times for all OD Pairs
"1, 2, 3, 4, 8 - 9, 10, 11" ... 117
Average Travel Times between OD Pairs "1, 2, 3, 4,8 - 9, 10, 11" . 117
Impact of Incident. Travelers' Experienced Travel Times for all OD
P airs ... 1 18
Impact of Incident. Frequency of Experienced Travel Times for all OD pairs "1, 2, 3, 4, 8 - 9, 10, 11. ... 119
Impact of Incident. Average Travel Time for all OD pairs
"1, 2, 3, 4, 8 - 9, 10, 11" ... 120 Impact of VMS. Travelers Experienced Travel Times for all OD pairs.... 121 Impact of VMS. Frequency of Experienced Travel Times for all OD
pairs "1, 2, 3, 4, 8 - 9, 10, 11. ... 122 Impact of VMS. Average Travel Time for all OD pairs
List of Tables
Table 4-1 Total (top) and Usable (bottom) Sensors Received from NYSDOT .... 70
Table 4-2 Speed Density Relationship Parameters per Road Type ... 88
Table 4-3 Final RMS and RMSN Error for Each Time Interval ... 98
Table 5-1 Comparison based on Aggregate Statistics ... 111 Table 5-2 Comparison based on the Frequency of Trip Travel Times. For All
O D Pairs "1, 2, 3, 4 - 5, 6, 7" ... 112 Table 5-3 Comparison based on Departure Time Interval. For All OD
Pairs "1, 2, 3, 4 - 5, 6, 7" ... ... 113
Table 5-4 Comparison based on Aggregate Statistics ... 124 Table 5-5 Comparison based on the Frequency of Trip Travel Times. For All
OD Pairs "1, 2, 3, 4, 8 - 9, 10, 11" ... 124 Table 5-6 Comparison based on Departure Time Interval. For All OD
Chapter 1
Introduction
Transportation systems, especially those involving vehicular traffic, have been subjected to considerable increases in complexity and congestion during the past two decades. These conditions often produce traffic situations that jeopardize the safety of the people involved. Developed countries economies depend heavily on transportation systems and this dependence is likely to increase as "just-in-time" supply chain management is becoming more and more popular, that requires reducing the space and investment requirement for storage and rely on fast and reliable transportation network. Some transportation networks are more vulnerable to incidents ranging from natural disasters (like earthquakes, floods, storms, landslides and subsidence) or man-made disasters (like terrorist attacks, bridge or tunnel collapses and major accidents) at one end, to a variety of events (like congestion, road maintenance, badly-parked vehicles, and minor collisions). It is difficult to control the scale, frequency and predictability of these events but it is quite possible to design and manage the transportation system in such way that disruption caused by such events could be minimized.
It is thus needed to design a Transportation Management System that can handle a range of traffic conditions, emerging from the incidents mentioned above. In that direction, recent years have seen a tremendous growth in the field of Intelligent Transportation Systems (ITS) in parallel with the advancement in Information Technology (IT). Integrating ITS technologies with traffic surveillance promises to reduce the cost incurred by non-recurrent traffic congestion by improving transportation agencies' ability to predict and clear such incidents. Advance Traffic Management Systems (ATMS) and Advance Traffic Information Systems (ATIS) are examples of ITS sub-systems, which are increasingly becoming prevalent in the Traffic Management Center (TMC) of a city in order to address various traffic management issues. These tools
influence various factors associated with the transportation system like transportation demand (in reaction to information disseminated to drivers), network capacity (by using speed limit messages, Variable Message Signs (VMS)) and many other similar components. In order to make these sub-systems efficient it is very important to estimate and predict traffic condition as accurately as possible taking into account the impact of provided information to travelers, and thus provide better guidance to travelers.
Dynamic Traffic Assignments (DTA) systems ([36], [37], [38], [50]) are being developed to address these issues within Traffic Estimation and Prediction Systems (TrEPS). DynaMIT'
([37], [38]) is a DTA software system that provides travel guidance based on real-time traffic
predictions and drivers reactions to provided guidance. It has been designed to operate in a Traffic Management Center (TMC) and to support ATIS and ATMS operations. DynaMIT-P is a planning tool that operates in an offline mode, in which traffic managers investigate and prepare standard response strategies to different traffic and incident scenarios.
1.1 Background
Traffic congestion in developed and developing countries is putting a lot of pressure on the
economy of a country. Some recent surveys show that traffic congestion costs £15 billion per year to UK economy [26] and $72 billion per year to US economy [49]. These numbers itself reinforce the importance of good transportation networks that have minimal traffic congestion and efficient vehicular movement. A good transportation network not only helps in reducing traffic congestion but also plays a vital role in the development of a city, state and nation. Construction of new roads for solving the problem of traffic congestion is not only expensive and damaging to the environment but it also only provides a temporary solution to the existing problem. Construction of new roads will attract more traffic, which will nullify the projected benefits from its construction, making it a cyclic problem. Moreover, it is not always possible to build new roads due to many political, social and geographical constraints.
Above discussion leads us towards the need for better management of the existing road space with the help of emerging technological tools. Intelligent Transportation Systems (ITS) is one of the alternative approaches, which can be used to relieve traffic congestion by efficiently using the available road capacity. Adaptive traffic controls to minimize delays, Ramp Metering for smooth motorways traffic, Variable Message Signs (VMS) for incident management, speed control and parking guidance, Dynamic Route Guidance systems for guiding equipped vehicles to choose fastest path and to respond to incidents in real time, Electronic Toll Collection (ETC) for smooth revenue collection, are some of the examples which are already in practice to tackle different traffic scenarios.
A detailed analysis, including technical feasibility analysis and cost benefit analysis
(environment impacts, safety and efficiency), is needed before implementing any one of the above traffic control alternatives. Most of the public or private agencies are also interested in evaluating different alternatives. Evaluation of different alternatives to quantify various performance factors could be quite challenging. One way would be to actually implement the alternative and then compare the data before and after the introduction of the new system. But this approach is not desirable because of the following two reasons:
" Implementation of a new system requires a large amount of investment. It might
have severe political and social consequences if the new system is not successful. * Many new systems are expected to have modest benefits, e.g. a new urban traffic
control system may reduce travel times by less than 10%. Travel times however vary a lot from day to day anyway, so it can be hard to determine whether any measured changes are due to the new system or simply by chance. It is difficult to assess the benefits of a new system in place because many times it is hard to see if the measured changes are due to the new system or due to inherent variability in the network itself.
A more reliable and promising approach will be to use a traffic model to evaluate the
system, in which the traffic modeler has complete control over the different components of the model. In this way pre and post conditions of a new system can be computed more reliably and with greater confidence in the results. Traditional traffic models, having simple
speed-density-flow relationships, are not able to assess the effectiveness of a new system which often requires more complicated models. Micro-simulation models, which capture the individual driver behavior using various car following, lane changing and gap acceptance rules, are becoming more and more prevalent for the analysis of an ITS system. These models take into account the response of individual drivers to a change in the network conditions and hence can be used as a proxy of the real world. Wide range of measures of effectiveness can be obtained as an output of the simulation in order to provide realistic results, prior to implementation of new system in the real world. MITSIM [30], PARAMICS [45], VISSIM [44] and CORSIM [21] are some of the examples of micro-simulation software system available for such kind of analysis.
One of the main problems with micro simulators is that they require a large amount of computational time for simulating a large transportation network and hence are not well suited for real-time use for such a network. This necessitates the development of a system that can be used for the operation of a transportation management system with precision enough for ITS purposes and is also real time. In this regard, development of a Dynamic Traffic Assignment
(DTA) model has been a subject of major research for transportation experts for more than thirty
years. With the ever-increasing deployment of ITS systems, it has become crucial to come up with a DTA system which can be used for dynamic traffic management purposes, like reducing delay on major highways, improving safety, efficiency and capacity of transportation network, and improving wide-area emergency responses through information sharing and coordination. With these goals in mind FHWA R&D started a DTA research project in 1994 to address complex traffic control and management issues in the information-based, dynamic ITS environment (http://www.dynamictrafficassignment.org). DynaMIT, developed at MIT Intelligent Transportation Systems Program, is a result of this project. It has features like real-time estimation and prediction of network conditions taking into account the drivers response to disseminated information, traffic information and route guidance to drivers for optimal decisions.
Since DynaMIT has reliable traffic estimation and prediction capabilities, it is well suited to assist transportation planners and policy makers while evaluating different diversion strategies in case of special events and emergency situations. Use of DynaMIT during such policymaking is justified by its unbiased and consistency features, which ensure that DynaMIT's prediction of
expected network state matches what drivers would experience on the network. DynaMIT-P, which is a planning version and meant to assist in offline planning decisions, focuses on short-term and within-day travel behavior, assuming that the long-short-term decisions are given.
1.2 Motivation and Thesis Objectives
NYSDOT (New York State Department of Transportation), in association with many public and
private sector companies, is in the process of deploying state-of-the-art ITS installation in the Lower Hudson Valley (LHV) road network. Existing traffic surveillance and monitoring devices such as loop detectors and CCTV will be substantially augmented by the deployment of 24 TRANSMIT detectors on the LHV highways and bridges, many of which have high fraction of
EZ-PASS users. With proper processing, the data should make it possible to obtain reliable
real-time estimates of traffic flows and travel real-times by link, path and origin-destination (O-D) pair over much of the LHV network.
This information can form the basis for providing very effective travel guidance to network users. Lower Westchester County (LWC) ITS subsystem has considered installing VMS and Highway Advisory Radio (HAR) transmitter at key network locations. They are intended for routine guidance use as well as to assist with MPT activities. The combination of NYSDOT's
ITS infrastructure with DynaMIT's guidance generation capabilities would lead to a very
powerful system for improving traffic conditions in the LWC area, and is the motivation for this thesis.
In a nutshell, the purpose of the proposed thesis is to apply DynaMIT's DTA capabilities to the LWC ITS subsystem, to generate guidance for the LWC's ITS equipment in an offline mode, and to use calibrated system to perform illustrative analyses of incident response strategies. The efficiency of any traveler information and guidance system depends largely on the accuracy with which the system can estimate and predict network state and path travel times. In order to ensure that the system reacts and behaves in a realistic manner when used in TMC, it is critical to calibrate its model components against the field data observed from the network.
i) to calibrate DynaMIT so that it can estimate and predict traffic conditions in the LWC network with precision sufficient for ITS purposes.
ii) to illustrate the use of calibrated DynaMIT system by applying it to investigate a limited number of incident scenarios and response strategies in the LWC test bed.
1.3 Thesis Outline
This thesis is organized as follows. Chapter 2 covers the literature available related to calibration of different components within a DTA system. A calibration methodology for DTA system is presented with particular emphasis on DynaMIT. It also covers a literature review on modeling of information dissemination devices. Chapter 3 presents a general framework for the development of incident scenarios and diversion strategies. It briefly covers components of DynaMIT-P, a planning version of DTA system, and then explains how it is been used for developing incident scenarios and corresponding response strategies. Chapter 4 implements the developed framework to generate several case studies for LWC network. It covers various issues with available data and assumptions made due to available data quality, with respect to the need of DTA system components. It presents different calibrated parameters of DynaMIT system for the LWC network. It finally describes the impact of different incidents and respective diversion strategies. Chapter 5 summarizes the research work and presents the direction for further work needed in this area.
Chapter 2
Literature Review: Calibration Methodology and
Modeling of Information Dissemination
Traffic assignment models are used to simulate traffic flows on a transportation network, and various other variables like travel times, pollutant emission, congestion etc. Traditional planning methods like four-step process mainly consist of static and deterministic models. Currently agencies use static assignment models for many planning objectives, like improvement of traffic movement, traffic maintenance, air quality impact etc. However, these traditional tools are not able to capture the effect of traffic control, information dissemination, traffic dynamics and driver's response to any information, which make them unsuitable for certain applications, especially while evaluating evolving and existing ITS technologies. These drawbacks of traditional planning and assignment models are overcome by Dynamic Traffic Assignment
(DTA) systems, which have evolved substantially in the last two decades and have reached a
sufficient level of maturity to be used in many planning and operational applications. DTA systems capture traffic dynamics in realistic manner by modeling time dependent Origin-Demand (OD) demand, queues and spillbacks. Also, planning version of DTA system can be
used in place of existing planning tools replacing static assignment models.
Despite the fact that uncertainty due to congestion, incidents or any special event should be accounted in good planning, it has rarely been used in the analysis and forecasting tools which provide quantitative design decision support for a transportation network. With the evolution of
ITS and DTA systems, it is now possible to design such ATMS/ATIS strategies that will provide
high level of network performance by providing guidance through VMS/HAR, in general measured in terms of travel times.
The Following sections will cover a detailed literature review of DTA systems, its components and calibration, and need for the development of a planning tool for short-term planning applications using a DTA system.
2.1
DTA systems
There are mainly two types of DTA systems: (i) Analytical, and (ii) Simulation-based. Analytical
DTA models frame the problem as an optimization and use mathematical optimization
techniques to solve this problem. There are two main disadvantages of analytical DTA system: (i) these models become very complex and intractable for large and realistic size networks, and (ii) these models can not capture the realities of network (like street, segment characteristics) due to the assumptions made to simplify the problem. Simulation-based DTA systems overcome these disadvantages but they also have several drawbacks like failure to reach convergence. While more research is needed towards further enhancements and applications of simulation-based DTA systems, they have several advantages:
(a) Simulation-based DTA systems capture some traffic issues which are difficult to capture in analytical approach, like complex vehicle interactions, traffic signals, realistic network representation, congestion, queues, spill-backs and congestion dissipation.
(b) Importance of simulation-based DTA systems increases in the context of modeling
various ATMS, ATIS and ITS strategies.
(c) They can capture the time dependent interaction between different components of a DTA system (like supply and demand). Various travel choices, like mode, departure time and path, can be modeled easily by simulation-based DTA systems.
2.1.1 Simulation-based DTA systems
Examples of currently available simulation-based DTA systems for planning and decisions support are DynaMIT, DYNASMART and CONTRAM.
DynaMIT, developed at MIT's Intelligent Transportation Systems Program, is the
state-of-the-art traffic estimation and prediction software system, which is designed to reside in a Traffic Management Center (TMC) for various real-time and planning applications, and to support ATIS and ATMS strategies. DynaMIT incorporates unbiasedness and consistency to achieve reliable prediction and credible guidance. Unbiasedness ensures that the information provided to travelers is based on the best available knowledge of current and anticipated network conditions. Consistency guarantees that DynaMIT's prediction of expected network conditions match what drivers would experience on the network. DynaMIT has the ability to trade off level of detail and computational practicability, without compromising the integrity of its output. Its important features and functionality include:
(a) Demand simulation using a micro-simulator, which generates individual travelers and simulates their choices regarding whether to travel or not, departure time, mode, and route (pre-trip and en-route) in response to information provided by the ATIS.
(b) Supply simulation using a mesoscopic traffic simulator that explicitly models the traffic
dynamics of development and dissipation of queues, spillbacks, and congestion in general.
(c) Individually simulates each trip, to generate detailed vehicle trajectories, which is very useful to various ATIS requirements.
(d) Uses a rolling horizon to achieve efficient and accurate real-time estimations and
predictions. It employs this predicted information to generate descriptive and prescriptive information that avoids overreaction to any incident.
(e) DynaMIT-P, planning version, is designed to assist the evaluations of infrastructural, operational, or informational changes to local and regional transportation networks, by efficiently modeling day-today and within-day patterns of traffic flows, travel demand and network conditions.
DYNASMART, developed at University of Texas at Austin, is an
assignment-simulation-based framework that combines advance network algorithms and models trip-maker behavior in response to information, using real-time information, such as loop detectors, roadside sensors, and vehicle probes. Consistency checking and updating is an important function incorporated in
DYNASMART to ensure consistency of the simulation-assignment model results with actual observations, and to update the estimated state of the system accordingly. Key Features of DYNASMART include:
(a) A simulation-based dynamic traffic assignment system with micro-simulation of individual user decisions in response to information and a mesoscopic traffic flow simulation approach.
(b) Recognizes multiple user classes in terms of (1) operational performance (e.g., trucks,
buses, passenger cars), (2) information availability and type, and (3) user behavior rule and response to information.
(c) DYNASMART-P, planning version, can model several features, like ability to load individual trips and trip chains with several intervening stops of associated durations, evaluation of HOV[HOT pricing schemes, VMS and incident management.
CONTRAM (CONtinuous TRaffic Assignment Model), developed by Transportation Research Laboratory (TRL) and Mott Macdonald, UK, has the capability to model variety of situations from congested urban networks to regional inter-urban areas. It can model unexpected events such as incidents that reduce network capacity and the effects of driver information systems. Fuel consumption and pollutants emission can also be modeled by CONTRAM. By interfacing with TUBA ( Transport User Benefit Appraisal) it can do the cost benefit analysis of new infrastructure changes and traffic control measure. Special vehicle lanes, like HOV/HOT, modeling or banning turning movements in certain situations can be handled by it. Dynamic modeling is done by CONTRAM by dividing the day into time slices to model peak and off-peak traffic conditions. Vehicles are assigned to minimum cost paths by taking into account the vehicle interactions and delays caused by these interactions. Some of the key modeling features are: dynamic matrix estimation, an unlimited number of time slices, up to 32 user definable vehicle classes, left or right hand drive. One of the major limitations of CONTRAM is that it cannot explicitly capture the individual driver behavior and decisions, which are very crucial for evaluating different ATIS/ATMS strategies.
2.1.2 Model Components in DTA system
A general framework of the DTA system consists of three sub-models:
(1) Demand Model: simulates the effects of the transportation system state on the
behavior of users.
(2) Supply Model: simulates the effects of user behavior on the transportation system. It captures the traffic dynamics (like congestion, queues, spill-backs, travel times, flows, speed densities) at all points on the network, and hence used to indicate network performance.
(3) Demand-Supply Interaction Model: simulates the interaction between the above
two models (day-to-day and within-day models)
(1) The Demand Model
Demand model in DTA systems captures the driver behavior with respect to pre-trip or en-route information on departure time, mode and route choice, as well as day-to-day behavior modeling of these choices. These choices are represented as a function of different kinds of attributes like travel time, cost, comfort and other socio-economic factors like age, sex, income level etc. A key component of demand model is OD estimation, which involves adjustment in demand in order to match traffic sensor counts as closely as possible. A general framework for dynamic demand simulation is presented by Ben-Akiva et al. [11]. A detailed literature review about the different modules of the demand model is done by Sundaram, S. [48]. A brief discussion of these components and their importance with regard to DTA system is presented below:
(a) The Route Choice Model
The route choice model captures the important aspect of dynamic traffic assignments. It contains choice set of all the feasible routes for each driver. Most of the route choice models use Multinomial Logit Model (MNL) for calculating the choice probability for all feasible routes of each user. It then assigns the driver to the path with maximum probability and utility. The Independence from Irrelevant Alternatives (IIA) limitation of
MNL model is usually resolved by C-logit route choice model (Cascetta et al. [17]),
which account for amount of overlapping among paths and hence give more realistic routes flow fractions. Path-size (PS) logit model by Ramming [46] uses the correction term for overlapping that takes into account behavior theory and uses discrete choice theory (Ben-Akiva and Lerman, [8]).
Route choice can be modeled at Pre-trip and En-route level based on the ATIS information. One of the major differences between these two kinds of models is the fact that shift in departure time is no longer available for en-route choice model because driver has already entered the network. Modeling of route choice in response to information, available through VMS or through some dedicated system, is usually done in two ways. One of them is to take into account the factors into discrete choice modeling, which are considered to influence en-route decisions. Other way is to model these choices by bounded rationality concept, which states that driver's decision depends on the satisfaction level (Simon [47], Mahmassani and Chang [35], Mahmassani et al.
[36]). For example, driver will change the route only if the total saving in travel time is
above some threshold value. An approach using fuzzy theory to model route-choice in the presence of information is also presented by Lotan and Koutsopoulos [33].
(b) The Departure Time Model
Departure time choice of driver is sensitive to information provided regarding incident, congestion, and some personal attributes like value-of-time and preferred time of arrival. Generally used models for departure time choice are Logit model, Generalized Extreme Value (GEV) model and Logit kernel probit etc. Similar to route choice model, these models suffer from IIA property especially when departure time choices are closer, in which case error term may be correlated. To overcome this problem, departure time switching models are employed where choices are either habitual departure time or, some earlier or later time slot.
(c) The Mode Choice Model
Most of the mode choice models are based on logit or nested logit models, which use random utility principle. To choose a mode like car, transit, bus or any other mode
depends on various explanatory variables like travel time, travel cost, comfort, number of changes, income level, age and many other socio-economic attributes.
(d) The O-D Estimation Module
The O-D estimation module estimates the OD flows by varying time interval so that simulated sensor counts and field counts match within desired limits. Generally used algorithms for OD estimation are either simultaneous or sequential. Some of these approaches are the Kalman Filter approach and Generalized Least Square (GLS) approach. Balakrishna [6], Ashok [4] and Brandriss [13] have described these two approaches in detail. Some of the very good and comprehensive work in this area is been presented by Ashok and Ben-Akiva [5], Cascetta [14] and Cascetta et al. [16].
(2) The Supply Model
The supply model of the DTA system captures the traffic dynamics of the network by simulating the movement of drivers. It does not capture the detailed drivers interactions, like lane changing, car following models in micro-simulation, but primarily captures queuing behavior of the traffic. It provides network performances in terms of flows, speeds, densities, travel times, and build-up and dissipation of lane-specific queues and spillbacks over all the points on the network.
Most of supply simulators are mesoscopic in nature based on two types of models: 1. a deterministic queuing model and, 2. a moving model. The queuing model simulates the spillbacks by using input and output capacity of the segment. Insufficient capacity or space on the current or downstream segments will cause vehicles to start queuing up. The moving model is based on macroscopic speed-density relationship. Further, capacities are also used to model incidents and signalized intersections. Detail literature on the supply simulation can be found in Ben-Akiva et al. [9] and Kunde [31].
The Demand-supply interaction model captures the day-to-day learning experience of the users. This behavioral principle states that choices of the users depend on the expected pre-trip travel times. Expected value of the travel time is a result of experience, memory and learning. Cascetta and Canterella [15] have described day-to-day stochastic assignment models, which predict the driver's expected travel time based on his experienced and expected travel times in the past days. An equilibrium model, where travel choices are based on the weighted average of experienced travel times during the previous days, is proposed by Horowitz [25]. Ben-Akiva et al. [10] and Jha et al. [28] have presented models which incorporate information provided to drivers into the day-to-day learning models. Mahmassani and Chang [34] have proposed model which takes into account the late or early arrival of driver on the previous days.
2.2
Calibration Methodology for DTA systems
The efficiency of any traveler information and guidance system depends largely on the accuracy with which the system can estimate and predict network state and path travel times. This leads to level of detail and accuracy of the two simulation tools used by DTA systems: the demand simulator and the supply simulator. In order to ensure that the systems react and behave in a realistic manner when used in TMC, it is critical to calibrate its model components against the field data observed from the network.
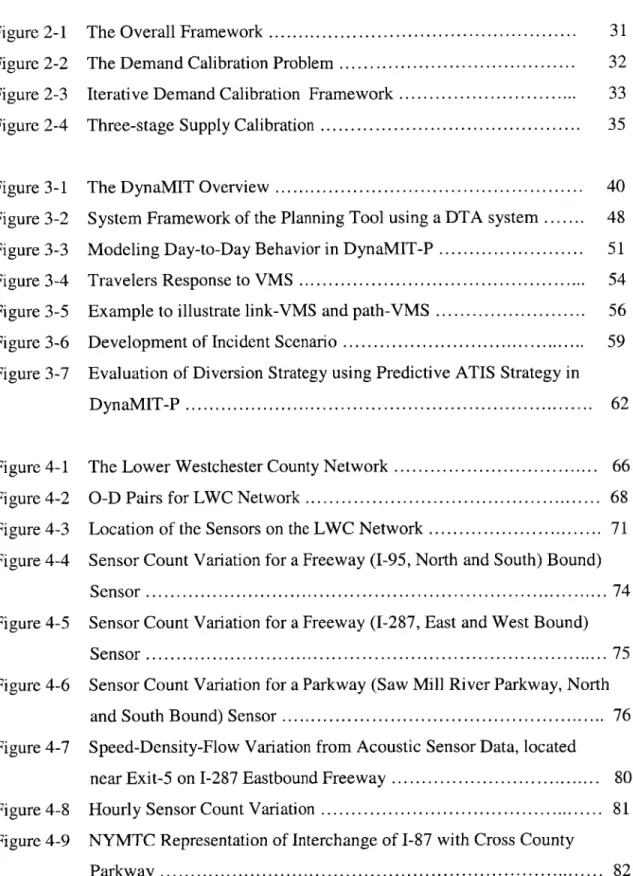
2.2.1 Overall Calibration Approach
The generalized approach for the calibration of a DTA system can be summarized as shown in Figure 2-1. The process begins with the initial values of calibration parameters based on available data or on some reasonable assumptions. These initial parameters are fed into DTA system to generate model outputs. An objective function will then be computed based on model outputs and observed field data. The next set of parameters values will be determined by an optimization step, which will again be used in DTA system as new inputs. After the convergence, model outputs will be used for further analysis.
The Optimization problem mentioned in the above framework is usually very large and complex, and might therefore be solved sequentially. The calibration process can be seen as an iterative sequence of demand and supply model calibrations within the DTA system, with their interaction resulting into final model outputs in each iteration. The Following sections will present the approaches to calibrate the demand and supply models within DTA system.
In itia I V a Iu es
D TA System
M odeI Updated
utputs Param eter
Values
0Observed 01 0bjective N o
D ata F unctio n
Op tim iz atio n C Con v erg enc e
Analysis
Figure 2-1: The Overall Framework
2.2.2
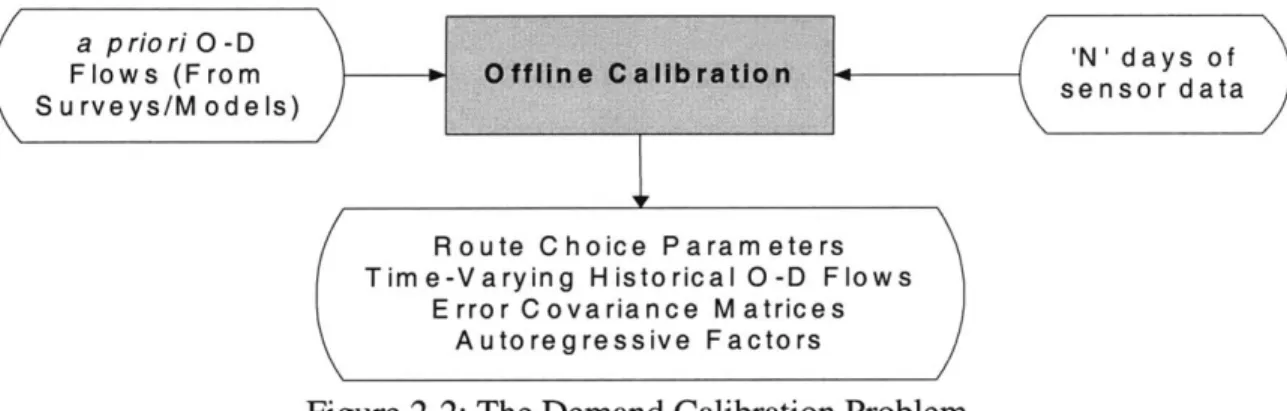
Demand Calibration
Demand Calibration Elements. Demand calibration methodology will integrate the route
choice, departure time choice and O-D estimation modules into a single united frame. Input and output requirements of the demand calibration are shown in Figure 2-2. This process uses
available estimates of O-D flows and several days of sensor counts and occupancies. The route choice parameters and O-D flows estimation models inputs are the outputs of this process.
a priori O -D
Flows (From Surveys/M odels)
'N' days of sensor data
Route Choice Parameters Time-Varying Historical O-D Flows
Error Covariance Matrices Autoregressive Factors
Figure 2-2: The Demand Calibration Problem
In summary, the demand simulator's parameters which need grouped as below:
Route Choice Parameters
i) Parameters in the path choice set generation algorithm ii) Parameters in the path utility specification
iii) Path-size exponent
to be calibrated can be
O-D Estimation (and Prediction) Parameters:
i) The historical database of O-D flows, XH
ii) The variance-covariance matrix Vh associated with indirect measurement errors
iii) The variance-covariance matrix Wh associated with direct measurements errors
iv) The matrices
ff
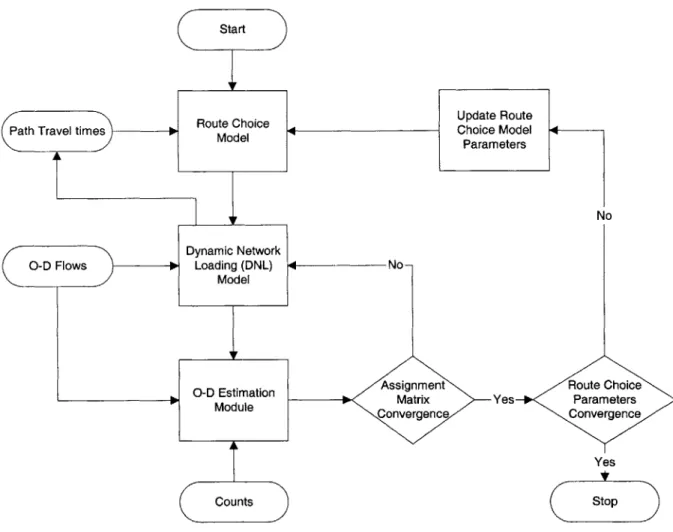
of autoregressive factorsBalakrishna [6] has described that demand calibration problem becomes a fixed point problem between the route choice fractions, the assignments fractions and the O-D flows, and can be solved by iterative approach. The paper has described in detail an iterative approach (Figure 2-3) to demand calibration where route choice model has been used as the starting point in the iterative framework.
Start
Route Choice Update Route
Path Travel times Model i Choice Model 4
Parameters
No Dynamic Network
O-D Flows Loading (DNL)
No-Model
O-D Estimation Assignment Route Choice
P Module Matrix Yes Parameters
Convergence Convergence
Yes
Counts Stop
Figure 2-3: Iterative Demand Calibration Framework.
2.2.3
Supply Calibration
Supply Calibration Elements. The supply simulator in DTA system (in particular in DynaMIT)
is a mesoscopic traffic simulator that simulates vehicular movements and provides matrices of network performances such as the temporal and spatial flows, speeds, queue lengths, and travel times at all points on the network. The supply simulator obtains the network description and the list of packets (vehicles) to be moved on the network through its interfaces with the network topology component and the list of packets component respectively. It then simulates the
movement of vehicles on the network for the given supply simulation time interval. Calibrated speed-density relationship parameters and lane group parameters (capacities) are the outputs of supply calibration module.
The list below shows the summary of parameters which are key to the calibration of supply simulator:
i) Segment-specific speed-density parameters u, umin, ko, kjarn, a and
Q,
ii) Lane group capacities on freeway and arterial segments, andiii) Lane group capacities at the signalized intersections.
Kunde [31] has shown in detail the three-stage calibration methodology (Figure 2-4) for supply simulator parameters. The approach divides network into three different levels, (i) Disaggregate level (ii) Sub-network Level, and (iii) Entire Network level. Calibration of parameters is then done from microscopic level (disaggregate) to macroscopic level (entire network).
As mentioned before, since calibration of demand and supply parameters is a very large and complex problem calibration of these parameters is usually done iteratively between demand and supply models. While demand simulator needs specific supply model parameters (like link travel time) as an input, supply simulator moves the vehicles on the network assuming driver choices are known. Hence, calibration process can be seen as an iterative sequence of demand and supply model calibration, with their interaction resulting in the final model outputs in each iteration.
Traff ic Sensor Data
Calibration of Individual elements 1. Speed-density relationships of
segments
2. Capacities of segments (accounting
for intersections)
Subnetwork True O-D flows,
Calibration Route Choice
Initial Paramter Values
System level calibration
Supply I Demand
Figure 2-4: Three-stage Supply Calibration
2.3 DTA System for Short-Term Planning Applications
The main limitations of the static planning tools (like EMME2, TransCAD, TRANSIMS,
TRANPLAN, etc.) for short-term planning applications, especially in the presence of ITS, are
their inability to capture traffic dynamics, dynamic demand-supply interactions and characteristics of ATIS/ATMS. Furthermore, the network performance is due to the individual decision of the travelers and it is necessary to use disaggregate models to capture traveler behavior. Existing planning tools do not capture such a rich and explicit modeling of traveler
behavior. One of the main reasons for the need of a new planning tool is to address ITS in the planning context. Currently there are very few tools that are useful for analyzing ITS deployments. IDAS (Intelligent Deployment Analysis Software) is a recent tool developed by FHWA. However, existing planning tools (including IDAS), which are based on static techniques, are not very effective in evaluating ITS strategies.
A brief review of some of the studies for evaluating ITS and other strategies, and the
limitations of the techniques used to evaluate them are summarized below. A more detailed treatment of the literature review on this topic can be found in Sundaram [48].
0 ATIS Strategies:
It has been pretty well established in the literature that provision of information is effective primarily under non-recurrent congestion conditions. Al-Deek and Kanafani [2], modeled the benefits of information in traffic corridors and based on a simulation study reported that travel time savings are significant and can be in the order of 30 percent in a simple network with two routes. Simulation results in the Santa Monica Freeway corridor in Los Angeles (Gardes and May, [22]), showed that in the presence of an accident, information provision can bring about 6.2 percent reduction in travel times.
However, a few authors have questioned the significance of Advanced Traveler Information Systems (ATIS) benefits (e.g. Arnott et al. [3], Hall [23]). Arnott argues that
ATIS may counter-productively lead travelers to congested alternative routes. Hall
questions whether the problem of non-recurrent congestion is as significant as claimed. The general conclusion, however, from the available literature is that ATIS can be beneficial but this statement has to be verified, either by observing actual ATIS deployments or by conducting further studies. By modeling in-vehicle information, VMS and HAR devices, DynaMIT becomes a valuable tool for such studies.
Clearly, to analyze the impact of information either through in-vehicle guidance, VMS messages or other means, it is necessary to explicitly model both traveler behavior and traffic dynamics accurately. Existing simulation tools lack one or more of these critical features. Specifically regarding in-vehicle information, several authors have tried to analyze the impact of in-vehicle information with market penetration (e.g.
Jayakrishnan et al. [27], Walting and Van Vuren [51]). However, studies with respect to market penetration effects were based either on surveys or on queuing models and do not effectively capture traffic dynamics and traveler behavior in response to information.
Impact of VMS messages also typically depends on driver response to these messages and the resulting traffic conditions. Response behaviors of drivers in the presence of a VMS have been addressed by the use of logit models based on SP (Stated Preference) surveys (e.g. Bonsall and Merall, [12]). The main drawback of these surveys relates to the well-known problems with SP surveys (e.g. response bias, justification bias). An example of this issue is the study conducted by Chatterjee et al. [18]. As reported in that study, only one-fifth of the drivers indicated by SP surveys actually diverted in one area, while SP results were consistent with observed diversion rates in another location.
Under VMS information, studies based on SP surveys by Wardman et al. [52], Bonsall and Merall [12] and Peeta et al. [43] indicate that the following parameters are important factors that govern travelers' route choice decisions: relative journey times, delay on the current route, age, sex and previous network knowledge. McArthur [40] used behavioral rules employed in PARAMICS-CM and found that diversion is based on whether the savings that travelers perceive lie above a threshold, as well as on the travelers' patience and trust in the system.
9 Demand Management Strategies:
Common example of demand management strategies is the use of HOV[HOT lanes. Several studies (Dahlgren [19], Johnston and Ceerla [29]) have tried to assess the impact of HOV/HOT lane strategies. However, these studies do not explicitly consider traffic dynamics and it is very difficult to analyze for example a strategy such as converting an already existing general-purpose lane into a HOV/HOT lane. Thus there is need to develop tools that would capture not only rich traveler choice models to estimate the mode shift associated with HOV lanes but that would capture traffic dynamics that will determine the network impacts of such strategies.
Based on the preceding discussion, there is indeed a strong motivation to develop planning tools that will encapsulate traveler behavior, capture traffic dynamics and can be used for a variety of planning applications (including ITS strategies). The shortcomings of the traditional static planning tools are overcome by DTA systems, which capture traffic dynamics in a realistic manner by modeling time varying OD demands, queues and spill-backs. Sundaram [48] has further developed a framework for short-term planning applications using a DTA system. This framework is able to model day-to-day evolution of travel demand and network conditions and capture the within-day dynamics in the case of stochastic events. With current emphasis on
ATIS/ATMS strategies and ITS investments to improve traffic conditions, the developed
planning tool is capable of addressing these issues. This developed tool will be used, in the current thesis, for evaluating diversion strategy under incident response using VMS/HAR. The details of this planning tool are given in the next chapter.
2.4 Summary
In this chapter, first we have described different types of DTA systems, its main features and different kinds of models used within the DTA systems. The importance of calibration while implementing a DTA system and different calibration approaches for calibrating various supply and demand parameters were discussed next. Finally, this chapter focused on the modeling of information dissemination devices, which is very important and critical while supporting a decision system, especially in case of congestion and incident. It was emphasized that current
DTA systems, like DynaMIT and DYNASMART, take into account the reaction of drivers to the
information provided. Therefore these DTA systems, combined with ATMS/ATIS tools, can be used for better performance of network, especially in terms of reliability of travel times.
The next chapter presents a framework for the development and evaluation of diversion strategies in case of incidents using a state-of-the-art DTA system (DynaMIT).
Chapter 3
Development of Incident Scenario and Evaluation
of Diversion Strategy using DynaMIT-P
This chapter presents the framework for developing incident scenarios and diversion strategies using the DTA system DynaMIT-P, a planning version of DynaMIT. A brief overview of its features and functionalities were given in Chapter 2. This chapter will provide a deeper understanding of its main components. A description of some of the modeling features that make DynaMIT-P suitable for this kind of planning applications are covered next, especially day-to-day and within-day driver behavior modeling. Finally, representation of incident scenarios and representation of VMS/HAR for response strategies in DynaMIT-P have been described.
3.1 DynaMIT: An Overview
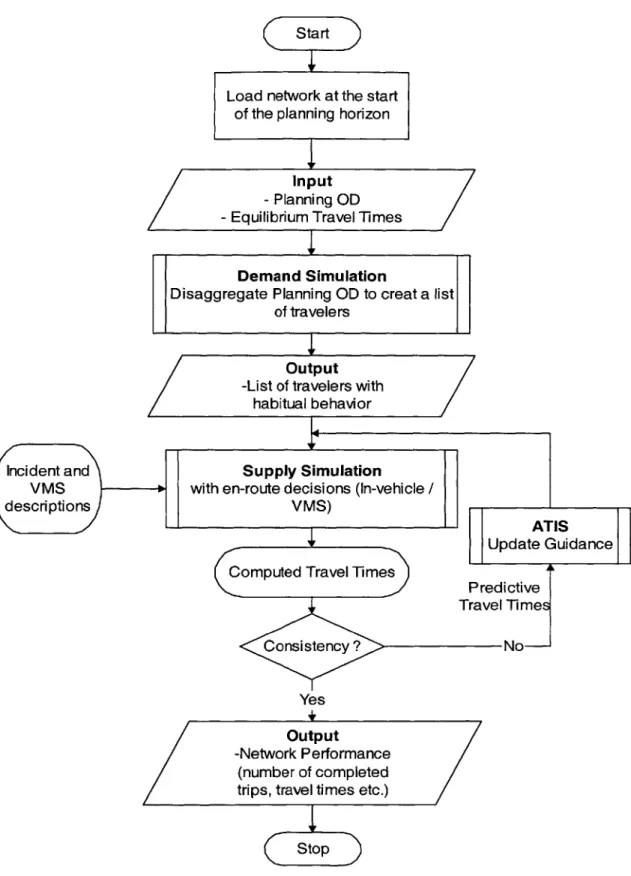
The overall framework of DynaMIT showing its various components is shown in Figure 3-1. For detailed description of DynaMIT, reader is referred to Balakrishna [4]. It is designed to reside in a Traffic Management Center (TMC) for supporting various ATIS/ATMS operations. As clear from the figure, DynaMIT takes both real-time and off-line data for its operation. The off-line data consists of network description, time-dependent O-D matrices, link travel times and default parameters for different models. The real-time information consists of surveillance data, traffic control information and incident characteristics (like location, starting time, duration and severity).
Demand Supply Simulation Simulation Demand supply Simulation Simulation Information Generation
Figure 3-1: The DynaMIT Overview
The state estimation module gives the current estimate of the network in terms of O-D flows, speeds, densities, queues and link flows, using the inputs (sensor counts etc.) from the network. The State Estimation module has two main models: (1) The Demand Simulator, and (2) The Supply Simulator. The Demand Simulator has the capabilities to do real-time O-D estimation, taking into account the user behavior for route, departure time and mode. It also models the impact of information provided to user by modeling the reaction of each individual to the given information, and hence updates the historical O-D matrices. The O-D model then uses the real-time sensor counts, updated O-D flows, assignment matrices (fraction of OD flows to link flows) to estimate the current interval O-D flows. The Supply Simulator simulates the traffic conditions over the network using the estimated O-D flows from the Demand Simulator, updated capacities (due to incidents etc.), traffic dynamics parameters, traffic control strategies and traffic information and guidance disseminated (using VMS, HAR or any other dedicated guidance
system). Response of users to ATIS is captured through en-route driver behavior model. Demand-supply interaction is an important component of estimation module. The O-D estimation model uses assignment matrix that is an output of the Supply Simulator. But assignment matrix itself depends on route choice decisions made by drivers, which is a part of the Demand Simulator. Hence, it became necessary to iterate between the Demand Simulator and the Supply Simulator in order to achieve convergence.
The Prediction-based Information Generation module uses the predicted traffic conditions to generate information and guidance to users using various ATIS strategies. An iterative framework is used to obtain a guidance that should be the best under such conditions. This important property is called consistency that ensures that there would be no better path that the driver could have chosen. Each iteration consists of a trial strategy, network state prediction (both demand and supply prediction) under the strategy and evaluation of the predicted state for consistency. After the consistency is been achieved, information is disseminated to users in the network.
3.2
DynaMIT-P: Planning Version of DynaMIT
DynaMIT-P is the planning version of DynaMIT, which has the potential to substantially improve short-term transportation planning process, especially involving congested network. It is designed to assist the evaluations of proposed changes to local and regional transportation networks. Such changes could be infrastructural, operational or informational in nature. DynaMIT-P is the efficient adaptation of DynaMIT to achieve short-term planning process objectives.
DynaMIT-P models short-term (day-to-day) and within-day travel decisions. Short-term travel decisions include departure time, route, mode and destination choices. These short-term decisions are also affected by long-term decisions. For example, a long-term decision about residential location, auto ownership or changes in the network will affect the short-term decisions like departure time, route etc. With their daily travel choices and behavior, individuals develop habitual travel patterns that they follow regularly. Within-day decisions capture the