Degradation Mechanisms of GaN High Electron Mobility Transistors
by
Jungwoo Joh
B.S. Electrical Engineering, Seoul National University, 2002
Submitted to the Department of Electrical Engineering and Computer Science in Partial Fulfillment of the Requirements for the Degree of
Master of Science in Electrical Engineering at the
Massachusetts Institute of Technology January 19, 2007
© 2007 Massachusetts Institute of Technology All Rights Reserved.
The author hereby grants to MIT permission to reproduce and distribute publicly paper and
electronic copies of this thesis and to grant others the riobt
t-Author Department of Electrical J- -1, 00 January 19, 2007 Certified by Accepted by ___ MASSACHUSET INTITUTE OF TECHNOLOGY
APR 3 0 2007
Te'nif A del Alamo
ngineering 3upervisor
-C. Smith Chairman, Department Committee on Graduate Students
Degradation Mechanisms of GaN High Electron Mobility Transistors
byJungwoo Joh
Submitted to the Department of Electrical Engineering and Computer Science January 19, 2007
in Partial Fulfillment of the Requirements for the Degree of Master of Science in Electrical Engineering
ABSTRACT
In spite of their extraordinary performance, GaN high electron mobility transistors (HEMT) have still limited reliability. In RF power applications, GaN HEMTs operate at high voltage where good reliability is essential. However, physical understanding of the fundamental reliability mechanisms of GaN HEMTs is still lacking today. In this thesis, we carry out systematic reliability experiments on industrial GaN HEMTs provided by our collaborators, TriQuint Semiconductor and BAE systems. In our study, GaN HEMTs have been electrically stressed at various bias conditions while they are being characterized by a benign characterization suite. We have confirmed that electrical stress on devices results in an increase in drain resistance RD and a decrease in maximum drain current IDmax. During
the stress, traps are found to be generated. We have seen that this degradation is driven mostly by electric field, and current is less relevant to electrical degradation. From a set of our experiments, we have hypothesized that the main mechanism behind device degradation is defect formation through the inverse piezoelectric effect and subsequent electron trapping. Unlike current conventional wisdom, hot electrons are less likely to be the direct cause of electrical degradation in the devices that we have studied. Our studies suggest a number of possibilities to improve the electrical reliability of GaN HEMTs.
Thesis supervisor: Jesus A. del Alamo Title: Professor of Electrical Engineering
Acknowledgements
First of all, I would like to thank my research advisor Professor Jesu's A. del Alamo for giving me this great opportunity to work on a fascinating project with the best people. His wonderful guidance throughout my days at MIT has made me better and better. He has always encouraged me with cheers no matter what I did and no matter how good my result was. I really appreciate his patience and teaching, which has always led me to advance further.
Had it not been for our collaborators at TriQuint Semiconductor and BAE Systems, I could not have done my research at all. They provided us stellar samples to study, and their feedback was amazingly conducive to my research. In particular, I want to thank Dr. Jose Jimenez from TriQuint for giving me such an interesting internship opportunity at TriQuint. I still miss the wonderful summer with the terrific people in Dallas. I also thank Dr. P.C. Chao from BAE for fruitful discussions. I should also thank the Korea Foundation for Advanced Studies for giving me the very first motivation and support for graduate study. I would also like to express gratitude toward all in the del Alamo group. Lab work with J6rg Scholvin was always fun, and discussions with him were always productive. Special thanks to Anita Villanueva for her advice that I really needed to get on track. Dr. Dae-Hyun Kim was to me a second advisor in the group. As the only Korean in the group, he was also like my brother. I also want to thank Joyce Wu and Niamh Waldron who first introduced the original thanksgiving turkey to me. They really made my life richer. I cannot forget to thank our new members Ling Xia and Usha Gogineni, who I will share the rest of my days here with. I am always learning a lot from them.
I truly appreciate friendship and love of my oldest friends in Boston: Wooji, Zerb, Soonbam, Bohee, Monki, Bang (younger to older), and many others, who I have been sharing my life with. They always give me motivation, spirit, inspiration, and energy to go forward. Very special thanks to my friends in Korea: Bbiki, Kichi, Jaepa, KBC, No, Ging, and Goony; they are my heartening supporters. I am such a lucky man to have these fantastic and brilliant friends.
Finally, I would like to thank my loving parents, who are always giving me the kindest cares and the most encouraging support in the world. You always boost up everything I do. I also want to thank my younger brother Hoya, who has been to me sometimes a friend, sometimes a twin brother, and sometimes a teacher. I always get inspired by him. Had it not been for my family, I could not have done anything. I love you so much and hope you are always happy.
This work was made possible by Army Research Laboratory under contract #
Contents
List of Figures...9 List of Tables ... 13 Chapter 1. Introduction... 15 1.1. Introduction of G aN HEM T ... 15 1.2. M otivation ... 16 1.3. Previous Studies ... 171.4. Project Goals and Thesis Outline ... 19
Chapter 2. Experim ental... 21
2.1. Introduction ... 21
2.2. D evices ... 21
2.3. M IT Reliability Test Chip ... 22
2.4. Electrical Experim ents... 24
2.4.1. Experim ental Setup ... 25
2.4.2. Characterization Suite... 27
2.5. Stress Test M ethodology ... 29
2.6. Sum m ary... 31
Chapter 3. D egradation Experim ents... 33
3.1. Overall D egradation Phenom ena... 33
3.2. OFF-state Step-stress... 37
3.3. VDS=O Condition... .. 38
3.4. Other Observations ... 40
3.4.1. Effect of Environm ent ... 41
3.4.2. D egradation of M ISFET ... 42
3.4.4. The Origin of Gate Leakage Degradation ... 47 3.4.5. Effect of LGD .--...-.-...-.-.-.-.--...-...-... 48 3.5. Trapping Behavior... 51 3.5.1. Off-state Stress-recovery ... 51 3.5.2. Enhanced Detrapping ... 53 3.6. Trap Generation... 56 3.7. TLM Step-stress ... 58
3.8. Summ ary of Key Findings... 60
Chapter 4. Degradation M echanism ... 63
4.1. Introduction ... 63
4.2. Inconsistency with Hot-electron Related M echanism s ... 63
4.3. Piezoelectric Effect of GaN ... 64
4.4. Hypothesis for Electrical Degradation of GaN HEM Ts... 65
4.5. Order-of-magnitude Calculation... 67
4.6. Experimental Confirm ation ... 69
4.6.1. LG Dependency in VDS=O State ---... 69
4.6.2. AlGaN Buffer ... 72
4.6.3. XTEM ... 73
4.7. Suggestions for Reliability Improvements ... 75
4.8. Conclusions ... 76
Chapter 5. Conclusions... 77
5.1. Summ ary of Key Findings... 77
5.2. Suggestions for Further W ork ... 80
List of Figures
Figure 1-1. Change of ID and Po0 t in a power soak stress test (data from TriQuint). Stress
condition: 10 GHz, VD=28 V, IDQ=1 5 0 mA/mm, Pm,=23 dBm, P0ut=33.7 dBm... 16
Figure 1-2. Increased current collapse after a stress test (dashed: before stress; solid: after stress) [13]. ... ... .... ... ... 18
Figure 1-3. Degradation mechanism in AlGaN/GaN HEMT under high stress condition [17 ]. ...- -... 19
Figure 2-1. Schematic cross section of GaN HEMT...21
Figure 2-2. M IT reliability test chip ... 23
Figure 2-3. A schematic of the whole experimental setup. ... 25
Figure 2-4. Graphical user interface of a stress experiment program. A window to select the type of stress experiment and to input stress bias conditions is shown...26
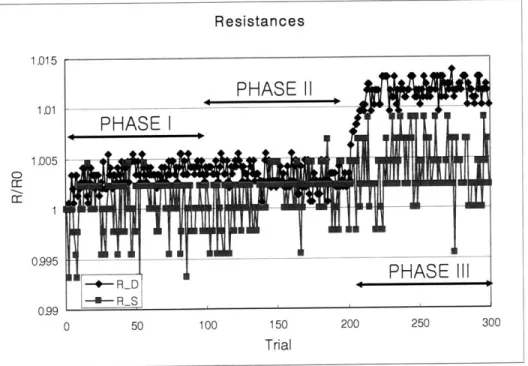
Figure 2-5. Change in normalized drain and source resistance after 300 device characterizations. In phase I, basic figures of merit are extracted. In phase II, full output characteristics are also measured. In phase III, full transfer and sub-threshold characteristics are measured on top of the basic characterization and output characteristics measurement. ... 2 8 Figure 2-6. Conceptual stress schemes: (from left to right) stress-recovery, step-stress, and step-stress-recovery. ... 30
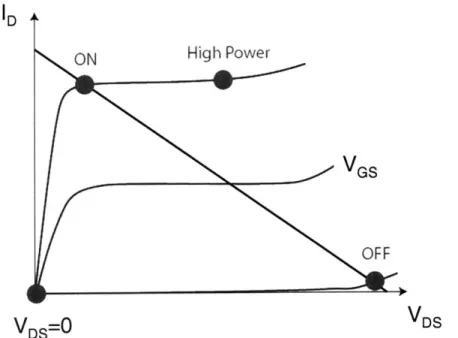
Figure 2-7. Stress bias points: High Power, ON state, OFF state, and VDS=O conditions.... 31
Figure 3-1. Change in normalized IDmax, RD, and Rs in step-stress experiment in the high power state (VDS=5-30 V in 5 V steps, ID=8 0 0 mA/mm, 30 minutes per step). ... 34
Figure 3-2. Threshold voltage change in the same experiment as Figure 3-1...35
Figure 3-3. Output characteristics before (solid) and after (dashed) the same stress test as in Figure 3-1. V GS=-4-2 V (2 V step). ... 35
Figure 3-4. Change in sub-threshold characteristics before (solid) and after (dashed) the sam e experim ent as Figure 3-1... 36
Figure 3-5. Change in gm before (solid) and after (dashed) the same experiment as Figure 3 -1 ... 3 6 Figure 3-6. Change in normalized IDmax, RD, and Rs in step-stress experiment in the OFF state (VDS=5-40 V in 5 V steps, ID=2 5 mA/mm, 30 minutes per step). ... 37 Figure 3-7. Change in normalized IDmax, RD, Rs, and IGaff as a function of stress voltage in a step-stress experiment in VDS=O state (VDG=10-50 V in 1 V steps)...38 Figure 3-8. Stress current of the experiment in Figure 3-7. ... 39 Figure 3-9. Change in IDmax, drain current at stress bias point IDO, and gate current at stress
bias point IGO in another VDs=O step stress experiment...40 Figure 3-10. Change in normalized IDmax in VDS=O stress-recovery experiment with and without nitrogen gas. VGs=-40 V is applied during the stress period of 120 minutes...41 Figure 3-11. Typical IDmax (left) and IGoff (right) degradation of MISFET and HEMT in V Ds=O step-stress experim ents ... 42 Figure 3-12. The correlation between the critical voltage for ID degradation and IG
degradation (triangle: HEM T, circle: M ISFET)...43 Figure 3-13. The correlation between the current collapse increase and IDmax degradation
(triangle: H EM T, circle: M ISFET)... 44 Figure 3-14. Change in IDmax in step-stress experiments and the critical voltage VDGrit for IDmax degradation. ... 46 Figure 3-15. Change in VT in the same experiment in Figure 3-14. In VDS=O state, threshold voltage is not properly extracted after 25 minutes as the minimum drain current became larger than 1 m A /m m ... 46 Figure 3-16. Change in gate leakage current IGoff in the same experiment in Figure 3-14 and the critical voltage for IGaff degradation. ... 47 Figure 3-17. Change in IGoff, IGssl, and IGss2 as a function of stress bias VDG in an OFF state step stress experiment. IGssl is gate leakage current through gate to drain junction, and IGss2 is gate leakage current through gate to source junction. ... 48 Figure 3-18. LGD dependency of source and drain resistance of fresh devices...49
Figure 3-19. Change in normalized RD in OFF state stress experiments on different LGD devices. Five different devices with different LGD=1-5 urn are stressed at VDS=30 V and V GS=-5 V for 50 m inutes ... 50 Figure 3-20. Absolute value of change in RD and Rs as a function of LGD in the same
experim ent as Figure 3-19. ... 50
Figure 3-21. Change in IDmax, RD, and Rs in a stress-recovery experiment in the OFF state
(VDS=30 V, ID= 2 0 mA/mm) for 30 minutes of stress followed by 30 minutes at rest. This
cycle is repeated for three tim es. ... 52 Figure 3-22. Time evolution of IDmax of the device in Figure 3-1. After the end of the stress
experiment in Figure 3-1, the device was put at rest for 304 days before it were measured again. After the first measurement of IDmax, the same stress (VDS=30 V, ID= 8 0 0 mA/mm) w as applied for 2 m ore m inutes... 53 Figure 3-23. Change in IDmax in a stress-recovery experiment on a standard type device stressed at VDS=O and VGS=-30 V for 15 minutes and at rest for 15 minutes. Additional stress is applied for another 10 minutes. From t=20 to 25 min, microscope light was illu m in ated ... 54 Figure 3-24. Change in IDmax in a stress-recovery experiment on a standard type device
stressed at VDS=O and VGS=-30V for 30 minutes. Four stress cycles are repeated with different values of VGS during the 30 minutes recovery phase (0, 1, 2, and 3 V). ... 55 Figure 3-25. Detrapping time constants in VDS=O stress-recovery experiments...55 Figure 3-26. Change in IDmax and stress bias of a VDS=O step-stress-recovery experiment.
VGs=-15-- 40 V is applied for stress, and -10 V diagnostic voltage pulses are applied during the recovery phase. The step size is -2.5 V, and the device is stress for 10 minutes in each step. To expedite detrapping, microscope light is turned on during the test...57 Figure 3-27. Total damage and current collapse produced by diagnostic pulse as a function of th e stress b ias...5 8 Figure 3-28. A schematic picture of a HEMT and a TLM used for the comparison. LGD of the HEM T is identical to the length of the TLM ... 58
Figure 3-29. Change in I-V characteristics of the TLM before and after the experiment of Figure 3-30. The device was step-stressed at V=20-26 V for 140 minutes...59 Figure 3-30. Change in IDmax of a TLM and a HEMT and low field resistance of the TLM.
The HEMT is stressed at VDS=20-2 6 V (1 V step, 20 min/step) and ID=8 0 0 mA/mm. The TLM is stressed at the same voltage, but the current is around 1.7 A/mm. The length of the TLM (3 um) is the same as the gate-drain gap of the HIEMT. ... 60 Figure 4-1. Schematic conduction band diagram of AlGaN/GaN heterostructure [23]...65 Figure 4-2. Vertical electric field under the gate edge and produced tensile strain due to inverse piezoelectric effect. ... 66 Figure 4-3. Comparison of measured critical thicknesses for strain relaxation in A lG a1_N /G aN [24]...68
Figure 4-4. Gate length dependence of degradation in VDS=O step-stress experiments. Different gate length devices (LG=0.25, 0.65, and 1.15 um) are stressed at VDs=0 and VGS=-15-34 V (-1 V step, 5 min/step). The threshold of the degradation increases with LG. ... 70 Figure 4-5. Overlap of strain field at the center of the gate region in the VDS=0 state. ... 70 Figure 4-6. Change in RD in stress experiments on different gate length devices (LG=0.25,
0.35, 0.65, and 1.15 um) in VDS=O state (upper left), in OFF state (upper right), and in high power state (bottom). Stress conditions are VGS=-30 V in the VDS=0 state, VDS=35 V and
VGs=-5 V in the OFF state, VDs=2 5 V and ID=8 0 0 mA/mm in the high power state. These devices are stressed for 50 m inutes ... 71 Figure 4-7. Total damage as a function of stress bias in VDS=0 step stress experiment on type A1 (GaN buffer) and type A3 (AlGaN buffer) devices...72 Figure 4-8. Output power degradation of 400 um type Al devices (baseline structure, GaN buffer) and type A3 devices (AlGaN buffer). The devices are stressed at Po0 t=5 W/mm, V DS= 28 V , f= 10 G H z...73
Figure 4-9. XTEM images of a degraded GaN HEMT. Left: source side; right: drain side [7 ]. ... 7 4
List of Tables
Table 2-1. Definition of device parameters measured by the characterization suite...27 Table 2-2. Changes in important figures of merit after 300 runs of the device characterization suite...29
Chapter 1. Introduction
1.1. Introduction of GaN HEMT
Traditionally, GaN is used for optoelectronic devices. GaN-based light emitting diodes and laser diodes have become very important devices in lightning and blu-ray technology. GaN technology for optoelectronics has already achieved the state of mass production. Recently, GaN high electron mobility transistors (HEMT) have also become of great interest for high-voltage switching and RF power applications. As a result of the large band gap (-3.4 eV) and high breakdown electric field (>3x10⁶ V/cm) of GaN, GaN-based devices can operate at a voltage as high as 120 V [1]. Also, due to strong piezoelectric effect and spontaneous polarization of both GaN and AlN, high sheet carrier density (-1013 cm-2) can be achieved at the AlGaN/GaN heterointerface without any doping. In addition, high electron mobility (-1500 cm2/V-s) and high saturation velocity (-2x 107 cm/s) make GaN-based devices
suitable for high power amplification at high frequencies [2]. A large conduction band offset between AlGaN and GaN is also desirable for carrier confinement in the channel. With all these characteristics, AlGaN/GaN HEMTs have already been demonstrated with an output power density of 10.7 W/mm at 10 GHz [3]. Recently, GaN-based HEMTs have also expanded their frequency range -a power density of 2.1 W/mm has been demonstrated at 80.5 GHz [4]. This outstanding performance makes these devices of great interest for high-power, high-frequency applications such as WiMAX or WLAN base stations and radars.
1.2. Motivation
The greatest impediment today preventing the wide deployment of GaN HEMT technology is its limited electrical reliability. As GaN is still a relatively new material system for electronic devices, many problems in material quality and process controls have not been solved yet. As shown in Figure 1-1 for some of the devices studied in this research, output power as well as the drain current decreases, and device characteristics degrade even just after a few hours under typical RF device operation. In particular, because GaN HEMTs are usually operated at high voltage and high current, high reliability is not only demanding but also challenging, and designs that maximize reliability are absolutely needed. In order to tackle this reliability problem, we need to understand physical failure mechanisms. However, at the present time, there is insufficient understanding of the fundamental mechanisms limiting the reliability of GaN HEMTs.
0- 0
-0.2-
--
-10
-+0E
O
-0.4-
ID---
20
E
E
a-
-0.6-
-30
-0.8-
---
40
-1-
-- 50
0
5
Time (hr)10
15
Figure 1-1. Change of ID and P0,u in a power soak stress test (data from TriQuint). Stress condition:
1.3.
Previous Studies
In previous studies, it has been shown that GaN HEMTs degrade significantly after bias stress test. In particular, reduction of drain current and output power was observed [5-9]. This degradation is reported to be accompanied by an increase in drain resistance although source resistance is relatively unaffected by electrical stress [5, 10]. Along with ID
degradation, transconductance degradation is observed [5, 11, 12], but there have been no agreement on the changes in threshold voltage. Also, after device operation, increased trapping behavior has been observed [11, 13]. On the other hand, no obvious ohmic contact degradation has been found after device degradation [6, 10]. Although there have been some studies on long term reliability [11], most of the reliability studies have focused on device degradation in a relatively short period of time, as GaN HEMTs normally degrade within a few hours of device operation.
Many of the previous studies on reliability have suggested that hot electrons are at the center of device degradation. The prevailing hypotheses are hot-electron induced trap formation [11] and electron trapping at the surface [5]. Sozza et al. have proposed that an increase of trap density at the surface region between gate and drain is the origin of device degradation [11]. They have also postulated that the same type of trap that causes current collapse is involved in the degradation mechanism. They have attributed this increase in trap density to hot electron effects. Also, as shown in Figure 1-2, it has been observed that current collapse increases after a bias stress test [13]. The current collapse is a temporary decrease of drain current after applying high voltage to the device.
- 202
600
EAl
40DD 5 10 15 Drain-Source Voftage (V)Figure 1-2. Increased current collapse after a stress test (dashed: before stress; solid: after stress) [13].
It has been reported that GaN HEMTs suffer from current collapse. It is widely believed that under high voltage, surface states between the gate and the drain trap hot electrons. These trapped electrons at the surface deplete the channel in the extrinsic drain resulting in a reduction of the drain current [14]. SiN passivation is known to reduce this current collapse problem. It has also been argued that electron trapping in the bulk causes the current collapse [15]. Another explanation for the current collapse is a reduction of tensile strain in the extrinsic device under negative gate bias [16].
Kim et al. have also argued that device degradation is attributed to hot electron trapping [5]. They have observed an increase in drain series resistance and suggested that this increase is caused by an increase of channel depletion due to electron trapping at the surface region between gate and drain [17]. As shown in Figure 1-3, hot electrons can gain enough energy to escape the channel and get trapped on the surface. These electrons form so called virtual gate [14] and deplete channel carriers in the drain extrinsic region.
SiN Passivation
Charge accumulation
Figure 1-3. Degradation mechanism in AlGaN/GaN HEMT under high stress condition [17].
However, the detailed mechanisms behind the device failure are not still well known, and few solutions to this problem have been proposed to date. In most of the papers that suggests hot electrons as the main cause of the degradation, little experimental or theoretical proof has yet been provided. In fact, experiments that contradict to hot-electron related mechanisms will be presented in this thesis.
1.4.
Project Goals and Thesis Outline
In this research, we have carried out systematic studies to understand the precise mechanisms of device degradation. Examining degradation phenomena in different stressing regimes on different kinds of devices, we especially focus on fundamental physics underlying device failure. Upon identifying the responsible physical mechanisms, we will then attempt to identify process and device design changes to improve the electrical
reliability of GaN HEMTs.
This thesis will be organized as following: In chapter 2, GaN HEMT devices that are used in this study will be briefly described first. A reliability test chip that has been designed and
fabricated will be also introduced. Then, the experimental setup will be summarized, and a characterization suite that measures device parameters of the device under test will be presented. Finally, the stress test methodology will be explained.
In chapter 3, degradation experiments and their results will be discussed. First, it will be shown how devices degrade. Then stress experiments under different bias conditions will be presented. Experiments on devices with different designs and under different environment will be also studied. Trapping behavior will be discussed, and stress tests on other test structure will be also shown in this chapter.
Finally, a hypothesis to explain the degradation mechanisms will be proposed and supporting experiments will be discussed in chapter 4. The conclusions of this research will be presented in chapter 5.
Chapter 2. Experimental
2.1. Introduction
This chapter begins with the description of the GaN HEMTs that are used in this study. A reliability test chip that has been designed in the course of this research will be described. Finally, a device characterization suite and the different stress test schemes used in this work will be discussed.
2.2. Devices
iN
passivation
2DEG
GaN
Figure 2-1 shows a schematic cross section of the GaN HEMTs used in this study. These devices are fabricated by TriQuint Semiconductor and BAE Systems. The heterostructure is grown on a SiC substrate. GaN buffer and active channel layer is followed by AlGaN barrier layer below which 2-D electron gas is formed. Between the gate and the AlGaN layer, there is a thin GaN cap layer. Source and drain ohmic contacts are formed by annealing, and the surface is passivated by a SiN layer.
Standard devices that are mostly investigated in this study have 0.25 um (TriQuint) / 0.15 um (BAE) gate length and 2x25 um gate width. Source to drain spacing is 4 um. A typical virgin TriQuint device has a current-gain cut-off frequency fT around 40 GHz, and IDmax is
about 1.2 A/mm. The output power is about 8 W/mm, and PAE is 62 % at 10 GHz when the device is biased at 40 V [7].
2.3. MIT Reliability Test Chip
In order to carry out a systematic study of reliability, a reliability test chip was designed (Figure 2-2). Other than standard devices described in the previous section, HEMTs with different geometries are included in this chip:
" Gate length: standard, 2x, 5x, lIx, and 20x of standard device * Gate width: 2x12.5 um, 2x25 um, 2x50 um, and 2x100 um
* The number of fingers with 100 um unit finger width: 2, 4, 6, and 10 * Gate to drain gap: 1, 2, 3, 4, and 5 um
* Source to gate gap: 0.5, 1, 1.5, 2, and 2.5 um * Different gate orientations: 30', 600, 900
* Special devices: side-gate HEMT that has a side-gate to probe the hole current due to impact ionization, and FATFET that has a long gate length to measure Hall mobility
.**..'.-"..., N
LIL
Figure 2-2. MIT reliability test chip.
As study of degradation of Transmission-Line Method (TLM) has revealed important degradation mechanisms of InGaAs and GaAs HEMTs [18, 19], we have also designed different types of TLMs:
" Standard TLMs: W=25 um, 50 urn. L = 3,5,7,9, 11 urn
" Tapped TLMs: W=25 urn, 50 um. A tap is used to monitor the voltage at the
midpoint of TLM.
" Sidegate TLMs: W=25 um, 50 um. A side gate to probe the hole current due to
impact ionization. r I T -'S I J.7 0 Rol F14,00-1 7:R S 7XZZ X2S
_-37
With these variations, we can investigate the effect of device parameters as well as device physics. Also, we can sort out where the degradation takes place, what is the key signature of degradation, and what are the key dependencies (current, voltage, etc) of degradation. This test chip was incorporated in the regular process development mask used in TriQuint and BAE, and 41 of these chips are fabricated in every wafer that they produce. For different wafers, these chips were cut out and sent to MIT for this study.
2.4. Electrical Experiments
The basic concept of our experiments is the following: First, we fully characterize a fresh device before stressing it. This first characterization is benign enough not to damage the device. Then, we start stressing the device in a certain bias condition, and once in a while, we stop stressing the device and run a short device characterization which measures important figures of merit. This measurement runs in a short time (< 1 min) and only produces very minor changes of the characteristics of the device. Finally, after the stress test or in some experiments at some of the important points during the stress test, full characterization is again run and compared to the characteristics before the stress.
For this, we have developed a benign device characterization suite. The characterization suite is an automated program that measures several figures of merit of the device under test in different manners. The key figures of merit include IDmax, Rs, RD, and VT. It also
measures full I-V characteristics at selected times along the stress experiment (e.g. at the beginning and at the end of the experiment).
2.4.1. Experimental Setup
Bias tee DUTPC
Probe stationHP4155
Temperature
Controller
Figure 2-3. A schematic of the whole experimental setup.
A schematic diagram of our experimental setup is shown in Figure 2-3. It consists of a
HP4155 semiconductor parameter analyzer with a HP41501A high power expander unit and a Cascade Microtech probe station. The chuck on the probe station is connected to temperature controller unit that regulates its temperature from -60'C to 200'C. An enclosed gas chamber enables performing measurements with the device under nitrogen and under controlled illumination conditions. As the devices under study are designed to operate at high power and high frequency, we use Picoprobe GSG 125 um microwave probes with a bias tee installed in the gate side in order to avoid any oscillations that may occur during the measurements. The HIP4155 is controlled by a Windows OS PC through a GPIB connection. Some experiments were performed in air or under the microscope light illumination.
The characterization suite and the stress experiments were written in Agilent VEE 7.0, which runs the whole system. Stress experiments are programmed in a way that users can design new experiments easily without changing the structure of the whole program. For example, several drop-down options, such as step-stress, stress-recovery, constant ID stress, and constant VD stress, are provided for user-friendliness and efficient experiment design as shown in Figure 2-4.
Agile nt V[ Pro stress_1_30. 240_TQ.vee
E dit Vitew Debug Flow ece System IYO Data Display _lIndow telp
0 Ug JRi 76 R e 12 W A A 0 A 2 Root - 9 Main El rat + Characterization + Initialize s etup + E stressing " L Local user Functions
" Li Glabais
-Stressing Condition (UserO t
BackColor Light Bluej Title Stressing Condil
TrigMode Degrees PanelBackgr [nnae PaneiDrw Fale PereGrrdSrz 10 PopupMoyei True PopupPaner UserObject
PopupPaner Object Tit
PopupPaner Object Title Te-PopupPanrer* Object Titl
ShowPanelO False
Title
TiMe string of the object
Ready
' 9 11 f A
input VD=0 for open drain mode 1V0=0 for open gate mode
CanstVG, Vo Sires
Const ID
C.st VG
-L
m__ _ExecMode: VEE4 MOD
(. I (intPart-0)+1)*01
10
F30
Figure 2-4. Graphical user interface of a stress experiment program. A window to select the type of stress experiment and to input stress bias conditions is shown.
L Fo Then 0 Ise F F__ -ii -_-L = ElseE se Ii g
2.4.2. Characterization Suite
The characterization suite commands the HP4155 to measure figures of merit and full I-V curves. Short device characterization is done every 1 or 2 minutes in the middle of a stress experiment to keep track of device parameters. It typically takes less than 1 minute to extract all the desired figures of merit. Most measurement techniques for extracting device parameters follow the previous work on reliability of GaAs PHEMT [19], and the
definitions of all figures of merit are briefly summarized in Table 2-1.
Parameter Definition
IDmax Drain current at VDS= 5 V and VGS= 2 V (TriQuint) / 1 V (BAE)
Rs Source resistance measured with IG=2 0 mA/mm RD Drain resistance measured with IG=2 0 mA/mm
RTOT Total resistance between drain and source with gate floating.
RCH Channel resistance. RTOT-Rs-RD
VT VGS-0.5VDS when ID= mA/mm at VDS=O. V
SS Sub-threshold slope at VDS=O.1 V and ID=1 mA/mm
DIBL VTIVDS=0.1 V - VTIVDS=5 V
gmpk Peak transconductance dID/dVGs at VDS=5 V VGpk Gate voltage where gm is maximum at VDS=5 V
gmpk2 Peak transconductance dID/dVGs at VDS=O. 1 V
IDmin Minimum drain current in sub-threshold curve at VDS=O.1 V
VGfin Gate voltage where ID is minimum at VDS=O 1 V
IGVT Gate current at VGS=VT and VDS=O- 1 V
VGon Gate voltage where ID=1 uA/mm
IGoff Gate current at VGS=-5 V and VDS=O- 1 V
IDss Drain current at VDS=5 V and VGS=O V
Table 2-1. Definition of device parameters measured by the characterization suite.
The device characterization must be benign in that it must produce reliable and reproducible measurements without affecting the device under test. For this, the measurement conditions have to be selected carefully, and the effect of FOM extraction have been studied in detail. In our work, extensive repeated characterizations have been run on virgin devices to check if the characterization suite really does not produce any damage to the device.
Resistances 1.015 PHASE 11 1.01 PHASE I 1.005 Q 0995 nag0 0 50 100 150 200 250 300 Trial
Figure 2-5. Change in normalized drain and source resistance after 300 device characterizations. In phase I, basic figures of merit are extracted. In phase II, full output characteristics are also measured. In phase III, full transfer and sub-threshold characteristics are measured on top of the basic characterization and output characteristics measurement.
Figure 2-5 describes such a typical experiment. In phase I, basic figures of merit including IDmax, Rs, RD, VT, and IGoff are extracted 100 times in a row. In phase II, on top of this basic parameter extraction, output characteristics are measured. Finally, in phase III, transfer characteristics are also measured in addition to the measurements done in phase II. As shown in Figure 2-5, the characterization suite only produced less than 1 % changes in Rs and RD in phase I, and less than 2 % even if the device is fully characterized 300 times in a row (this includes extraction of full I-V characteristics, Phase II & III). The changes in the most important device parameters are summarized in Table 2-2. Although not perfect, the characterization suite produces only minor changes in the device parameters, compared to typical changes during the stress test, which is usually in excess of 20 %. Also, from Figure 2-5, we can see that the measurements obtained from the characterization suite are reproducible and reliable.
+RD PHASE III
IDmax VT Rs RD
Basic (100 times) -0.3 % +6 mV +0.3 % +0.4 %
Basic + Output (100 times) -0.8 % +4 mV 0 -0.1 %
Basic + Output + Transfer (100 times) -0.9 % +2 mV +0.2 % +0.9 %
Total (300 times) -2 % +12 mV +0.5 % +1.2 %
Table 2-2. Changes in important figures of merit after 300 runs of the device characterization suite. In addition, this characterization suite can be easily adjustable to new device process designs, so that a new device with totally different characteristics can be easily measured by simply changing configuration parameters such as the bias point to extract IDmax.
2.5. Stress Test Methodology
In this thesis, we have focused on DC reliability studies. Rather than a simple stress test in which the stressing conditions are kept constant during the test, several electrical stress schemes have been investigated in the course of this research. These are graphically described in Figure 2-6.
Stress-recovery type of experiments in which stress is followed by a recovery period is performed to study how a device degrades as well as how it recovers from the degradation. In this type of experiment, a specific stress bias is applied in the stress phase, and this stress is removed in the recovery phase (Figure 2-6 left) while the device is characterized.
As discussed in previous works [18, 19], a step-stress scheme has been utilized to maximize productivity. In this type of experiment, the strength of the stress parameter such as voltage or current is stepped up from a smaller value to larger values in order to see the effect of that stress parameter over a wide range of values in a single device (Figure 2-6 middle). From this type of experiment, we obtain great insight into physical mechanisms. Finally, step-stress-recovery experiments have also been carried out (Figure 2-6 right).
Vstress Vstress A Vstress A
0 0 0
0 time 0 time 0 time
Figure 2-6. Conceptual stress schemes: (from left to right) stress-recovery, stress, and step-stress-recovery.
Regarding the period of stress, we have mostly focused on short-term degradation which happens within a few hours. We emphasize this short-term degradation because GaN-based HEMTs are known to degrade in relatively short period of time. In fact, we have seen significant degradation even within an hour of stress. However, medium-term stress experiments (on the order of one or two days) have also been performed in order to investigate phenomena which take place in a relatively longer period of time.
Different stress bias conditions were studied: high power state (high VDS, high ID),
ON-state (low VDS, high ID), and OFF-state (high VDS, low ID). In high power condition, we
tried to simulate the RF power amplifying operation in a more severe way. By investigating both ends of the load line, ON state and OFF state, we can study where the most stressful point is during a real RF operation. In addition, we have focused on the VDs=O state in which negative gate voltage is applied. In this condition, we can stress the both sides of the device simultaneously with a low current but a high voltage. These conditions are shown in Figure 2-7 relative to the position of the RF power load line that is typically followed in RF power applications.
Unless specified, all of our experiments are done at room temperature, with the device inside a dark chamber with nitrogen gas injected into it.
I
ON High Power
VDS = VDS
Figure 2-7. Stress bias points: High Power, ON state, OFF state, and VDS=O conditions.
2.6. Summary
In this chapter, we have introduced the GaN HEMT devices, the reliability test chip, and the electrical experimental setup used in this thesis. In order to study degradation phenomena of GaN HEMTs, we have developed a characterization suite. Although slight changes are produced by a number of repeated device characterizations, we have shown that the characterization suite performs reliable and benign measurements of GaN HEMTs. Finally, we have introduced stress test methodologies that were used in this study. In the next chapter, results of degradation experiments will be shown, and basic degradation phenomena will be discussed.
1
A
VGS
Chapter 3. Degradation Experiments
In the last chapter, we have introduced the experimental setup and the characterization and stress protocols for studying electrical reliability of GaN HEMTs. In this chapter, we describe several degradation experiments. Experiments performed in various stress bias conditions on HEMTs and TLMs are presented, and their results are discussed. Also, we discuss the effects of device geometries and environment. Based on the results, electron trapping behavior is investigated as a basic degradation mechanism.
3.1. Overall Degradation Phenomena
Figure 3-1 and Figure 3-2 show the overall result of a typical stress test. This is a high power step-stress experiment that is performed on a standard type device. In this experiment, the drain bias is stepped from 5 V up to 30 V. Stress current is set at 800 mA/mm throughout the experiment by adjusting the gate bias. As it can be seen in Figure 3-1, source resistance Rs increases little, whereas drain resistance RD shows larger change as the device is stressed. The maximum drain current IDmax decreases. As shown in Figure 3-2, the threshold voltage first shifts positive at lower stress voltage, but it then shifts negative for VDS>20 V.
1.3
1.2RD-1.1
-E 1 E.
0.9
'Dstress= 8 0 0 mA/mm 'Dmax
0.8
0
30
60
90
120
150
180
Time (min)
Figure 3-1. Change in normalized IDx, RD, and Rs in step-stress experiment in the high power state
(VDS=5- 3 0 V in 5 V steps, ID=8 0 0 mA/mm, 30 minutes per step).
Figure 3-3 shows the change in the output characteristics before and after the stress test. As it can be seen, drain current significantly decreases after the stress. As it can be seen in Figure 3-4 and Figure 3-5, the sub-threshold slope remains relatively constant, while the
maximum transconductance decreases after the stress test. For the rest of this study, we will
mostly focus on the changes in IDmax, Rs and RD.
It is interesting to note in Figure 3-1 that degradation is negligible at low voltage (ON-state) in spite of the large current. It then seems that voltage is a more important factor for device degradation than current. This result motivated us to do similar experiments with much lower current, in the OFF state. This will be discussed in the following sections.
30 V 10V 15 V 20 V 25 V
0.3
0.25
-0.2
--0.15
0.1
0.05
-0
0
30
60
90
Time (min)
120
150
1
Figure 3-2. Threshold voltage change in the same experiment as Figure 3-1.
E E E 0 1200- 1000-800 600 400 200 0 C 1 2 3 VD (V) 4
Figure 3-3. Output characteristics before (solid) and after (dashed) the same stress
3-1. VGS=-4-2 V (2 V step). test as in Figure
35
30
-25
- 20,5
-150
-
10
- 5
-0
30
5 . AV --+VDO-10 E E 0 102 100 102
VDS=5
-VDS =0.1 V 8 -6 -4 -2 0 VG (V)Figure 3-4. Change in sub-threshold characteristics before (solid) and after (dashed) the same experiment as Figure 3-1.
-4 -3
VG (V)
-2 -1
Figure 3-5. Change in gm before (solid) and after (dashed) the same experiment as Figure 3-1.
4001 300 200 E E 0)
100F
v
-5 VDS=5
V
VDS=0. 1 V
0-3.2. OFF-state Step-stress
VDS=5 V 10 V 15 V 20 V 25 V 30 V 35 V 40 V1.3-
1.2-RD -1.1-CZRS
Ea 1 0Dmax0.8
0
60
120
180
240
Time
(min)
Figure 3-6. Change in normalized IDmax, RD, and Rs in step-stress experiment in the OFF state (VDS=5- 4 0 V in 5 V steps, ID=2 5 mA/mm, 30 minutes per step).
Figure 3-6 shows the result of an OFF state step-stress experiment. In this experiment, the stress current is 25 mA/mm, which is about 3 % of that in the high power stress experiment of Figure 3-1. We also find that in the OFF state, the source resistance shows little degradation. However, although the stress current is much smaller, the degradation in RD and IDmax is comparable to that in the high power state (see Figure 3-1). This result confirms that voltage, or electric field, is the main driver for device degradation, and current is an accelerating factor [9]. However, it is not clear whether the effect of current is supplying hot electrons to the system or increasing the junction temperature. Our results are obviously inconsistent with hot-electron based mechanisms in that degradation in OFF state is comparable to that in high power state in spite of much fewer hot electrons in the channel.
3.3. VDS=O Condition
1.5
-
1.E+02
1.E+01 RD1.25 -
1.E+00
Rs*1
1.E-02 E
1.E-03
1.E-04 2S0.75
-Iof--1E0
_Z1.
E-03
1 .E-04
0.5 1.E-0710
20
30
40
50
VDG(V)
Figure 3-7. Change in normalized IDmax, RD, Rs, and IGoff as a function of stress voltage in a step-stress experiment in VDS=O state (VDG=10-50 V in 1 V steps).
Stressing a device in VDS=O condition is interesting in that no current flows through the channel, and both sides of the device can be stressed at the same time. Figure 3-7 summarizes the results of a VDS=O step-stress experiment. In this experiment, VGS is stepped from -10 V to -50 V. The voltage step size is -1 V, and the device is stressed for one minute at each step. As expected, both Rs and RD degrade by about the same amount. Interestingly, we have seen no IDmax and series resistance degradation up to around 25 V, and degradation sharply starts beyond that voltage. Because of this, we define this sudden onset of degradation as taking place at a "critical voltage". Interestingly, IGoff, which is defined as gate current at VDS=O-1 V and VGs=-5 V, also shows a sudden very large increase at around the critical voltage. This simultaneous degradation in ID and IG is
150
100
E
50
DOE
E
4-0
*E -50
--GO-100
--150 _--IGO
-I-DO-200
10
20
30
40
50
VDG(V)
Figure 3-8. Stress current of the experiment in Figure 3-7.
As shown in Figure 3-8, the drain current at -27 V, where degradation becomes apparent, is about 13 mA/mm, and it is 104 mA/mm at -40 V in this particular experiment. This might suggest that degradation is driven by the relatively large current which can then produce hot electrons. However, two observations are contradictory to that argument: first, degradation does not suddenly increase around VDG=3 5 V where stress currents again suddenly increase; second, degradation keeps increasing after 40 V without any signature of saturation, while the stress currents almost saturate.
Moreover, it has been found that degradation of IDmax and series resistances is not correlated to the stress current in similar VDS=O stress experiments carried out in other devices. In fact,
in a VDs=O experiment shown in Figure 3-9, very large degradation (23 % of IDmax
reduction at -27 V) is introduced in spite of negligible drain current of less than 0.1 mA/mm, which is three orders of magnitude less than the stress current in the experiment of Figure 3-7. Comparing this number to the experiment in Figure 3-7, we can see that the same amount of degradation can happen regardless of the stress current. This result again
3.4.1. Effect of Environment
In order to see the effect of atmosphere, we have performed a VDS=O stress-recovery experiment in air and compared the result with the experiment performed in nitrogen environment. As shown in Figure 3-10, we have found that degradation is the same in air as in nitrogen environment. This result is different from the GaAs PHEMT case, in which degradation is much more pronounced in air [19] than in N2. This is consistent with a degradation mechanism for the GaN HEMT that is not of a surface type although it is also possible that these devices have a much more impermeable SiN passivation layer that protects the device from the environment in a much more effective way than the GaAs PHEMTs that we have studied [19].
1
0.9
0.8
E00.7
0.6
0.5
0.4
(
Vr=-40 V -- N2 Air-)
60
0 V120
180
-40 V240
Time
0 V -40 V300
(min)
0 V360 420 480 540
Figure 3-10. Change in normalized IDmax in VDS=O stress-recovery experiment
nitrogen gas. VGS=-40 V is applied during the stress period of 120 minutes.
with and without
-3.4.1. Effect of Environment
In order to see the effect of atmosphere, we have performed a VDS=O stress-recovery experiment in air and compared the result with the experiment performed in nitrogen environment. As shown in Figure 3-10, we have found that degradation is the same in air as in nitrogen environment. This result is different from the GaAs PHEMT case, in which degradation is much more pronounced in air [19] than in N2. This is consistent with a degradation mechanism for the GaN HEMT that is not of a surface type although it is also possible that these devices have a much more impermeable SiN passivation layer that protects the device from the environment in a much more effective way than the GaAs PHEMTs that we have studied [19].
Ve_=-40 V 0 V -40 V 0 V -40 V
D
60 120
180 240
Time
Figure 3-10. Change in normalized IDax in VDS=O stress-recovery experiment with and without nitrogen gas. VGS=-40 V is applied during the stress period of 120 minutes.
0 V 1
-
0.9-
0.10.8-X E..00.7
E0.5-0.4
N2 Air360
300
(min)
420 480
540
-7
3.4.2. Degradation of MISFET
1.1 1 0' .9 _P0.8 _P0.7 0.6 25 20 25 30 35 40 45 VDGstress (V)Figure 3-11. Typical IDmax (left) and IGoff (right) stress experiments. 1-3 10 S10 < 5 HEMT 10 MISFET 10 15 20 25 30 35 40 45 VDGstress
degradation of MISFET and HEMT in VDS=O
step-We have investigated the degradation of MISFETs and compared it with the degradation of HEMTs. We have measured devices on a wafer that has both normal HEMTs (left half) and MISFETs (right half). The process is identical except that one half of the wafer has SiO2
insulating layer between gate metal and semiconductor, while the other half does not.
Forty one devices across the wafer are step-stressed at the VDS=O condition. The gate voltage VGS is stepped from -15 V to -45 V, and the drain voltage VDS is fixed at 0 V. The step size is -1 V, and the device is stressed for 30 seconds in each step. After each step, two
figures of merits are measured: IDmax (ID @ VDS=5 V, VGS=2 V) and IGoff (IG @ VDS=1 V, VGS=-5 V). Figure 3-11 shows typical IDmax and IGoff degradation of both types of devices.
As can be seen, the critical voltage for IDmax degradation of MISFETs is higher by about 10 V than that of HEMTs. Also, the gate leakage current of HEMTs starts to increase at a lower voltage than in the case of MISFETs. In fact, we find that the critical voltage for IDmax degradation exhibits a strong correlation with the critical voltage for IGoff degradation as shown in Figure 3-12. The average and the standard deviation of the critical voltage for
MISFET
IDmax degradation of HEMTs are 25.6 V and 4.1 V, respectively. For MISFETs, the average is 36.3 V and the standard deviation is 5.0 V.
We have also measured the current collapse by applying -10 V voltage pulse to the gate before and after the stress. As shown in Figure 3-13, a device with larger IDmax degradation shows greater increase of the current collapse, which gives us a clue that degradation is somehow correlated to increase in trap density. This is examined in more detail in section 3.6.
Although MISFETs show better DC reliability, they turn out to be worse in RF power soak measurements [20]. However, it is still not clear if the worse RF degradation results from higher VDG due to more negative threshold voltage of MISFETs. Because these power soak experiments have been done with the same drain bias voltage and drain bias current, VGS of MISFETs are more negative than that of normal HEMTs, resulting in higher VDG. Although we have found that voltage is the main driver for DC degradation, further investigation is needed to sort out other mechanisms in RF stress, if any.
40 0 30- 20-10 0 1 0 10
Figure 3-12. The correlation between
(triangle: HEMT, circle: MISFET)
20 20 3030
V for G (V)
the critical voltage for
40
ID degradation and IG degradation
0 0 0-o ~ O0o 0 0 0 A 0 HEMT A MISFET AA A
15 C. 10 HEMT A MISFET A AA Z0 -_ 00 AA A AA 0 -10 -20 0 20 40 60 80
'Dmax degradation after Stress
(%)
Figure 3-13. The correlation between the current collapse increase and IDmax degradation (triangle: HEMT, circle: MISFET).
3.4.3. Critical Voltage in other Stress Bias Conditions
In section 3.3, we have observed a critical voltage beyond which a device starts to degrade. In the VDS=O condition, this voltage is about 20~25 V. However, this critical voltage seems to be too low because devices operate normally at 30 V without degrading that much. With standard devices (W=2x25 um, LG=O-25 um, LSG=LGD=2 um), we have compared the critical voltage of degradation under different stress conditions: high power state, OFF state,
and VDS=O state.
Figure 3-14 shows the IDmax degradation in three different step-stress experiments. The stress bias conditions for these experiments are summarized in Table 3-1. In these experiments, the devices have been stressed for 1 minute in each step, and the step size was
Table 3-1. Stres
Stress condition
VDS=O state VGs=-10--50 V
OFF state VGS=-7 V, VDS=10-50 V
High power state ID=8 0 0 mA/mm, VDS=10-50 V
s bias condition for three different step-stress experiments.
As it can be seen in Figure 3-14, VDGcrit is 25 V for VDS=O state, 38 V for OFF state, and 35
V for high power state. Here, this critical voltage is defined as the voltage at which a change in the slope of IDmax evolution curve occurs. In high-power condition, this definition
is somehow ambiguous as the device degrades even at lower voltage. However, the part of decrease in IDmax before VDG < 30 V is due to large positive shift of threshold voltage as
shown in Figure 3-15, and this positive shift is only observed in the high-power state stress. As gm is about 128 mS/mm around VDS=5 V and VGS=2 V where we measure IDmax,
threshold voltage shift of +0.5 V results in 64 mA/mm reduction of IDmax. This change is
responsible for about half of the change in IDmax in VDG<30 V. At around VDG=3 5 V, there is also a change in the slope of IDmax evolution although the threshold voltage is relatively
constant beyond that point.
Figure 3-16 shows the time evolution of the gate leakage current. The critical voltages for sudden gate leakage current increase are 25, 38, and 36 V for VDS=O state, OFF state, and high power state, respectively, which are consistent with the critical voltage for IDmax
degradation mentioned above. This critical voltage for IGoff degradation is defined as the voltage at which there is a abrupt change in IGoff- This large increase of gate leakage current turned out to be unrecoverable, and the correlation between the critical voltage for ID and IG degradation suggests a common origin. Although a different mechanisms for ID degradation may seem to exist in high power state, this abrupt gate leakage degradation around VDG=3 6 V justifies our previous definition of the critical voltage for ID degradation in high power state. We can see that the critical voltage for degradation in the normal operating configuration, OFF state and high power state, is about 10-15 V larger than that in VDS=O condition.
Vcrit=25 V (VDS=O) Vcrit=38 V (OFF)
1-0.9
~x
0.8
-crit=35 V(High po 0.7--E0.6-0.5
-0
10
20
30
40
Time (min)
Figure 3-14. Change in IDmax in step-stress experiments and the critical voltage VDGrit for IDmax
degradation.
0.6
0.4
High power state
0.2
--0 - OFF state VDS=Ostate
-0.2
-0
10
20
30
40
Time (min)
Figure 3-15. Change in VT in the same experiment in Figure 3-14. In VDS=O state, threshold voltage
is not properly extracted after 25 minutes as the minimum drain current became larger than 1
1.E+00
-1.E-01
-1.E-02
-
ci=38 V (OFF)E
E 1.E-03
-S1.
E-04 - ri=2 5 V (VDS=O)0
-
1.E-05
-1. E-06I
Vcrit=36
V(High power)
1. E-07-I
0
10
20
30
40
Time (min)
Figure 3-16. Change in gate leakage current IGoff in the same experiment in Figure 3-14 and the critical voltage for [Goff degradation.
3.4.4. The Origin of Gate Leakage Degradation
In section 3.4.3, we have shown that gate leakage current degrades permanently after applying a certain high voltage. In order to confirm which junction is responsible for this degradation, we have done an OFF state step-stress experiment in which we have measured two more figures of merit: IGssl is the gate current at VDS=5 V and VGS=O V; IGss2 is the gate current at VDS=-5 V and VGS=-5 V. As VGS for IGss, and VGD for IGss2 are zero, all the gate current is from the other junction, gate-drain junction for IGss, and gate-source junction for IGss2- Therefore, by observing these currents, we can distinguish the origin of the leakage.
As shown in Figure 3-17, VDGcrit for IGoff degradation is 36 V in this experiment. At this voltage, IGssl starts to degrade simultaneously with IGoff, whereas IGss2 remains relatively unchanged. This result shows that gate leakage degradation in OFF state is originated from
gate to drain junction as expected. Similar result is also observed in high power condition. Not surprisingly, both junctions are found to degrade in VDS=O state.
E
E
1.E021.E03
1.E04 -1.E-051.E06
-1.E-07
1.E08
-15
25
35
VDGstress(V)
45
55
Figure 3-17. Change in IGoff, IGssl, and IGss2 as a function of stress bias VDG in an OFF state step stress experiment. IGssl is gate leakage current through gate to drain junction, and IGss2 is gate leakage current through gate to source junction.
3.4.5. Effect of LGD
We have investigated the effect of gate-drain gap (LGD) on device degradation. In order to understand the effect of LGD, we have done OFF state stress experiments with five devices
with different LGD=1-5 um, LSG=1 um, and W=2x25 um. These devices have been stressed at VDS=30 V and VGS=-5 V for 50 minutes. The measurement of drain resistance before the stress tests revealed a contact resistance of 0.517 Q-mm (Figure 3-18). As expected, drain
resistance increases with
LGD-- Goff
Gss1

![Figure 1-3. Degradation mechanism in AlGaN/GaN HEMT under high stress condition [17].](https://thumb-eu.123doks.com/thumbv2/123doknet/14673713.557390/19.918.199.713.164.446/figure-degradation-mechanism-algan-gan-hemt-stress-condition.webp)