Analysis of Headless Shear Stud Connections
ByBerndt F. Spittka M.S., Missouri S&T (2008)
B.S., United States Military Academy (2002)
SUBMITTED TO THE DEPARTMENT OF CIVIL AND ENVIRONMENTAL ENGINEERING IN PARTIAL FULFILLMENT OF THE REQUIREMENTS FOR THE DEGREE OF
MASTER OF SCIENCE IN CIVIL AND ENVIRONMENTAL ENGINEERING AT THE
MASSACHUSETTS INSTITUTE OF TECHNOLOGY
June 2012
@ 2012 Massachusetts Institute of Technology. All rights reserved.
ARCHIVES
MA ISEUSi~T~TS
INSTrrITEL B27RA R IS7
~-T~
Signature of Author:
DepartmerfMof Civil and Environmental Engineering May 11, 2012
Analysis of Headless Shear Stud Connections by
Berndt F. Spittka
Submitted to the Department of Civil and Environmental Engineering on May 11, 2012, in Partial Fulfillment of the
Requirements for the Degree of Masters of Science in Civil and Environmental Engineering
ABSTRACT
Highway bridges are exposed to numerous elemental and loading issues that are extremely difficult for a designer to anticipate and account for during design. The current state of practice is to design a bridge deck for a certain life span and then turn the bridge over to maintenance personnel who attempt to
prolong the life of the deck through a variety of repair and rehabilitation measures. These repair measures are rarely, if ever, considered during the design process of the bridge deck. Numerous researchers have looked at making bridges, specifically decks, more repairable. The majority of these research efforts have focused on the bridge deck system as a whole. Other researchers have looked at individual elements of the bridge deck to girder connection to see if the required strength could be achieved while making the connections easier to take apart. One of the main components in the bridge deck to girder system is the steel shear stud connection, which is used to create composite action between the deck and the girder. Numerous researchers have studied this connection from a strength perspective, and the strength equations for the shear connection have been codified. Shear
connections using headless studs have been researched as well, but always as a part of a larger deck to girder connection system. The headless stud has never been researched to see how it responds to a shear loading. This study looks at headless studs with varying levels of debonding along the stud shaft to analyze the impact on the load resistance that the levels of debonding would have. Granular materials for the shear transfer of load are also looked at. The results show that, as expected, the headless, debonded shear studs can carry less load than a bonded stud, but the difference in load
Acknowledgments
Thank you to my wonderful wife, Leona. Without your loving support and encouragement nothing I do would be possible. Thank you for the generous love that you give me and for being such a great mother to Mason. Mason, thanks for lighting up our lives every day. We look forward to watching you grow up, but not too fast.
Thank you also to my thesis and academic advisor, Professor Connor, for your guidance throughout this research process. Thank you for pushing me to define, structure, and execute a course
program that was both interesting and challenging.
To my friends and colleagues here at MIT, thank you for your support and assistance throughout this academic process. Brandon, Rory, Pierre, Tim and Simon, thanks for your help. Andy, thanks for
being a great battle buddy during our years here at MIT. It was great having you there as a fellow Army officer to rely on.
To Colonel Fred Meyer, Sir, thank you for giving me the opportunity to come to MIT and for enabling me to reach the ultimate goal of teaching cadets. Thank you also to the Army for funding my education here at MIT and allowing me the time in my career to pursue a Master's degree.
To our friends from CTK Cambridge, thank you for being an extended family for us and welcoming us into your community. Mike, Shannon, Mary Morrow, Nathan, Sarah, Meghan, Erik, Sergey, Galina and Amelia, your support and love has been a God given blessing for our family.
Finally, I give praise to Jesus Christ for guiding us through every day and giving me the ability to glorify him. Hungry and thirsty every day.
Contents
List of Figures 9
List of Pictures 11
List of Graphs and Charts 13
1. Introduction 15
1.1 The Problem with Bridges Being Exposed to the Environment ... 15
1.2 Four Approaches to Combating the Problem of Bridge Exposure ... 19
1.2.1 Bridges are Being Made Stronger through Different Forms and Materials ... 20
1.2.2 Bridges have been Designed to be Repaired ... 22
1.2.3 M aintaining a Bridge during its Service Life... 25
1.2.4 Another Approach to making Bridges Function Longer... 26
1.3 Problem Statem ent...28
2 Literature Review 31 2.1 Porter...--- ....--- . ... 31 2.2 Tadros...34 2.3 Yam ane...39 2.4 Issa...----.- ... .... ---... 40 2.5 Badie...42 2.6 M enkulasi... .... .. ... ---... - - - ---...51 2.7 Oehlers...60
2.8 Bond Developm ent in Concrete... 61
2.9 Analysis of Literature Review ... 62
3 Analysis of Headless Stud Shear Connection 65 3.1 M otivation...65 3.2 Experim ent...65 3.2.1 Setup...66 3.2.2 M aterials...67 3.2.2.1 Shear Studs... 67 3.2.2.2 Cylinders... 67 3.2.2.3 Grout...68 3.2.2.4 Debonding... 68
Contents
4.4.1 Pullout of Each Specimen... 79
4.4.2 Rise as a Percentage of Pullout and Total Slip... 80
5 Interpretation of Results 81 5.1 Peak Strengths of Specimens Compared to AASHTO 6.10.10... 81
5.2 Time at Peak Strengths...81
5.3 Minimum Strengths of Specimens Compared to AASHTO 6.10.10... 82
5.4 Ending Strength of Sand Compared to AASHTO 6.10.10... 83
5.5 Minimum Strength of Specimens Compared to AASHTO 5.8.4... 84
5.6 Ending Strength of Sand Compared to AASHTO 5.8.4 ... 86
5.7 .M.v...86
5.7 Movement ... 86
5.8 Duration of Loading...87
5.9 Sand vs. Other Materials... 87
6 Conclusions and Future Work 91 6.1 Conclusions...91
6.1.1 Use of Sand... 91
6.1.2 Debonding and Pull-Off/Sepa ration from the Girder... 91
6.1.3 Debonding and Damage to the Steel Stud... 92
6.1.4 Comparing the Experimental Values with AASHTO Equation 6.10.10 with the 22% Reduction...92
6.1.5 Comparing the Experimental Results with AASHTO Equation 5.8.4... 92
6.2 Future Work...93
6.2.1 Sand ... 93
6.2.2 Fatigue...94
6.2.3 Headed Studs... 95
6.2.4 Roughened Surface Studs... 95
6.2.5 Full Scale Testing... 96
Appendix A: Photos of Experimental Results 97
List of Figures
Figure 1: 20 Elements of a Bridge, All of Which Need to be Connected Together and are Subject to
Deterioration...---.... . ---... 16
Figure 2: Agrawal's Rating System developed to Rate Conditions of the Bridge Elements in NY State...16
Figure 3: Oh's Maintenance Prediction Flow Chart for Bridge Owners... 17
Figure 4: AASHTO Grand Challenge #3 (emphasis added)...19
Figure 5: Conventional Connections studied by Porter...32
Figure 6: Proposed Curved Bolt Connections... 33
Figure 7: Comparison of Conventional Connections with Proposed Curved Bolt Connections...34
Figure 8: Proposed Shear Key M echanism ... 35
Figure 9: Further Description of Mechanism for Shear Key System...36
Figure 10: Description of Com posite Loading... 38
Figure 11: Yamane's Proposed Deck System...40
Figure 12: Shear Stud Orientation for Issa's Experimental Setup... 41
Figure 13: Comparison of Test Results, Code and Viest... 42
Figure 14: Breaking the Force on a Shear Stud and Cluster of Shear Studs into its Components...43
Figure 15: Closed Tie Confinem ent, 4 Studs... 45
Figure 16: Steel Tube Confinem ent, 4 Studs... 46
List of Figures
Figure 25: Com parison of Different Haunch Heights vs. Peak Stress... 56
Figure 26: Post-Installed Hooks...57
Figure 27: Dayton-Richmond Anchors... 57
Figure 28: Shear Keyed Specimens...57
Figure 29: Post-Installed Rebar Load vs. Slip... 58
Figure 30: Dayton-Richmond Anchors Load vs. Slip... 58
Figure 31: Keyed Specimen Load vs. Slip... 59
Figure 32: Com parison of Peak Stress from Experiments vs. Design Equations... 59
Figure 33: Forces on Reinforcing Bars... 62
List of Pictures
Picture 1: Exterior of Apple Building, Boston, M A... 27
Picture 2: Interior Staircase Connection... 27
Picture 3: Exterior Fagade Connection, Boston M A... 28
Picture 4: Interior Staircase Connection 2... 28
Picture 5: Schem atic of Experim ent Show ing Shear Stud... 67
Picture 6: Experim ental Setup...67
Picture 7: Schem atic of Load Application... 70
Picture 8: Load Application...---...---.--.... .. 70
Picture 9: M TS Loading M achine... ... . 70
List of Graphs
Graph 1: Fully Bonded Iterations Load vs. Slip Comparison...76
Graph 2: Fully De-Bonded Iterations Load vs. Slip Comparison... 76
Graph 3: Partially De-Bonded Iterations Load vs. Slip Comparison... 77
Graph 4: Sand Iterations Load vs. Slip Com parison... 77
Graph 5: Rise (lift-off), Pullout and Total Slip for all Specimens... 79
Graph 6: Partially De-Bonded and Sand Iterations Load vs. Slip Comparison...88
Graph 7: Fully Bonded and Sand Iterations Load vs. Slip Comparison...89
List of Charts
Chart 1: Movement of Cylinder Comparison for all Specimens...80Chart 2: Maximum Load Comparison vs. AASHTO 6.10.10 with 22% Reduction...81
Chart 3: Time, in Seconds, that each Specimen Sustained Peak Load...82
Chart 4: Minimum Load vs. AASHTO 6.10.10 with 22% Reduction...83
Chart 5: Ending Load for Sand Iterations vs. AAHSTO 6.10.10 with 22% Reduction...84
Chart 6: Minimum Load vs. AASHTO 5.8.4 with Proposed c and p for all Specimens...85
Chart 7: Minimum Load vs. AASHTO 5.8.4 with Proposed c and [t for all Specimens, Zero Out c First...85
1. Introduction
1.1. The Problem with Bridges Being Exposed to the Environment
Highway bridges are structures intended to span 20-40 feet, just enough to clear two lanes of traffic. The most economical form of a short span highway bridge has been found to be the girder
bridge. These bridges are built and maintained by state or local governments, who are concerned about the initial cost of these projects. In recent years, the American Society for Civil Engineers (ASCE) has given the country's bridge inventory an overall grade of C (ASCE Report Card). Since these bridges are continuously exposed to the environment and varying loading patterns over their lifetimes, it has been very difficult for the agencies responsible for the bridges to keep them maintained. While this
maintenance is a multifaceted issue with economics, politics, environment and engineering involved in the solution, the fact remains that the bridges must be repaired.
One of the major challenges of keeping a bridge inventory maintained is that the rate of deterioration of the bridges is anything but constant. A few examples of how agencies attempt to predict when a bridge will need maintenance are the following:
- Tserng attempted to break the bridge itself into the different segments that need repair. He proposed a total of 20 different portions of the bridge that need to be addressed accurately for a complete bridge to be designed and maintained. (Tserng, 2007)
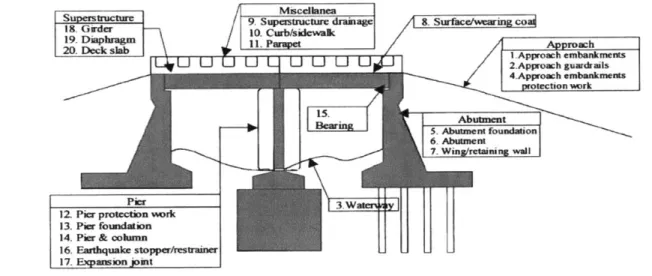
Miscellanea
--upestru L-r 9. Superstucture drainage 8. Surfaewing coa
18. Girder 10. Curb/sidewalk
1.Diackag 11. Parapet Approach
F0g 1k Lb oI 20 p e fApproach It embankments
L-*u U U U U2.Approach guardrails
4.Approach embankments protection wrk
eafr' S. Abutment foundation
6. Abutment 7. Wing retainin wall
pier 3.W imv
I 2 Pier p17,i work hn
13. Pier foundation
14. Pier & column
16. Erthia N stopper/restramehr 17. Expansion joirt
Fig. 1. Locations of 20 predefined elemients a bridgerf
Figure 1: 20 Elements of a Bridge, All of Which Need to be Connected Together and are Subject to Deterioration (Tserng, 2007)
- Agrawal, et al. established a rating criteria for New York State bridge inspectors to rate the
condition of deterioration on New York State (NYS) bridges. With over 17,000 highway bridges in the
NYS inventory, their rating scheme had to be very robust. Their study used Weibull distributions to
determine how the observed state of a bridge would affect the bridge's overall condition rating (CR).
With the CR of 1 to 7, NYS then decides on budgeting and executing maintenance on their bridge
inventory. (Agrawal, 2010)
Rat ing Descript ion
7 New condition; no deterioration
6 Used to shade between ratings of 5 and 7
5 Minor deterioration but functioning as originally designed 4 Used to shade between ratings of 3 and 5
3 Serious deterioration or not functioning as originally designed 2 Used to shade between ratings of I and 3
1 Totally deteriorated or in failed condition
Figure 2: Agrawal's Rating System developed to Rate the Conditions of the Bridge Elements in NY State (Agrawal,2010)
- Oh, et al. did extensive research to create a predictive model that would take into account a bridges current state, its environment, and expected loadings to predict when maintenance would need
to be done on the deck. (Oh, 2007) The study, based in Korea, looked at the wheel loading and
environmental factors that would deteriorate a bridge deck's capacity. The attached flow chart (Figure 3) shows just the input information required to determine the maximum load effects on a bridge deck.
Input Information
T~ve f ne~a -Gross Weight Historam Average Daily Truck Traft Singse Truck. Semi Tta4e (ADTT1
Sab me weiht DiS2ano Grufrh Ranio
Sirnge Truck. Seniy Triter 101
D;!Vance -Geornetry Headpay Distance
-Maeruals Curtbs ang rata
-Geome1 ry Median sari> ISingle Truck, Semi Trater ProDabiy () Tramfc Patre
Input Aay~
Movg we LoadShear
-~C Mum-xle nec
Deieriratixr of grer
r PCha tls*L4 iMv Tt o Trafi -or Shear
ls Sees Pararah- For moqwt
Headway
Datan1ce-J~,,% Mankium Load Effect
for srvice Ie e
-rw Fce
achGre
Tame Increfife
SperstrurFseme Via
ICurts. Median StrIM
-Whe-l ConHwled A'a s
- 'ao Ein
~cr
Foraskalednens e-c * oen
-Growth Facer[Gr -ime incree
-fornme Value Maximum Load Effect
- Kim, et al. used combined multiple regression and GIS technology to identify the critical sources of deterioration of the bridges in North Dakota. Their research found that the age and the structure of the bridge, and traffic volumes were the most significant factors affecting the serviceability of the bridges sampled. (Kim, 2010)
The key aspect of these studies is that they attempt to predict how maintenance personnel should react to a deteriorating bridge inventory. Bridges will always be exposed to varying loadings and the environment. It is a reasonable assumption that they will also be exposed to an ever increasing loading from larger trucks that run more frequently. A bridge would not have been built if each of the two sides of the gap did not need to travel to the other side. With such widely varying factors that lead to deterioration, it is next to impossible to take the current bridge inventory and predict when
something will fail. This inability begs the question, is there a better way to keep our bridges functioning in the future?
The bridge industry may do well to look at the industry that uses their infrastructure, namely, the automobile industry, for ways in which to keep their product functioning for longer. An automobile is made up of many removable parts that can easily fail. Consequently, the future maintenance of an automobile is taken into account during its design. If bearings are expected to fail, then those bearings are made to be accessible and able to be replaced. The concept of replaceable parts made automobiles capable of being utilized by the general public. It may be time to take this same concept and apply it to the roads on which automobiles ride.
The goal of this thesis is to look at a subset of the many interrelated parts that need to be studied in order for a bridge to be as repairable as an automobile. This thesis shows that the complex connections of a bridge can be studied more closely. Using this data, a bridge can be designed like an automobile with future repairability as a primary goal of the design process. While a more complex
bridge design will increase the initial cost, the life cycle cost is expected to be reduced by the lower maintenance costs.
1.2 Four approaches to combating the problem of bridge exposure
In order to keep the bridge inventory functional, researchers and practitioners throughout the country and the world are exploring several different avenues. These efforts combined with existing technologies constitute the state of the art for bridge construction and maintenance.
In order to guide the efforts of the bridge industry, the American Association of State Highway and Transportation Officials (AASHTO) published the Grand Challenges currently facing transportation officials. These challenges are as follows: 1. Optimizing Structural Systems 2. Accelerating Bridge Construction 3. Advancing AASHTO Specifications 4. Monitoring Bridge Condition 5. Contributing to National Policy 6. Managing Knowledge. (AASHTO, 2005) Figure 4 contains the details of Grand Challenge number two, Accelerating Bridge Construction.
- Implementation and further development of rapidly assembled
connection details and joints that are constructible, durable and repairable
- Development of maintenance needs, accessibility, repairability, and
inspection criteria
- Implementation and further development of design considerations for
hardening of existing structures and rapid recovery after disasters (natural and manmade)
* Development of prefabricated seismically resistant systems, including
substructures
Within the first three bullets, AASHTO mentions repairs or repairability four times. The agency is obviously encouraging the bridge industry to make their product more repairable. In order to meet AASHTO's Grand Challenge of making bridges more repairable, the industry and academia have taken three different approaches.
1.2.1 Bridges are being made stronger through different forms and materials.
Researchers at the University of Michigan have been addressing repairability through protection. Historically, one of the points on a highway bridge that deteriorates is the joint between the bridge itself and the approach ramps that come up to the bridge. This joint, usually very near the girder seat, allows water to penetrate to the underside of the bridge and reach the girders. When added with de-icing salts in the winter time, this water penetration causes corrosion and weakening of the girder at the point that it is transferring load to the abutment. Under current designs, this corrosion eventually leads to the replacement of the entire girder, despite the fact that only the end of the girder is excessively corroded.
- Yang, et al. have conducted research creating a self healing cement. When microcracks form in the cement, the water that enters those cracks hydrates the cement to close the cracks again. This
material has shown immense ductility and is being field tested as a replacement for the joints and sealants currently used. When successfully applied, the self healing cement removes the access point for water penetration that causes the debilitating corrosion. (Yang, 2007)
-Li, et al. developed and tested an ultra ductile engineered cementious composite (ECC). Their fiber reinforced material was able to withstand much larger amounts of deflection than regular concrete materials. Li found that the ECC displayed strain-hardening properties similar to steel. The ductile strength and strain-hardening aspects of the material are suggested to make the material more applicable to retrofit and repair of civil structures than normal grouts. It should be noted that the
and mortars that it was compared to during testing. Despite these similarities the overall structural strength and ductility when ECC was used, made the overall system better. (Li, 2000)
- Klaiber et al. studied the applicability of using a form of strengthening commonly seen in Europe for its applicability on American bridges. This form of strengthening is the application of External Pre-stressing. This concept applies cable strands to the exterior of the bridge in order to increase the flexural strength of the girder bridge. Klaiber, et al looked at the use of post-tensioning on simple span and continuous span bridges. They concluded that the application of post-tensioning was a feasible and viable technique for increasing the flexural strength of a bridge. (Klaiber, 1990)
The motivation for Klaiber, et al. was that the traffic volume as well as the vehicle size had greatly increased since the majority of the bridges in the United States were built in the 1940s and
1950s. The need to increase the capacity of the bridges to reduce fatigue and overstress deterioration drove them to look at what could be added to a bridge to increase its capacity.
Klaiber first studied the simple span and continuous span bridges in the laboratory. With satisfactory results from the lab tests, he then instrumented and post-tensioned one simple and one continuous span bridge. Both of the bridges studied in the field showed promising results after having external post-tensioning added to them. He found that the addition of post-tensioning reduced the dead load strains on the bridges allowing them to carry more live load. It should be noted that his system did not seem to reduce live load deflections or influence live load distributions. Klaiber
concern was the deterioration of the bridge decks throughout Alabama. By adding additional girder lines, they proposed that the deck would deteriorate less rapidly under applied loadings.
Their theoretical approach focused on adding additional girder lines between existing girders and that action's impact on the deck, existing girders, bent caps, foundations and abutments. They approached the study from the following three perspectives: 1. Strength of Materials 2. Structural Analysis 3. Code Assessment. From their theoretical analysis, they found that the deck strength would be approximately doubled, and deflection (which induces cracking) would be significantly reduced. These affects stemmed from the decreased girder spacing and subsequent stiffening of the bridge superstructure. The remaining fatigue life of the existing girders would also be increased by about a factor of eight. Their concerns about the additional girder lines on the existing substructure found that the bridges should operate within an acceptable factor of safety. (McRae, 2003, PART 1)
The other consideration of McRae and Ramey was the practical considerations of adding additional girder lines, which included the cost and constructability of adding girder lines. McRae and Ramey concluded that the cost would be quite high since the additional girder line would require extensive modification of the bridge structure, specifically the bent caps. The additional girder line would reduce the rate of deck deterioration, but the repair of the deck would be in addition to the cost of adding a girder line. (McRae, 2003, PART 2)
1.2.2 Bridges have been designed to be able to be repaired.
- Newport Transporter Bridge. The Newport Transporter Bridge is located in Newport, England. The bridge spans the River Usk and was built in 1906. (Newport Transporter Bridge) Designed by a French engineer, Ferdinand Arnodin, the bridge uses the transporter bridge concept to ferry passengers and vehicles across the river. The basic concept of the transporter bridge is a highly elevated truss structure with a gondola suspended beneath it. The gondola picks up vehicles, passengers and cargo to
ferry them across the river. While this is a very rare (only 8 exist in the world) type of bridge, the design methodology and systematic maintenance approach used by Arnodin is worth examining.
Ferdinand Arnodin (October 9, 1845 - April 24, 1924) was a French engineer who worked with various types of bridge forms. He was known for being a pioneer, if not the inventor, of the transporter bridge concept. He also did numerous projects to refurbish deteriorating suspension bridges. He often would replace the suspension bridge with a combination bridge that contained components of a cable-stayed bridge and a suspension bridge. One of his major focuses was to enhance the repairability of the structures he refurbished and designed.
When he was commissioned along with R.H. Haynes, the borough engineer of Newport, to build the Newport Transporter Bridge, Arnodin used his experience and desire to create a maintainable
structure in the design. Throughout design, Arnodin kept detailed notes not only on how the bridge would operate but also on how the different pieces of the bridge could be replaced. He advocated a systematic replacement of parts, to include the suspension cables, in order to distribute the cost of repair over the lifetime of the bridge. Arnodin envisioned a bridge that could remain operational indefinitely through this systematic approach to maintenance. His notes can be essentially interpreted as a maintenance manual for the Newport Transporter Bridge.
For many reasons, Arnodin's manual and replacement parts plan were not implemented on the Newport Bridge. His manual was written in French and was not immediately translated to be useful to
Because of the lack of attention to maintenance on the Newport Transporter Bridge, the structure began exhibiting signs of failure by the 1960s. By 1985, the structure was in such a poor maintenance state that it was closed to use. In 1991, the bridge was so poorly maintained that is was impossible to do any work on it without conducting a major overhaul. Instead of closing the bridge permanently, Newport decided to refurbish and reopen it. By 1995, the bridge was able to be used again. During the restoration, Arnodin's maintenance manual proved to be a great help to the engineers in charge. He had provided a way for every part with a fixed service life to be removed and replaced. However, Arnodin's work on his maintenance manual did not prove to be all inclusive. In the end, nearly half of the budget spent from 1991-1995 on the bridge's repairs was for work that Arnodin had not anticipated. (Mawson, 2007)
Arnodin's attention to the "structural redundancy, replaceability and maintainability" (Mawson, 2007) of the bridge during design proved to be very useful even 90 years after the bridge was
constructed. The fact that he did not anticipate all of the maintenance requirements shows that even when a design is focused on repair, the designer's efforts are still limited, because predicting how a structure will fail is immensely difficult.
- 1-93 Bridge Replacement project. A modern example of how bridges are repaired is the Medford Bridge Project conducted by the Massachusetts Highway Department (MassDOT) in 2011. With a vehicle usage in the ten's of thousands per day, the 1-93 corridor that runs through Medford, Massachusetts, is a major artery into the city of Boston. When the bridges showed major signs of deterioration, such as large potholes appearing in the bridge deck, the Massachusetts Highway's bridge division had to determine how to replace or repair the bridges. A major design constraint was that traffic would be negatively impacted with any long term closure of the roadway.
The short period of time that the state made available for construction drove the project's design. From the appearance of the first pothole in 2010 to the project's completion in September
2011, the MassDOT had to move much more rapidly than they would have under normal business conditions. The result was a set product of "innovations MassDOT used to accelerate the bridge replacements includ[ing]: design-build procurement, a prefabricated bridge elements system, and a special rapid-setting concrete. By replacing the bridges with modular superstructure units that were fabricated off-site, MassDOT eliminated years of work in the roadway." (Fast 14)
Each bridge was removed, replaced and opened for traffic from Friday evening to Monday morning of one weekend. The project showed that with today's technologies the speed with which a highway bridge can be replaced can be greatly accelerated with today's technologies. By essentially replacing the exact same superstructure which had been pre-fabricated offsite, the MassDOT kept the highway open for commuter traffic every weekday during the project's duration. The extreme emphasis on speed led to a remarkable accomplishment in bridge construction engineering.
While the bridge was erected extremely quickly, the future repair of the bridge was left in question. The innovative rapid-setting concrete was not expected to be extremely durable, yet the designers did not account for the need to repair that connection in the future. If that connection or any other on the bridge needs to be repaired, the common practices of bridge engineering will have to be used. When the bridge decks need to be replaced, it is quite possible that a similar project to the Fast 14 will need to be conducted again.
The maintenance activities done to increase or extend the useful life of a bridge fall into two categories: rehabilitation and repair. The repair of a bridge means to take a component of the bridge that no longer serves as it should and bring it back to a serviceable level. Repair can be done on the steel and concrete members of a bridge without changing the capacity of the bridge. The rehabilitation of a bridge means to alter the bridge in a way to improve its performance. Some examples of
rehabilitation are adding elements to a bridge to combat earthquake loading or foundation scour, or increasing the redundancy of supports to add redundant load paths or reduce fatigue loading on critical members. (Khan,2010)
1.2.4 Another approach to making bridges function longer
While the three previous focus areas all make bridges more durable or able to be replaced quickly, to make bridges more repairable requires a greater understanding of the connections that make the individual pieces work together. The basic premise of Ferdinand Arnodin was when he did not expect a part to last indefinitely he designed it to be able to be removed and replaced. In order to remove a part from today's highway bridges, we must understand the connections that make up the bridges. As it will be shown, these connections have been studied at great length, but the basic assumption behind those studies did not lend itself to future repair.
The basic assumption of bridge design and construction is to create a bridge to meet a certain design life. That design life determines the magnitude of the loads that are designed to be resisted. To resist these loads, the structure and its connections are made continually stronger as the design life increases. This assumption that stronger connections makes a more durable bridge is similar to Arnodin's approach of taking great care in designing and constructing the substructure of the Newport Transporter Bridge. He anticipated that the substructure would not be able to be repaired thus it needed to be extraordinarily durable. (Mawson, 2007) The problem arises when we attempt to make
every connection on a bridge very durable. Something will eventually fail, and if everything has been made to last as long as possible, it makes the repair of those connections exceedingly difficult.
To see what could be done when a part of a structure is anticipated to fail, we need only look at other current construction projects. The Apple computer stores around the country are made
completely of structural glass. Structural glass, while very strong, is also very brittle and prone to catastrophic failures. To design a building made completely of structural glass, Apple designers and contractors had be 100% confident in the precision of their construction. But even with complete precision in the design and installation, the glass will still fail at highly unpredictable rates.
Consequently, Apple also designed the buildings so that each piece of glass could be removed. To remove each piece of glass without affecting the ability of the whole structure to remain intact, an intimate knowledge of the connections between each piece of structural glass was required. These connections had to be accessible, removable and replaceable. All of which had to be accomplished without having to take apart the rest of the structure.
Picture 3: Exterior Fagade Connection, Boston MA Picture 4: Interior Staircase Connection 2 It is not realistic to say that the care given to the design and construction of the Apple stores can be applied to the thousands of highway bridges throughout the country. However, it is a fair
comparison to say that the unpredictable nature of the deterioration rates within the bridge components is very similar to the unpredictable failure rates of structural glass. The strength of the Apple store buildings is the ability to take them apart piece by piece regardless of which part fails. The same application could be used on highway bridges, but it requires a more extensive knowledge of the connections that join the pieces of a bridge together than is currently available.
1.3 Problem Statement
By applying the same type of understanding of connections as seen in the Apple store
application to bridges, especially the connections between the parts of the bridge that deteriorate the most rapidly a designer could make a bridge more repairable. One of the most rapidly deteriorating parts of a bridge is the deck. By focusing on the connection between a deck and its supporting girders, one could make a bridge more repairable. Relaxing the rigidity of the connection between the shear stud and the grout or concrete around it is one way that the connection between the deck and the supporting girders can be made more repairable. The obvious concern is that this connection creates the composite action that allows a bridge to be built lighter than with a non-composite deck. The shear
connection should not be removed completely, it should be studied so that the deck is made more removable. Instead of making the bridge deck stronger through using a longer design life, one could make it more repairable by understanding the connections, especially the shear connection, more.
The specific shear connection that will be studied in this thesis is a headless stud shear connection. As it will be shown, a headless stud shear connection has been used as part of a bridge system but never studied on its own. My objective is to test specimens varying levels of bond between the steel stud and the surrounding grout to determine if headless, debonded studs can resist shear
2. Literature Review
Several different researchers have looked at many of the connections that make up the bridge system. The research efforts have ranged from looking at individual connections to complete bridge systems. A review of the research efforts to date will show that the connections of a bridge can be made to be more repairable while not sacrificing the performance of the bridge.
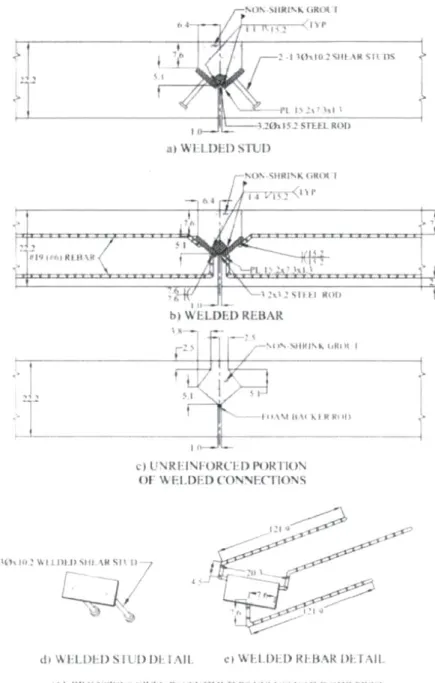
2.1 Porter
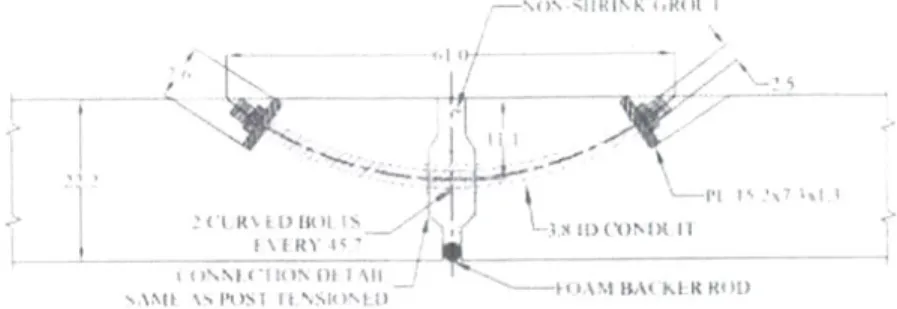
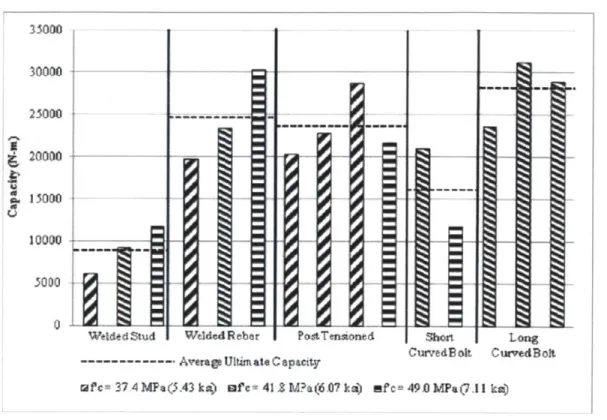
Porter, et al. studied the transverse joint connections on precast deck panels. Porter's emphasis was finding a means of connecting the joints with the previously studied and accepted in design criteria of 200 psi of compression while not using a post-tensioning system. Porter proposed 2 new curved bolt
connections, a welded rebar connection and a welded shear stud connection with the intent of being able to replace deck panels individually. Two of his proposed connections were able to carry more moment, on average, than a typical post-tensioned transverse joint. Those two connections, welded rebar and long curved bolt, show that it is possible to have a connection that gives the ability for an individual deck panel to be replaced while still carrying the required forces. (Porter, 2010)
I 1J1\(1140t I DI- Sill) Si HR - / b -1 WED) REBAR -7-1
2'E DED COASN H1-INS
d#AI-moIS11-)DU e IL HUID R1WRWIAt
I %I HAI R
f, 1U 0 ni'M)RI( *l1. V A 4)
I
~
~
~
IAll IIiN~
IR I
41 4I~
46
I MC RV:IT)Figure 6: Proposed Curved Bolt Connections (Porter 2010)
As seen in Figure 7, Porter's proposed connections that utilized curved bolts performed quite well in comparison to the conventional connections. His short, curved bolt connection did not exceed the strength of the conventional connections. His long, curved bolt connection performed nearly as well as the post-tensioned connection. The overall average strength of his long, curved bolt connection was higher than the post-tensioned connection, but the post-tensioned connection used a lower strength (5.43 ksi) concrete than the long, curved bolt did (6.07 ksi) for the majority of the tests.
35000 30000 20000 a. 15000 10000 3000 0-
-Weldedstud WeldedReber PostTenaoned Short Long
--- Average Ultimate Capacity CurvedBolt CurvedBolt
wfc= 37 4MPa(5.43 ka) of c-412Ma(6Oka) efc= 490MPa(7.11 ka)
Figure 7: Comparison of Conventional Connections with Proposed Curved Bolt Connections (Porter 2010)
2.2 Tadros
Tadros, et al. studied the application of a more rapidly removable bridge deck system in order to meet the need of limiting the impact to high volumes of traffic that use the country's bridges. The current system of using a roughened, bonded, reinforced interface was seen to have the following drawbacks: 1. Deck removal is difficult and time consuming, especially when trying to preserve the girders that a deck is attached to and preserving the composite (shear) connectors. 2. The top flange of the girder is at risk of being damaged during removal. 3. During replacement, the shear connectors are subject to corrosion. (Tadros, 2002)
With these concerns, Tadros et al. conducted the National Cooperative Highway Research Program (NCHRP) Project 12-41 "Rapid Replacement of Bridge Decks" at the University of Nebraska. Tadros' philosophy was "that bridges should be built similar to parts of a model car that are snapped or bolted together." (Tadros, 2002) The research team developed a full bridge deck system that utilized a
debonded shear key interface system and headed shear studs to allow for more rapid replacement of the deck while still achieving the desired composite action.
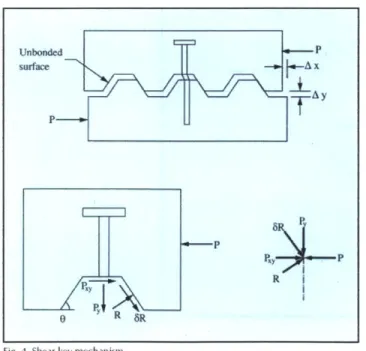
Tadros' shear key system attempted to provide the same amount of interface shear that had been studied in the past and achieved through a roughened, bonded interface. The key component was the geometry of his system, See Figure 8, which he found could achieve the same amount of interface
shear as a flat girder using a bonded interface could achieve. The proposed system consisted of the following: 1. Concrete shear keys formed on the top flange surface of the girder that provide mechanical interlock between the top flange surface and the deck concrete. 2. Sealant applied to the girder top flange surface to break the bond between the surface and the deck placed on top of the flange. 3. U-shaped shear connector bars embedded in the girder web and extended up into the deck slab. (Tadros, 2002) 20.87" (530 mm) 2.95"(75 mm) Shear connector b, = 48.2" (1225 mm) %e= 6.9" (175 mm)
Tadros designed his shear key mechanism to use the geometry of the interface between the concrete deck and the supporting concrete girder in order to transfer the shear forces between the two. Since the interface between the two is angled, as seen in Figure 9, the two surfaces slide relative to each
other and then engage the connecting bars (represented by shear studs in the figure). %#hen the two
surfaces slide relative to each other, they cause tensile and shear stresses in the steel connecting bars. To further describe Tadros' system, as seen in Figure 9, the applied force is P. Pv is the tensile force in the steel connector, Px, is the shear force in the steel connector, R is the bearing force on the side of the shear key and 6R is the friction force on the side of the shear key (6 being the interface friction factor of the two debonded surfaces). He used the bearing on the side of the shear key and the shearing of the base plane of the shear key as two means to design the size of the shear key required. He used these calculations to determine the standardized sizes of shear keys for his complete bridge design. The standardized shear key dimensions were determined to be a 0.75 inch key depth with two No. 5 U-shaped bars provided at a spacing of 11.81 or 23.62 inches (depending on required shear capacity). (Tadros, 2002) Unbonded P surface x
Ay
TY
PP Py P P. R 9 R 8RFig. 4. Shear key mechanism.
Since the shear forces between decks and girders are transmitted through the shear stud and the removal of grout or concrete around those shear studs is problematic during deck replacement, Tadros looked at the possibility of using a larger diameter shear stud. Being able to use a larger
diameter shear stud (typical diameter sizes are three-quarter inch or seven-eighths inch) would allow for fewer shear studs to be used on a typical bridge application. Tadros investigated the possibility of using
a 1-1/4 inch diameter shear stud. His research focused on the material the stud would be made from, the method of welding the stud to steel girders with either a modified stud gun or a new welding
mechanism, development of a testing mechanism for testing weld quality, and techniques of evaluating structural performance. (NCHRP 407)
As part of the structural performance evaluation in the testing of the large diameter shear studs, Tadros developed a full scale test. Using a 40 foot long W36x160 hot rolled section, Tadros alternated headed and headless studs to anchor a four foot wide by eight inch deep concrete deck. (NCHRP 407) After the application of fatigue and static loads to the specimen, Tadros observed the difference in slippage between the deck and the girder was between 0.00013 to 0.0005 inches. The stress distribution diagrams showed no change in the neutral axis. He observed no major cracks, concrete crushing or stud failure. It must be noted that the focus of this full scale experimental program was the use of the large diameter shear stud. Tadros also conducted timed experiments for different methods of deck removal, but did not differentiate between the time needed to remove concrete from around
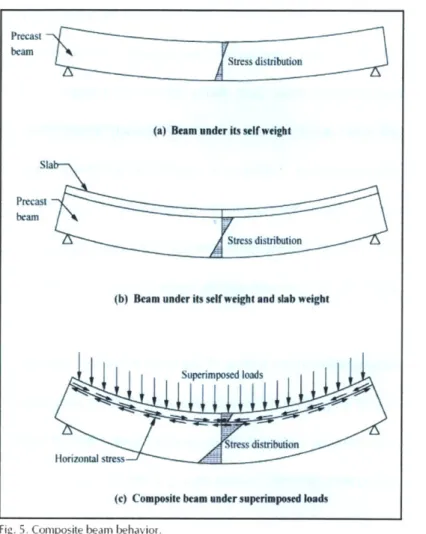
(c) Composite beam under superimposed loads Fig. 5. Composite beam behavior.
Figure 10: Description of Composite Loading (Tadros, 2002)
In his design for the factored horizontal shear stresses, Tadros only used the superimposed loads (see part c of Figure 10). He used this approach for the following reasons, 1. Specifications do not give specific guidance on which loads to use. 2. The girder and slab are in place prior to composite action happening. 3. This design approach had been used by the Illinois Department of Transportation for many years with no reported problems at the time of his experiment. (Tadros, 2002)
Tadros also found that the specifications either did not mention how the factored horizontal shear stress should be calculated or underestimated the actual horizontal shear stresses. For the underestimation, he did not find it to be an issue, since the loads are assumed to be very over estimated.
Precast
beam Str ess distribution
(a) Beam under its self weight
Sla
Precast beam
After extensive analysis and design of a complete bridge deck and girder system, Tadros concluded that the debonded shear key interface system for precast, prestressed concrete girders had
several advantages including the following: 1. Since the future removal of the deck was considered during design this consideration would enable a more rapid removal in practice. 2. The shear connectors were better protected against corrosion. 3. The girder's top flange was protected from damage during deck removal. (Tadros, 2002)
2.3 Yamane
Yamane, et al. studied a precast, full-depth, reinforced concrete, panel bridge deck system. The goal of his research was to test a system that would allow for more rapid replacement of a bridge deck system. He noted the following reasons why full depth precast pre-stressed concrete panel systems had not been more readily used included the following: 1. Difficulty of accommodating crowned sloped sections due to the pre-tensioning in the long-line bed. 2. Difficulty in transferring and developing strands in the first maximum negative moment zone located at the external girders. He found that his system addressed these major concerns. (Yamane, 1998)
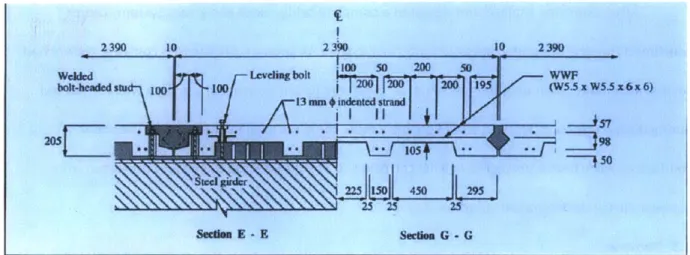
Yamane's bridge deck system not only consisted of precast, prestressed concrete panels, but he also used a combination of welded headless shear studs in concert with welded threaded studs. To finalize the placement of the deck and create composite action, he utilized grout filled shear keys, leveling bolts and threaded bars for post-tensioning. (See Figure 11)
21390 10 2 30 10 2 390
Wd Levding bolt -100 50 200 WW
Fiur1:amas Proose Deck S20ystem (W5.5 W5.5 za6nx 6)
O3 shea s dn Yamand
225i5 450 295
See~n Eseedas G -G
Figure 11: Yamane's Proposed Deck System (Yamane, 1998)
Of note was the use of headless shear studs in Yamane's design. These headless studs were
designed to only transfer shear force. Without the heads attached, which are used to combat uplift forces in the deck in traditional bridge design, the headless studs had to be used in conjunction with the threaded headed studs seen in Figure 11. This combination of studs was able to create fully composite action between the attached girder and the bridge deck system while allowing for more rapid removal and thus replacement of the bridge deck in the future. Yamane conducted a finite element analysis of his proposed bridge deck system and found that the stresses in the deck were well within the acceptable range of the AASHTO Specifications.
2.4 Issa
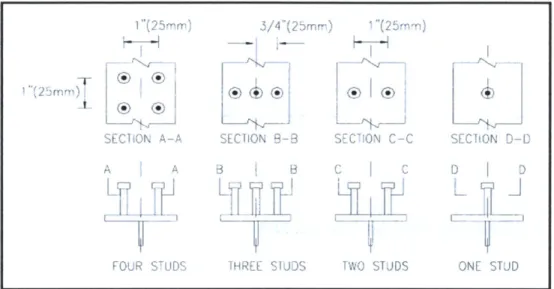
Issa, et al. conducted testing on full- and quarter-scale push-out specimens in order to study the composite behavior of the shear connection in full-depth, precast concrete bridge deck panels placed on steel girders. The purpose of the study was to compare the experimental results with a finite element
analysis, as well as the current design code equations. The research program focused on the number of shear pockets in the precast deck panel, the number of studs in each of those shear pockets, and the use of a grouted haunch for connecting the precast panel to the supporting girders. (Issa, 2003)
Of the 28 specimens testing, 14 were full-scale and 14 were quarter-scale. The quarter-scale specimens used one, two, three and four studs per shear pocket. While the full-scale specimens used two, three and four studs per shear pocket. See Figure 12 for the arrangement of the studs in shear pockets. The research program also tested two full-scale specimens with no shear studs to examine the contribution of friction to the connections. (Issa, 2003)
1 "(25-rr) 3/4(25mr-) "(275)
SEC AON A A SECT ON 9-3 SIC:ON C-C SECli0N D-D
FOUR STUDS 1HREE S1JDS TwO STJDS ONE STUD
Figure 12: Shear Stud Orientation for Issa's Experimental Setup (Issa, 2003)
All the specimens were loaded with a quasistatic loading with the load, slippage, and ultimate load at failure being recorded. Failure modes as well as crack formation and propagation were noted for all specimens as well. Issa observed that the critical point of slippage ranged from 0.02 to 0.03 inches for all specimens, with the 0.02 inches of slippage being the dominant measurement. The critical point
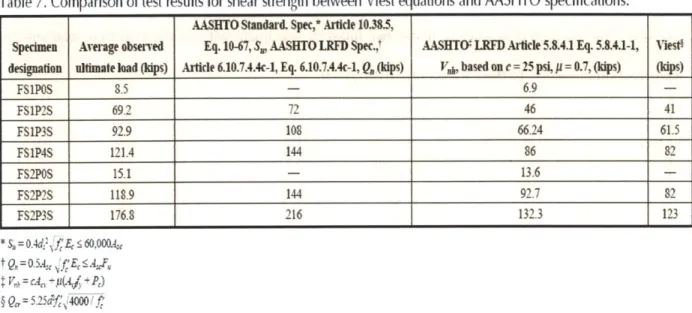
research. The researchers found that the AASHTO specifications overestimated the strength of the shear stud connection by up to 22%. (Issa, 2003)
Table 7. Comparison of test results for shear strength between Viest equations and AASHTO specifications.
AASBTO Standard. Spec,* Article 10.38.5,
Specimen Average observed Eq. 10-67, S., AASHTO LRFD Spec.,t AASHTOt LRFD Article 5.8.4.1 Eq. 5.8.4.1-1, Viestf designation ultimate load (kips) Article 6.10.7.4.4c-1, Eq. 6.10.7.4.4c-1, Q, (ips) Vj, based on c = 25 psi, p= 0.7, (ips) (kps)
FS1POS 8.5 - 6.9 FS1P2S 69.2 72 46 41 FS1P3S 92.9 108 66.24 61.5 FS1P4S 121.4 144 86 82 FS2POS 15.1 - 13.6 -FS2P2S 118.9 144 92.7 82 FS2P3S 176.8 216 132.3 123 * S, =0.4d.fE, 60,000, t Q,=0.5A, j f'E Aj. 't V' = C-4A +iP')
} Q,= 5.25 df4OOo f
Figure 13: Comparison of Test Results, Code and Viest (Issa, 2003) 2.5 Badie
Badie et al. studied the possibility of extending the AASHTO LRFD limitation on the spacing between shear connectors on steel girders. The current standard limits the spacing to 24 inches.
(AASHTO 2007) Badie looked at extending that spacing to 48 inches in order to: 1. Simplify and speed up the fabrication process of the panels. 2. Reduce the volume of the grout filling shear pockets which inherently would reduce the cost of the deck and increase construction speed. 3. Reduce the possibility of water leakage between shear pockets and grout. 4. Allow the designers more flexibility in designing
reinforcement by allowing for fewer shear pockets. (Badie, 2010)
Badie focused on four main concerns that should be taken into account whenever dealing with the application of shear studs to a concrete decking system. These four issues are as follows: 1.
Longitudional splitting cracking in the deck slab over the girder lines. 2. Separation between deck slab and girder. 3. Bearing failure of the slab in front of stud cluster. 4. Crushing failure of grout at the stud
base. (Badie, 2010) Badie related the first three issues to the spacing of stud clusters only and the fourth to the size of the stud only. These four issues are integral to understanding the interaction of the
stud with the concrete deck of any bridge system.
As seen in Figure 14, the attempted horizontal movement of a girder relative to the slab induces a force, P, that will both attempt to lift the deck from the girder, P., and split the concrete behind the
stud with relation to the direction of force, P1. Badie reviewed the work of others that ignored the vertical dispersion of the force, P,, which resulted in the whole force, P, being used as the capacity of the stud. The same behavior was expected to happen with a single stud or with a cluster of studs. (Badie, 2010)
(a) Vertal1 & H onzontal dipmo (b) Traaverse dipenon (c) Tansverse tena e & cmrsnaon frce dstnbut
on
(on'aneav (Plan view) (Plan view)
A
()
C)
sptbcJ-done with headed shear studs. Badie also noted that the self weight of a deck slab on an actual bridge would assist in holding the deck and slab together.
From other research by Hawkins et al., Badie obtained an empirical formula for determining the bearing strength of the concrete in front of the stud. This is of special concern with large stud spacings, since the failure of the concrete in front of the stud could cause the entire system to fail without fully transferring stresses to the shear stud.
In all shear stud centric composite systems, the stress concentrations at the base of the shear stud are extremely high. Since Badie was using one and one-quarter inch diameter shear studs, he was especially concerned that the concentration of stresses would cause the grout to fail resulting in the total flexural strength of the system being underestimated. He investigated two different types of lateral confinement around the stud clusters in order to protect the grout from this crushing effect.
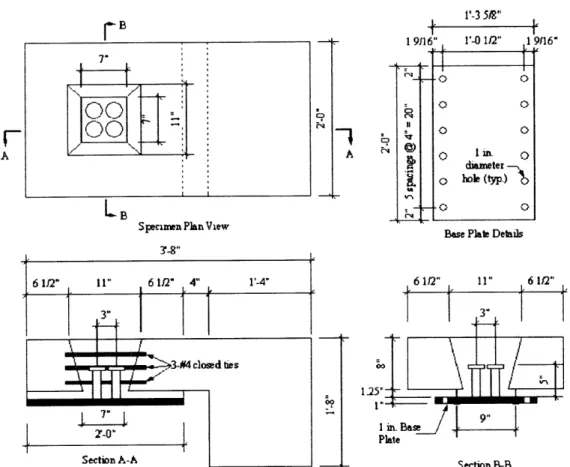
Badie used both a closed-tie and a steel tube confinement approach for a 4-stud cluster and an 8-stud cluster. (See Figures 15-18) The 4-stud clusters were meant to represent a spacing of 24 inches between shear pockets. The 8-stud clusters represented a spacing of 48 inches between shear pockets in a precast panel system. Badie based this number of studs and spacing on an empirical study he performed in 2002, which showed that one shear stud of one and one-quarter inch diameter needed to be placed every 6 inches for full composite action. (Badie, 2010)
7"
00~
00
LB
Specuen Plan View
0 A 0-1 9f0-16" 1'-0 1/2" 1 9116" 00 - 0 0 *I~ diamter ,-ohole (typ.) e P a0
Base Plate Details
Section B-B
Fig. 2. Concrete dimensions of the four-stud closed-tie continenent specimen
Figure 15: Closed Tie Confinement, 4 Studs (Badie 2010)
A
F-A Figur
O
HSS 12.530 188: Specimen PlanView A 5 3/4" 1'-0 1/2" 5 3/4" 4" '" - 3- -u 0 1 25 IIIIIIIIIIIIN-M ll IN ______ I unlBase SecmA- AFig. 3. Concrete dinenions of the four-stud teel-tuhe confinement
e 16: Steel Tube Confinement, 4 Studs (Badie, 2010)
1'-3 5/8"
1 9116" 1'-0 1/2" 19116"
le tp)
A am etet-,
0
Base Plete Detals
5 3/4" 1 O 1/2" 5 3/4" 3p
9I1#
SeccuimB-Bspecinen
*
OCA
LB Specen Pl an Vew A Y-3 5/8 1 9/16 1'-0 1/2" 9/16" o o o u n o 00 B 0Base Plate Detals
2~'-0" 6 1/2 I* 61/2" 3" 1" 1in Bas Plate Secbon B-B
Fig. 4. Concrete diiensions of the eight-stud closed-tie continement speciien
Figure 17: Closed Tie Confinement, 8 Studs (Badie, 2010)
A
A
F B
"O7
i-~ ~~1 9/16 1-0 1/2* 9/16"
...- IS16x12x5/16
0 00
A C 0
A A E i Ao g 0 0
Specim en PlanV iew Bee PI at Detal s 3'-11'2'-0* 7"_1#4* 4" 4" 14* 6" 1-0* 6" 1* 2-0* i:n Base__f Pl at* Seca A- A SectianB-B
FIg. 5. Concrete dimensions Of thIe igIht-stud. steel-tube confinenent specinen
Figure 18: Steel Tube Confinement, 8 Studs (Badie, 2010)
Using the apparatus seen in Figure 19, Badie applied a shear load to the specimens in two groups. During the horizontal load application to Group 1, it was observed that extensive cracking occurred in the concrete outside the shear pocket. Consequently, the second group had a additional set of side plates attached. These side plates were expected to replicate the fact that an actual bridge deck would extend to either side of the tested specimen and provide similar confinement. Badie's first group was only exposed to a static load applied at a rate of five kips per second. The second group was statically loaded to fatigue capacity, then the specimens were loaded with two million cycles of the fatigue load. Finally, the second group was loaded until failure.
Fig. 7. Test setup of the push-oft specimens
Figure 19: Test Setup for Badie Experimental Program (Badie, 2010)
Badie observed the following five modes of failure: slab failure, bearing failure, shear stud failure, grout crushing failure and bond failure (between the lower layer of closed-ties and the concrete). From these observations, the experimental program came to several conclusions which included the following:
1. Fatigue capacity of clustered studs:
a. No signs of concrete/grout crushing, weld failure or local distress around or inside the shear pockets were observed when the push-off specimens with four-stud and eight-stud clusters of one and one-quarter inch diameter were exposed to two million cycles of fatigue load.
b. Almost no change occurred in the load-displacement relationship of the push-off specimens after applying 2 million cycles.
c. Specimens confined with closed tie showed higher displacement compared to the specimens confined with a steel tube. This trend was more pronounced in the specimens made with eight studs.
(1956) correlate very well with the test results. This observation is consistent with the findings by Issa et al. (Issa, 2003)
e. A bond failure between the lower tie and the concrete slab was observed in most of the specimens made with closed individual ties and subjected to the two million cycles of fatigue load. This failure most likely occurred because of the large size of the bar, which led to high stress concentration. Using No. 4 or 5 closed tie may help to avoid this failure.
3. Shape of the push-off specimens:
a. For future investigation, it is recommended to use symmetric push-off specimens instead of the L-shaped specimen used in this research. However, due to the expected high load that is required to break the symmetric specimen, half- or quarter-scale specimens should be considered.
b. The failure modes of Groups #1 and #2 show that the side external confinement of the specimen is very important to overcome the limited-width problem of the push-off specimens. All the specimens of Group #1 had slab failure, while almost all of the specimens of Group #2 had stud failure. Unfortunately, no mathematical models are available at the current time to quantify the amount of the side confinement needed to simulate an actual bridge. (Badie, 2010)
zr Yt j~?
I
(a)
~.. r-*Y
At -- I - -I- I A - r* F~La
-7PFig. 8. Load-displacement
relationship before and after applying the
fai2ue 1oad:
(a) four-stud
spvcimens.
(b)
eight-stud specimens
I) U'COO ; Aft .e~.fl2
I
-C.10J L"i MON ISMO) "0 OW 4 0 1. 6 . -4As shown in Figure 21, Menkulasi noted that the horizontal shear strength of a connection can be approached from the following three sources: ACI 318-02, AASHTO LRFD Specifications and AASHTO Standard Specifications. Menkulasi simplied these three different approaches to one equation
V = C + pAvhfy with C=cohesion (also encompassing dowel and other contributing factors), p=friction
coefficient, Ayh=area of reinforcing steel crossing the shear plane, fy=yield strength of reinforcing steel. (Menkulasi, 2005)
Table 1. Equations for horizontal shear strength.
Code or
specification Horizontal shear strength
No ties. clean, roughened surface: V, =80b,d (lbs)
Minimum ties, clean, smooth surface: V, = 80bd (Obs) ACI 318-02 Ties provided. clean, roughened surface: 1 = [260 + 0.6Ab,s b,,d
not greater than 500bd (Ibs)
If V. > p500b, design according to shear friction section Sb,
Minimum ties: A. = 0.75 vf - not less than 50b/f,
V.& V.
AASH TO No ties, clean, roughened surface: V. =80b~d (Ibs) Minimum ties. clean, roughened surface: V = 350bd (bs) Specifications Ties provided exceeding minimum, clean, roughened surface:
VA= 330bd + 0.4A,,fd/s (bsi Minimum ties: A,, = 50bs/f,
v-,<
p V.AASHTO V = cA,+ t(A, + P,) (lbs)
LRFD where
Specifications c = cohesion factor = 100 psi for clean and roughened surface y = friction factor = 1.0 for clean and roughened surface
P, = permanent compressive force across interface
Figure 21: Design Equation Comparison (Menkulasi, 2005)
Menkulasi expected the strength of the girder to panel connection to differ from a typical composite girder interface because of the grouted haunch, multiple interface planes and the fact that the shear connectors were grouped in isolated pockets. His experimental approach looked to address these concerns. He conducted 36 push-off tests which represented a precast deck being connected to a precast concrete girder. The deck and girder specimens were identically shaped with the shear studs attached to one directly and then grouted to the other. See Figure 22
Beam Side Shear Connector Slab Side Grout Pocket Grouted Haunch Elevation Section
Figure 22: Menkulasi Test Setup (Menkulasi 2005)
Menkulasi designed his testing program to investigate the following four parameters: 1. The type of shear connector would include no connector, extended stirrups, post-installed reinforcing bars and insert anchors. 2. The cross-sectional area of shear connector. 3. The type of grout used. 4. The grouted haunch height used included 1, 2, and 3 inch high haunches. (Menkulasi, 2005)
For the testing setp and procedure, Menkulasi placed the assembled specimen in a specifically designed testing frame. This frame allowed the girder side of the connection to slide with respect to the slab side, which was itself fixed in place. The beam side was supported on four steel pipes. These pipes allowed the beam and slab to slide relative to each other with the application of a shearing force.
Menkulasi looked at several different results from these 36 iterations. His result analysis included: load-slip behavior, load-strain behavior, comparison of grout types, comparison of haunch heights, and alternate shear connectors used. He also did extensive strength predictions and compared those strengths to accepted design equations. A brief look at each of his result analysis will be
presented here.
Menkulasi found that with an increasing shear connector diameter, the peak load increased. After the peak load, cracking always appeared along one of the interfaces. While the maximum load was not reached again, a lesser load could be resisted through large relative slippage. The cracking always appeared between the grout and the beam or slab. With a one inch deep haunch, the crack always appeared on the beam side, but the location of the crack varied in location with a varying haunch height. (Menkulasi, 2005)
Menkulasi looked at the load-strain behavior of each of his specimens. The strain in the studs approached, but did not cross the yield strain of the material, before cracking appeared. After cracks in the surrounding grout appeared, he observed that the strain immediately became more than the material yield strain. See Figure 23 for a typical representation of his load-strain results.
Load vs Strain 100
80
6O
Specimen 11 - 1 in. haunch
40- 2 legs of #5 bar-Set 45 grout 20 0 -500 0 500 1000 1500 2000 2500 Microstrain
Figure 23: Load vs. Strain Relationship for a Typical Experimental Run (Menkulasi, 2005) Menkulasi compared two different grout types, latex modified and Set 45, in 12 of his specimens. He compared the peak shear stress vs. clamping stress in three different shear connector