Publisher’s version / Version de l'éditeur:
Vous avez des questions? Nous pouvons vous aider. Pour communiquer directement avec un auteur, consultez la
première page de la revue dans laquelle son article a été publié afin de trouver ses coordonnées. Si vous n’arrivez pas à les repérer, communiquez avec nous à [email protected].
Questions? Contact the NRC Publications Archive team at
[email protected]. If you wish to email the authors directly, please see the first page of the publication for their contact information.
https://publications-cnrc.canada.ca/fra/droits
L’accès à ce site Web et l’utilisation de son contenu sont assujettis aux conditions présentées dans le site LISEZ CES CONDITIONS ATTENTIVEMENT AVANT D’UTILISER CE SITE WEB.
Review of Progress in Quantitative Nondestructive Evaluation, 38, pp. 070004-1-070004-9, 2019-05-08
READ THESE TERMS AND CONDITIONS CAREFULLY BEFORE USING THIS WEBSITE. https://nrc-publications.canada.ca/eng/copyright
NRC Publications Archive Record / Notice des Archives des publications du CNRC :
https://nrc-publications.canada.ca/eng/view/object/?id=e25e9404-78b9-4d68-bb59-a6ec40dba800 https://publications-cnrc.canada.ca/fra/voir/objet/?id=e25e9404-78b9-4d68-bb59-a6ec40dba800
NRC Publications Archive
Archives des publications du CNRC
This publication could be one of several versions: author’s original, accepted manuscript or the publisher’s version. / La version de cette publication peut être l’une des suivantes : la version prépublication de l’auteur, la version acceptée du manuscrit ou la version de l’éditeur.
For the publisher’s version, please access the DOI link below./ Pour consulter la version de l’éditeur, utilisez le lien DOI ci-dessous.
https://doi.org/10.1063/1.5099804
Access and use of this website and the material on it are subject to the Terms and Conditions set forth at
Comparison of laser triangulation, phase shift triangulation and swept source optical coherence Tomography for nondestructive inspection of objects with micrometric accuracy
Comparison of laser triangulation, phase shift triangulation and swept source optical coherence tomography for non-destructive inspection of objects with micrometric accuracy
F. B. Djupkep Dizeu1, Maxime Rivard2, Jonathan Boisvert1, Guy Lamouche2,
1 Computer Vision and Graphics, National Research Council Canada, 1200 Montreal Road,
Ottawa, Ontario, K1A 0R6, Canada.
2 Optical Techniques, National Research Council Canada, 75 Boulevard de Mortagne,
Boucherville, Québec, J4B 6Y4, Canada
We compare the performance of laser triangulation, phase shift triangulation and swept source optical coherence tomography (SSOCT) for quantitative nondestructive inspection. Measurement accuracies of these three optical 3D imaging techniques can be reduced to a few tens of micrometers or less, making it possible to locate and geometrically characterize defects at the micrometric scale. We consider surfaces with different optical properties and we discuss the ability of these techniques to reconstruct the surface profiles. For opaque surfaces, the three techniques provide very similar results. For semi-transparent and transparent surfaces, the accuracy achieved by SSOCT relies on the capability of detecting, selecting and classifying peaks in each axial scan (A-scan), while the performance of triangulation techniques depend on several parameters including the sensitivity and the exposition time of the camera, the positioning of the system in relation to the surface, etc. Based on these facts, a prospective discussion is attempted on the possibility to combine SSOCT and phase shift triangulation for quantitative surface inspection of objects as well as for internal geometrical characterization of semi-transparent and transparent objects.
1. Introduction
Well-established nondestructive evaluation (NDE) techniques such as ultrasounds and thermography use the sound propagation or the heat diffusion through the inspected object to reveal its internal defects. Their performance depends on how permeable is the inspected object to the propagating physical entity (sound, heat), and on the setup used. Most materials used in the manufacturing industry have optical properties that can be exploited for their contactless nondestructive evaluation using 3D imaging sensors. The ongoing rapid evolution in the fields of optics and electronics allows miniaturization and better integration of devices. As result, compact, robust and portable 3D sensors can be designed and prototyped rapidly [1]. In particular, multi-sensor measurement heads, putting together different but complementary technologies, can be contemplated with fewer constraints than some decades ago.
In this paper, we compare the performance of three optical 3D imaging techniques for quantitative NDE. Two of these techniques, laser triangulation and phase shift triangulation, are based on active triangulation; the third, swept source optical coherence tomography (SSOCT), uses interferometry. Phase shift triangulation is a full-field 3D measurement technique, while laser triangulation and SSOCT usually require point by point (or line by line) scanning. Measurement accuracy of these techniques can be reduced to a few tens of micrometers or less, making it possible to locate and geometrically characterize defects at the micrometric scale. The basic principle of each technique is presented in the first part of this paper. In the second part of the paper, we consider surfaces with different optical properties and compare the three techniques for surface inspection. Lastly, we explore the possibility of combining phase shift
triangulation and SSOCT for the quantitative inspection of opaque surfaces as well as for the quantitative surface and internal inspection of semi-transparent and transparent objects.
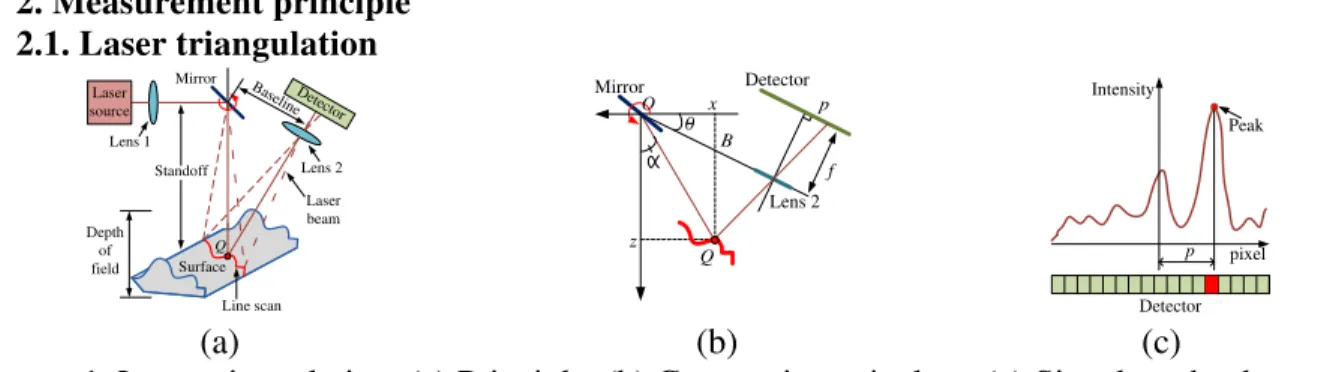
2. Measurement principle 2.1. Laser triangulation Laser beam Bas eline Line scan Lens 2 Detector Standoff Laser source Surface Mirror Lens 1 Depth of field Q z x f p B Detector Mirror Lens 2 Q 0 O Peak p Intensity pixel Detector (a) (b) (c)
Figure 1. Laser triangulation. (a) Principle. (b) Geometric equivalent. (c) Signal on the detector. Figure 1a presents the basic principle of laser triangulation. A rotating mirror is used to scan the surface with a laser beam. The first lens focuses the collimated beam in the vicinity of point on the surface, while the second lens focuses the backscattered beam on the detector. Figure 1b shows the geometric equivalent of Figure 1a. The baseline of length forms an angle � with axis . These two parameters are the intrinsic parameters of the system and are determined by calibration. Angle � between the incident beam and axis is the deflection angle. The position of the laser spot is measured by distance on the detector (Figure 1c). Through triangulation, the coordinates of point are evaluated using the deflection angle �, the laser spot location , the focal length and the angle �:
= [ + � � + � ][� � − � � �] (1) = − tan � (2) Uncertainties ∆ and ∆� depend on the detector and the scanning device used. Accuracy achieved on coordinate is proportional to the focal length of the lens, the length of the baseline, and the square of cosine of the deflection angle. It is inversely proportional to . Accuracy achieved on coordinate is inversely proportional to [2]. Practically there is a trade-off between the required accuracy (spot size as small as it can be), the measurement range (as large as possible), the size of the system (baseline) and the available hardware (laser source and detector).
2.2. Phase shift triangulation
Projector Camera Baseline Q c cp Baseline Q Projector l Camera (a) (b)
Figure 2. Phase shift triangulation. (a) Principle. (b) Geometric equivalent.
In phase shift triangulation, fringe patterns are projected on the scene and the back reflected light is captured using a camera (Figure 2a). The light beam coming from a projector column �
illuminates point which is imaged at pixel , � of the camera (Figure 2b). In order to triangulate point one must determine column � from intensity , � measured at pixel , � . This can be done by encoding the projector column � using patterns. These patterns are successively projected in the reconstruction volume and the camera measures the following intensities at pixel , � [3]: , � = , � + , � � [� , � − � ] , � = , � + , � � [� , � − � ] ⋮ − , � = , � + , � � [� , � − � − ] , � = , = , , … , − . (3) is the amplitude offset, is the amplitude and � is the phase offset. The phase �(� ) is given by:
�(� ) = � (4) where is the spatial period of the projected patterns. Equation (3) can be rewritten as:
, � = , � + , � � � + , � �
, � = , � + , � � � + , � �
⋮
− , � = , � + , � � � − + , � � −
(5)
where , � = , � � [� , � ] and , � = , � [� , � ] are determined using the intensities and the known phase offsets � . The retrieved phase is wrapped and is given by:
� , � = arctan( , � , , � ). (6) � is obtained after performing a phase unwrapping � , � → � , � ≡ � , � :
� = � , � (7) Using Equation (7), the pinhole model of the camera with no geometric distorsions can be used to determine the 3D coordinates of point in the coordinate system of the camera [3]:
[ ] =−�′ − ′ − + �− �′�′′ + �′ ′ + �′ [�
′
′]. (8)
In Equation (8), ′ and �′ are the normalized pixel coordinates of the camera and �′ is the normalized projector column. The rotation parameters , , = , , and the translation parameters , , define the position of the projector with respect to the camera. In phase shift triangulation, the overall accuracy can be improved by reducing the noise level of the camera and the spatial period , while increasing the number of patterns and the amplitude as well as the calibration accuracy.
2.3. Swept source optical coherence tomography
The basic principle of SSOCT is presented in Figure 3a and relies on a swept laser source operating between wavenumbers = / and = / . The instantaneous narrow-bandwidth laser beam described by the electric field � is divided into two components. The first component (� ) propagates from the splitter to the reference reflector and returns to
the splitter (� ). The path length for this round trip is constant. The second component (� ) is directed onto the object of interest. This object is viewed as constituted by interfaces resulting from the variation of the refraction index through its volume. Each interface backscatters the beam � . The interference signal � = � + � reaches the detector which delivers a current modulated by the path length difference between the reference path and the path used by light to reach each interface. A Fourier transform is used to find the position of each interface. Reference reflector Object Interfaces Detector Beam splitter Elas Eobjout Eobjin Erefin Erefout Edet Swept laser source (a)
Figure 3. Principle of swept source OCT.
Assuming that the beam splitter has a : ratio, � , � and � take the following forms [4]: � = � − � , � =����
√ � � and � = ����
√ (∑�=�= �) where � is the
angular frequency, � is the spectral amplitude of the electric field, is the reflectivity of the reference reflector and is the reflectivity of the ℎ interface situated at depth . = | | is the power reflectivity. Assuming that distances are measured in free space (dispersion is not considered) and eliminating the �-terms that vary faster than the response time of the detector, the detector current is:
= [ � + ∑ = = ] + [ ∑ √ � = = cos( �− )] + [ ∑= √ = , ≠ cos( − )]. (9)
= | | is the power spectrum and is the responsivity of the detector. The cross-correlation term, i.e. the second term of Equation (9), is used to determine the path length difference between the reference reflector and each interface. To increase accuracy the reference reflector is chosen so that the autocorrelation term (third term of (9)) is small. The A-scan is the Fourier transform of interferogram (9). It is given by:
= [Υ � + ∑ = = ] + [� ⊗ ∑ √ � = = �( ± � − )] + [� ⊗ ∑= √ = , ≠ �( ± − )] (10)
where � is the inverse Fourier transform of , ⊗ is the convolution operator and � is the Dirac function. The main peaks of are located at = { ; ± �− }, = , . . , .
In SSOCT depth resolution increases with the tuning range − [5]. For a source sampled into spectral channels between = / and = / with step size � , the axial step is:
� = � = − (11) Based on the fact that the useful length of the discrete Fourier transform is generally / , the penetration depth (depth range) is given by the following equation:
= � = − (12)
3. Experimental results
The specifications of the in-house NRC sensors are given in Table 1. We first compare the three techniques on opaque surfaces and then on semi-transparent and transparent objects.
Table 1. Technical specifications of the in-house NRC sensors. (Reconstruction volume : Width × Height × Depth of field) Laser
triangulation
Wavelength: . . Acquisition rate: . Spot size: . RMSE< . Reconstruction volume: × × . Phase shift
triangulation
Image resolution: × . RMSE< . Reconstruction volume: × × . Swept source
optical coherence tomography
Spot size: . = . . = . . RMSE< .
Sample points: . Sweep rate: � . Reconstruction volume:
× × .
3.1. Case of opaque surfaces
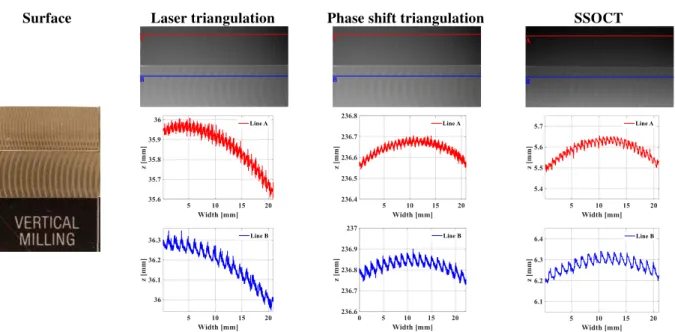
Surface Laser triangulation Phase shift triangulation SSOCT
Figure 4. Opaque metallic surfaces (Rubert No 130). Top: surface profile. Middle: Profile along line A. Bottom: Profile along line B.
In Figure 4, we present the results obtained with the Rubert No 130 [6] vertical milling metallic surfaces. A very good similarity is noticeable between results provided by the three techniques. The period of the first milling (line A) is around . and that of the second milling (line B) is around . . The peak to peak amplitude in both cases is around . These results show that for applications where surface inspection is required, these techniques can be used to
locate and characterize surface defects having geometrical signature at the micrometric scale. Nevertheless, these techniques have limitations. Triangulation techniques is inaccurate in the presence of inter-reflections and for surfaces whose reflectivity spans in a large interval of values. Likewise, the amount of data needed in SSOCT is significant; each 3D point is computed from an A-scan and each A-scan is stored on about � . The good news is that these intrinsic limitations can be alleviated either by revisiting the theory behind each technique or by combining them in a multi-sensors approach (see section 4).
3.2. Case of semi-transparent and transparent objects
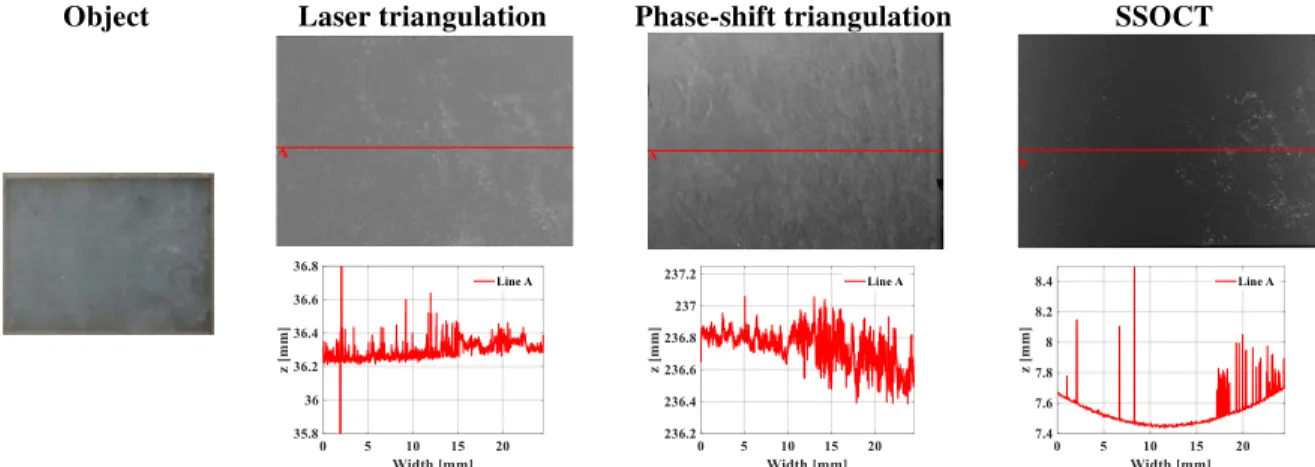
Here we consider a semi-transparent marble object and a transparent plastic object. Figure 5 shows the results obtained with the marble object which has a planar surface. Triangulation techniques show a very low accuracy, while performance of SSOCT appears ambiguous; this is due to the data processing approach used (see discussion below). Note that the result of phase shift triangulation is obtained using a HDR (high dynamic range) mode to improve the signal to noise ratio [7]. Note also that the curvature in the results of SSOCT is due to the operating mode of the galvo scanner and can be corrected by calibration. Laser triangulation has been considered previously for 3D reconstruction of marble objects [8] and the results obtained here confirm that the heterogonous structure of this material coupled to its optical properties (non-uniform reflectivity, subsurface scattering) produces a significant bias in the results (this bias is more than for the object used here). These remarks can be generalized to most semi-transparent objects.
Object Laser triangulation Phase-shift triangulation SSOCT
Figure 5. Semi-transparent marble object. Top: surface profile. Bottom: Profile along line A. Triangulation also works poorly with the transparent object; this is due to the low level of the back-reflected signal. SSOCT on the contrary reaches a very high accuracy. The results for the transparent plastic object are presented in Figure 6 (the results of phase shift triangulation has been obtained after covering the rear surface of the object with an opaque paint).
A method is being developed to improve the performance of phase shift triangulation on semi-transparent objects. We observed that a coarse change of the pattern period improves the level of the signal recorded by the camera although the results accuracy is still low (Figure 7a-c). In the proposed new approach to be presented in a future communication, we proceed with a fine change of the pattern period to improve accuracy.
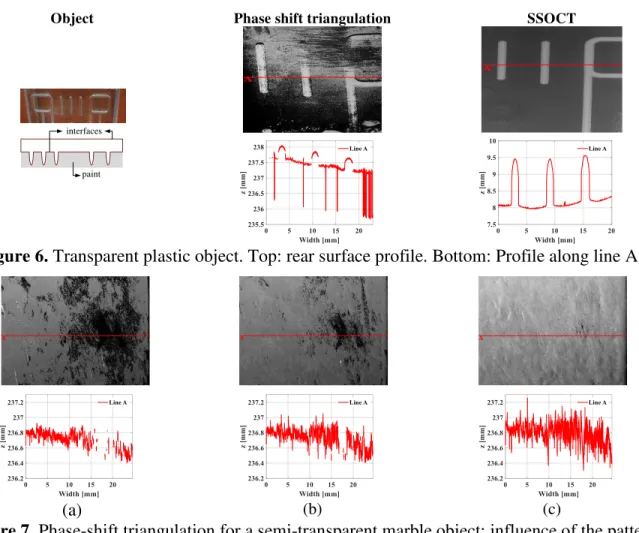
Object Phase shift triangulation SSOCT
paint interfaces
Figure 6. Transparent plastic object. Top: rear surface profile. Bottom: Profile along line A.
(a) (b) (c)
Figure 7. Phase-shift triangulation for a semi-transparent marble object: influence of the pattern period. Top: surface profile. Bottom: Profile along line A. A coarse change of the pattern period
improves the signal level. (a) = . (b) = . (c) = .
Contrary to triangulation, the ambiguous accuracy achieved by SSOCT (Figure 5) is not related to its intrinsic principle but to the processing method used. Figure 8a shows the B-scan corresponding to line A in Figure 5, whereas Figure 9a shows the B-scan along line A in Figure 6. From these B-scans we observe that the marble object has an internal structure made of several interfaces at irregular (almost random) positions (see the multiple peaks in Figure 8b which shows the A-scan at = ). It is not the case for the transparent object where the front and the rear interfaces are clearly identifiable (see the two peaks in Figure 9b which shows the A-scan at = ).
A straightforward approach to classify peaks in A-scans can be based on two criteria. The first criterion assumes that the peak with the highest amplitude correspond to the first interface, the peak with the second highest amplitude corresponds to the second interface and so on. The line profile (line A in Figure 5) based on this criterion is presented in Figure 8c. Error at = is due to the fact that the wrong peak (peak 2 in Figure 8b) having the highest amplitude is chosen instead of the good one (peak 1 in Figure 8b). The second criterion assumes that in an A-scan the first peak which appears corresponds to the first interface, the second peak corresponds to the second interface and so on. The drawback of this criterion is that due to noise a threshold has to be settled to choose what is consider as a significant peak. A high threshold may lead missing the real peak, whereas a low threshold may result in a false peak detection. Figure 8d shows the
inaccurate result obtained using this criterion with the semi-transparent object. One idea to build a robust peak classifier is to assume that the interface exists and is continuous, i.e., distance between neighbor 3D points is minimal. The peaks are chosen such that the mean separation distance among them is minimal: it is the surface continuity criterion. Figure 8e shows the corresponding accurate results.
(a) (b)
(c) (d) (e)
Figure 8. Peak classifier in SSOCT: case of the semi-transparent marble object. (a) A B-scan. (b) A-scan at = . Line profile based on: (c) the peak amplitude; (d) the peak position; (e) the
surface continuity.
(a) (b)
Figure 9. Peak classifier in SSOCT: case of the transparent plastic object. (a) A B-scan. (b) A-scan at = .
4. Concluding remarks on the possibility of combining triangulation and SSOCT for q0uantitative NDE
In order to avoid data misinterpretation and position optical 3D imaging techniques as quantitative NDE methods, these techniques must maintain a very good accuracy whatever the optical properties of the inspected objects. We have presented results showing that laser triangulation, phase shift triangulation and SSOCT can reconstruct opaque surfaces with a micrometric accuracy. We also came to the conclusion that revising the working principle of triangulation techniques should make it possible to reconstruct semi-transparent surfaces with the same accuracy. Furthermore, by processing the A-scans adequately, SSOCT, which gives an overview of the internal structure of semi-transparent and transparent objects, can also accurately perform 3D reconstructions; specifically for a class of objects having a non-negligible level of subsurface light scattering. The following remarks motivate the idea of combining triangulation and SSOCT for quantitative NDE:
Triangulation techniques is more dependent on the level of the back-reflected ligth than SSOCT.
Contrary to triangulation techniques, SSOCT provides a direct overview of the internal structure of semi-transparent and transparent objects; this is of high value in characterizing complex defects.
Triangulation can be a point by point, a line by line or a dense full-field 3D imaging technique. SSOCT operates point by point only.
Triangulation techniques require way less data processing than SSOCT; the amount of data that must be acquired and processed in SSOCT can represent a bottleneck for the development of real-time inspection systems.
Various scenarios can be contemplated to combine triangulation (operating in full-field) and SSOCT:
Triangulation can be used for fast detection of suspicious regions where SSOCT will perform surface and subsurface defects characterization.
Triangulation can provide informations making that SSOCT focusses imaging effort to a specific depth range, reducing then the amount of data acquired and stored.
Triangulation can be a path provider to SSOCT. This is of interest for surface with specificities such as edges, occlusions, particular geometric artifacts, etc. A compact SSOCT sensor can be used to inspect these specificities using a path provided by triangulation.
Measurement head integrating two 3D sensors, one using triangulation and the other using interferometry will provide a reliable, accurate and robust system for surface inspection at micrometric level, for monitoring manufacturing processes and for assessing the internal structure of semi-transparent and transparent objects, etc.
Acknowledgments: The authors thank Louis-Guy Dicaire and Michel Picard for their valuable technical advises on triangulation systems, and André Beauchesne for his help during SSOCT data acquisition.
References:
[1] F. Blais, "A review of 20 years of range sensors development". J. Electronic Imaging, Vol. 13, pp. 231-240, 2004.
[2] Francois Blais, Marc Rioux, J.-Angelo Beraldin, "Practical considerations for a design of a high precision 3-D laser scanner system", Proc. SPIE 0959, Optomechanical and Electro-Optical Design of Industrial Systems, 1988.
[3] M. A. Drouin and J. A. Beraldin, in 3D Imaging, Analysis and Applications, edited by N. Pears, Y. Liu, and P. Bunting (Springer, London, 2012), pp. 95-138.
[4] J. A. Izatt, M. A. Choma, and A. H. Dhalla, in Optical Coherence Tomography, edited by W. Drexler, J. G. Fujimoto (Springer International Publishing, Switzerland, 2015), pp. 65-94. [5] S. Hyun and B. E. Bouma, in Optical Coherence Tomography, edited by W. Drexler, J. G. Fujimoto (Springer International Publishing, Switzerland, 2015), pp. 619-637.
[6] http://www.rubert.co.uk/comparison-specimens/type-130-detail/
[7] Song Zhang, Shing-Tung Yau, "High dynamic range scanning technique," Two- and Three-dimensional Methods for Inspection and Metrology VI, edited by Peisen S. Huang, Toru Yoshizawa, Kevin G. Harding, Proc. of SPIE Vol. 7066, 70660A, 2008.
[8] G. Godin, J.-A. Beraldin, M. Rioux, M. Levoy, L. Cournoyer and F. Blais, "An assessment of laser range measurement of marble surfaces", In Proc. of fifth conference on optical 3D measurement techniques, 2001.