HAL Id: hal-00297639
https://hal.archives-ouvertes.fr/hal-00297639
Submitted on 22 Aug 2007
HAL is a multi-disciplinary open access
archive for the deposit and dissemination of
sci-entific research documents, whether they are
pub-lished or not. The documents may come from
teaching and research institutions in France or
abroad, or from public or private research centers.
L’archive ouverte pluridisciplinaire HAL, est
destinée au dépôt et à la diffusion de documents
scientifiques de niveau recherche, publiés ou non,
émanant des établissements d’enseignement et de
recherche français ou étrangers, des laboratoires
publics ou privés.
20 years (1986?2005)
L. Tedesco, G. Socal, F. Bianchi, F. Acri, D. Veneri, M. Vichi
To cite this version:
L. Tedesco, G. Socal, F. Bianchi, F. Acri, D. Veneri, et al.. NW Adriatic Sea biogeochemical variability
in the last 20 years (1986?2005). Biogeosciences, European Geosciences Union, 2007, 4 (4), pp.673-687.
�hal-00297639�
www.biogeosciences.net/4/673/2007/ © Author(s) 2007. This work is licensed under a Creative Commons License.
Biogeosciences
NW Adriatic Sea biogeochemical variability in the last 20 years
(1986–2005)
L. Tedesco1,2, G. Socal3, F. Bianchi3, F. Acri3, D. Veneri3, and M. Vichi1,4
1Centro Euro-Mediterraneo per i Cambiamenti Climatici (CMCC), Bologna, Italy
2University of Bologna, Centro Interdipartimentale di Ricerca per le Scienze Ambientali (CIRSA), Ravenna, Italy
3CNR – ISMAR, Istituto di Scienze Marine, Venezia, Italy
4Istituto Nazionale di Geofisica e Vulcanologia, Bologna, Italy
Received: 6 February 2007 – Published in Biogeosciences Discuss.: 22 February 2007 Revised: 26 June 2007 – Accepted: 25 July 2007 – Published: 22 August 2007
Abstract. This paper presents a long-term time series (1986–
2005) of hydrological and biogeochemical data, both pub-lished and unpubpub-lished. Data were collected in the north-western area of the Adriatic Sea, at two stations that are considered hydrodynamically and trophically different. The time series have been statistically and graphically analysed on a monthly scale in order to study the annual climatolo-gies, links between the concentrations of chlorophyll-a and the variability in the environment, trophic differences be-tween the two areas and chlorophyll-a trends over time. Ba-sically, the two areas have similar hydrological features, yet they present significant differences in the amount of nutrient inputs: these are in fact higher at the coastal site, which is characterized by a prevalence of surface blooms, while they are lower at the offshore station, which is mainly affected by blooms at intermediate depths. Nonetheless, through-out the whole water column, chlorophyll-a concentrations are only slightly different. Both areas are affected by river-ine discharge, though chlorophyll-a concentrations are also driven strongly by the seasonal cycle at the station closer to the coast. Results show that the two stations are not troph-ically different, although some controlling factors, such as zooplankton grazing in one case and light attenuation in the other, may further regulate the growth of phytoplankton. In both cases no significant trends are detected in either the av-erage chlorophyll-a values or in dispersion of the data, in contrast with significant trends in temperature and salinity.
1 Introduction
The Northern Adriatic Sea (Fig. 1) is a shallow shelf basin with an average depth of 35 m and a prevalent cyclonic cir-culation of water masses (Artegiani et al., 1997a). The area is
Correspondence to: L. Tedesco
(letizia.tedesco@cmcc.it)
largely affected by riverine inputs that provide the basin with a significant flow of freshwater and land-derived nutrients. The Po river is by far the largest Italian river: in the last 20 years it attained a mean discharge of 1465 m3s−1with high
intra- and inter-annual variability (st. dev.=1056 m3s−1),
with peaks in May, mainly due to snow melting, and in October–November, because of high precipitation (Fig. 2). Furthermore, the Northern coast has several smaller rivers that contribute to the overall flow. Consequently, the hy-drodynamics of the Northern Adriatic Sea are quite complex and strongly affected by large variations in heat fluxes and the volume of incoming freshwater (Artegiani et al., 1997a). Generally, a temporal succession of two different hydrody-namic patterns has been recognized: between November and March, the westernmost waters are diluted mainly by the Po River outflow and remain separated from the highly saline and vertically-mixed offshore waters thanks to a frontal
sys-tem located 8–16 km from the coast. The dissolved and
particulate matter, coming from the land, therefore remains more or less confined. Between April and October, warmer waters diluted by freshwater inflows are confined to the sur-face layer and reach almost all of the Northern basin. Dur-ing that period, one or more pycnoclines separate the water masses of intermediate density, while the high-density wa-ters are confined near the bottom (Artegiani et al., 1997a). Recently, Jeffries and Lee (2007) have shown that the loca-tion of the frontal system is highly dependent on the type of physical forcing affecting the Po plume. Grouping histor-ical data of Po rates, wind velocity and ambient stratifica-tion into dominant dynamics, instead of seasonal scale, they found that fresh filaments extend across the Northern Adri-atic during Bora events and that Po waters spread extensively offshore also during high-discharge, strongly stratified peri-ods.
The northern Adriatic is one of the most productive Mediterranean regions (Fonda Umani et al., 2005). Phyto-plankton abundance and distribution is largely dependent on
Gulf of Venice
Gulf of Trieste
Fig. 1. Study area and location of the sampling stations C10 and
E06. 10-Apr 10-Apr 11-Apr 12-Apr 13-Apr 14-Apr 15-Apr 16-Apr 17-Apr 18-Apr 19-Apr 20-Apr 0 500 1000 1500 2000 2500 3000 3500 4000 discharge (m 3/s) Mean ±SE ±SD J F M A M J J A S O N D
Fig. 2. Monthly mean and variability of the Po river discharge
(daily data from “Magistrato del Po”, Parma, Italy).
nutrients and light availability, but also on the stability of the water column. The large periodic modification in the struc-ture and dynamics of the Northern Adriatic Sea causes large spatial and temporal distribution of phytoplankton species composition, biomass and production (Fonda Umani, 1996). A general west-to-east decreasing gradient in the phyto-plankton standing crop and production has been recognized in winter, while during summer stratification the lateral ad-vection of river run-off in surface layers and the presence of marked pycnoclines result in vertical heterogeneities and lo-cal variations in primary productivity (Franco and Michelato, 1992). Primary productivity, representing the immediate re-sult of interactions among physical, chemical and biological variables, gives a dynamic overview of the environment, and is therefore a valuable tool for following the complex effects of freshwater inputs in the Northern Adriatic system (So-cal et al., 2002). Although there have been some previous large-scale spatial and temporal studies that focused on the hydrological (e.g., Artegiani et al., 1997a,b; Raicich, 1996)
and biogeochemical (Zavatarelli et al., 1998) characteristics of the Adriatic Sea, research into the inter- and intra-annual variability of the Northern basin productivity related to its hydrology is still scarce.
In a short-term study, Mauri et al. (2007) related MODIS chlorophyll concentration (chla a2) in the northern Adriatic
Sea to Po discharge rates and local wind forcing. They
found a significant correlation between the North Adriatic optical properties and both the Po river discharge and the lo-cal wind forcing. In particular, the Western Coastal Layer (WCL) width, the structure of the Po river bulge, and the plume extension were significantly affected by both factors. Since MODIS includes also the the contribution of CDOM and mineral particles, their results are, however, of difficult interpretation, as the authors also mentioned in their paper.
Over the past years the North Adriatic has been negatively affected not only by eutrophication phenomena (Degobbis et al., 2000), but also by the apperance of massive mucillage aggregates and anoxic episodes (Precali et al., 2005). Recent studies have reported a rise in water temperature (e.g., Corti et al., 1999), in the Mediterranean Sea (Rixen et al., 2005) and in the Northern Adriatic basin (Russo et al., 2002). Not much data analysis, apart from model experiments (Vichi et al., 2003a), has been done, however, on the quantifica-tion of chlorophyll-a response to the changing meteorologi-cal conditions in the Northern Adriatic Sea.
We present here the analysis of 20 years (1986–2005) of physical, chemical and biological data, both published and unpublished, collected at two stations, that have operated since the beginning of the twentieth century (Fig. 1). Many authors (e.g., Alberighi et al., 1997; Pugnetti et al., 2003, 2004; Bernardi Aubry et al., 2006) have classified E06 as a station that is influenced by the Po river run-off and char-acterized by meso-eutrophic waters, while they have repre-sented C10 as a meso-oligotrophic station that is only par-tially influenced by the Po river discharge; the latter oc-curs particularly during intense stratification periods, when the Po plume eventually turns north-eastwards. In particu-lar, whereas Alberighi et al. (1997) referred to the two sta-tions as trophically different, Pugnetti et al. (2003) could not typify a significant difference in community composi-tion, because a prevalence of tolerant species is observed in the whole area of the North Adriatic Sea. Bernardi Aubry et al. (2006) concluded that the hydrological and trophic vari-ability seemed mainly to affect phytoplankton abundance and biomass rather than species composition.
The main objectives of this work are:
(i) to compare C10 and E06 annual climatologies, with par-ticular regard to chlorophyll-a variability, in order to confirm or reject the hypothesis of two very different trophic areas.
(ii) to relate chlorophyll-a to other hydrological and biogeo-chemical variables so as to identify the principal factors influencing phytoplankton dynamics in both areas.
(iii) to analyse long-term variations in chlorophyll-a dynam-ics at the two stations, either highlighting or excluding possible trends related to climate change and/or to an-thropogenic pressures.
Studying the phytoplankton biomass, using the
chlorophyll-a concentration as an indicator of the standing biomass, we aim at providing a further contribution for better understanding the northern Adriatic biogeochemical variability, its effects on the productivity of the rest of the Mediterranean basins, and a statistical methodology that can be used in other areas of the Mediterranean Sea.
2 Sampling and methods
The sampling stations C10 (45◦15′00′′N, 12◦46′00′′E), and
E06 (44◦57′50′′N, 12◦46′20′′ E) are located about 20 and
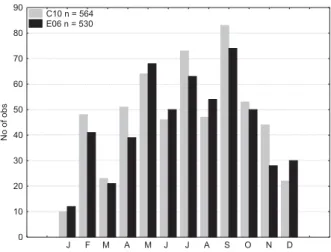
10 nautical miles from the Italian coast and have a maximum depth of 29.5 and 32 m, respectively (Fig. 1). Chlorophyll-a, dissolved inorganic nutrients and oxygen samples were taken at fixed depths of 0, 5, 10, 15, 20, 25 m (standard levels, SL). Samples were collected monthly from April 1986 to Au-gust 2005, during different cruises and supported by different project funding. Because of the high short-term variability of the Adriatic environment, we decided to analyse the data on the smallest available scale (monthly), even if, in doing so, the winter months are less represented (Fig. 3). The data fre-quency shows a different amount of samples for each month, while in the same month the number of samples from both C10 and E06 is comparable. For each station we analysed, at every SL: temperature, salinity and density, obtained
us-ing a CTD probe; samples of nutrients (N-NH3, N-NO2,
N-NO3, Si-SiO4, P-PO4), dissolved oxygen and chlorophyll-a
using Niskin and Nansen bottles. Dissolved inorganic nutri-ents were analysed according to the methods described by Strickland and Parsons (1972) and Grasshoff et al. (1999), dissolved oxygen by the Winkler method (Winkler, 1914), while chlorophyll-a was assessed according to Holm-Hansen et al. (1965). In the end, 564 samples from C10 and 530 from E06 were fluorometrically analysed.
Statistical analyses (descriptive, non-parametric, principal component analysis and partial regression) were performed using commercial software (Statistica by Statsoft). Test re-sults were considered: significant at p–level <0.05, very sig-nificant at p–level <0.01 and highly sigsig-nificant at p–level
<0.001. The powerful non-parametric Wilcoxon Matched
Pairs test was used to compare the biogeochemical features between the two sampled sites. A comparison between the vertical distribution of chlorophyll-a in the water column at the C10 and E06 stations was carried out by Whisker plots and the significance of the results was tested by the non-parametric Wilcoxon Matched Pairs test. The correlation be-tween chlorophyll-a and other physical and hydrochemical variables was studied using parametric tests, after the nor-malization of some of the non-normal distributions by the
GEN FEBMAR APR MAG GIU LUG AGO SET OTT NOV DIC 0 10 20 30 40 50 60 70 80 90 No of obs C10 n = 564 E06 n = 530
Fig. 3. Number of observations per month.
Shapiro-Wilk test. A normal distribution was significantly obtained at both sites for all the variables, except for phos-phate. A principal component analysis (PCA) was then ap-plied to identify the weight of each variable, presenting the results of the first two components. To avoid auto-correlation phenomena between the environmental variables considered independent, we finally applied a Ridge Regression anal-ysis to the normalized data for clarifying the statistically-significant, linear correlation between chlorophyll-a and the other variables. Ridge regression is used when the indepen-dent variables are highly intercorrelated: a constant bias (λ) is added to the diagonal of the correlation matrix, which is then re-standardized so that all diagonal elements are equal to 1 and the off-diagonal elements are divided by the con-stant. In this way Ridge regression artificially lowers the cor-relation coefficients so that more stable estimates (β coeffi-cients) can be computed. The Cox-Stuart test was performed to highlight possible trends in time. Graphic linear interpo-lations were carried out using commercial software (Surfer 8.0 by Golden Software): the median values of all the vari-ables at every SL have been plotted on a monthly scale by the linear Kriging method.
3 Results
3.1 Hydrological and biogeochemical features
Chlorophyll-a data for both stations, are plotted in Fig. 4
for the whole period. Time series plots of the other
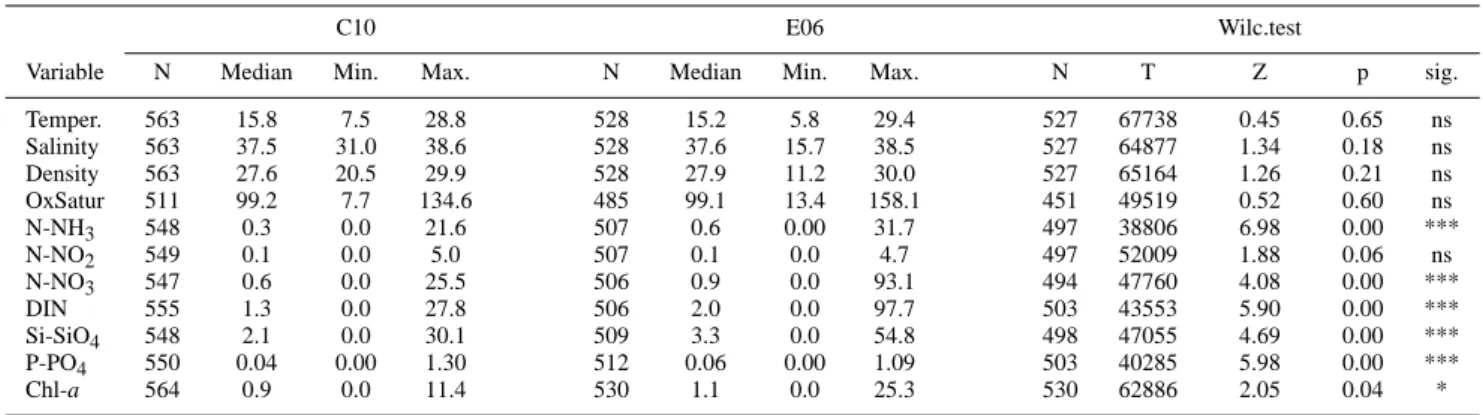
studied variables are available as supplemental mate-rial (see Appendix A, http://www.biogeosciences.net/4/673/ 2007/bg-4-673-2007-supplement.pdf). In Table 1 we list the number of valid observations, the medians, the ranges and the Wilcoxon Matched Pairs test results of comparison be-tween the two stations for all the available hydrological and
Table 1. Valid Number of samples, Median, Minimum, Maximum and Wilcoxon Matched Pairs test for all the variables at C10 and E06a.
C10 E06 Wilc.test
Variable N Median Min. Max. N Median Min. Max. N T Z p sig.
Temper. 563 15.8 7.5 28.8 528 15.2 5.8 29.4 527 67738 0.45 0.65 ns Salinity 563 37.5 31.0 38.6 528 37.6 15.7 38.5 527 64877 1.34 0.18 ns Density 563 27.6 20.5 29.9 528 27.9 11.2 30.0 527 65164 1.26 0.21 ns OxSatur 511 99.2 7.7 134.6 485 99.1 13.4 158.1 451 49519 0.52 0.60 ns N-NH3 548 0.3 0.0 21.6 507 0.6 0.00 31.7 497 38806 6.98 0.00 *** N-NO2 549 0.1 0.0 5.0 507 0.1 0.0 4.7 497 52009 1.88 0.06 ns N-NO3 547 0.6 0.0 25.5 506 0.9 0.0 93.1 494 47760 4.08 0.00 *** DIN 555 1.3 0.0 27.8 506 2.0 0.0 97.7 503 43553 5.90 0.00 *** Si-SiO4 548 2.1 0.0 30.1 509 3.3 0.0 54.8 498 47055 4.69 0.00 *** P-PO4 550 0.04 0.00 1.30 512 0.06 0.00 1.09 503 40285 5.98 0.00 *** Chl-a 564 0.9 0.0 11.4 530 1.1 0.0 25.3 530 62886 2.05 0.04 *
ans: not significant, * p<0.05: significant, *** p<0.001: highly significant.
1986 1988 1990 1992 1994 1996 1998 2000 2002 2004 0,01 0,03 0,05 0,07 0,10 0,30 0,50 0,70 1,00 3,00 5,00 7,00 10,00 c h l-a 1986 1988 1990 1992 1994 1996 1998 2000 2002 2004 0,01 0,03 0,05 0,07 0,10 0,30 0,50 0,70 1,00 3,00 5,00 7,00 10,00 c h l -a
Fig. 4. Chlorophyll-a samples (µg dm−3, log scale) collected at
C10 (above) and E06 (below).
biogeochemical variables over the 20-year period. Descrip-tive statistics reveals that the main differences between the two sites are due to the large dispersion in the E06 variable values, rather than to any differences in the trends of the cen-tral (median) values. Statistically high significant differences are observed for all the nutrients’ concentrations, except N-NO2and also, to a less extent (p<0.05), for the chlorophyll-a
values between the two areas.
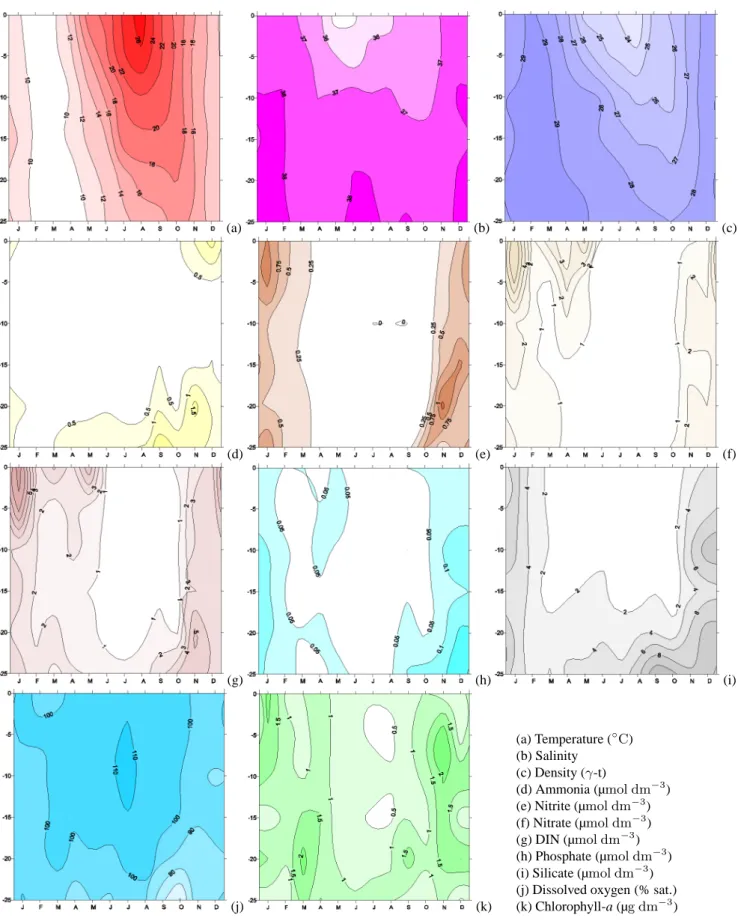
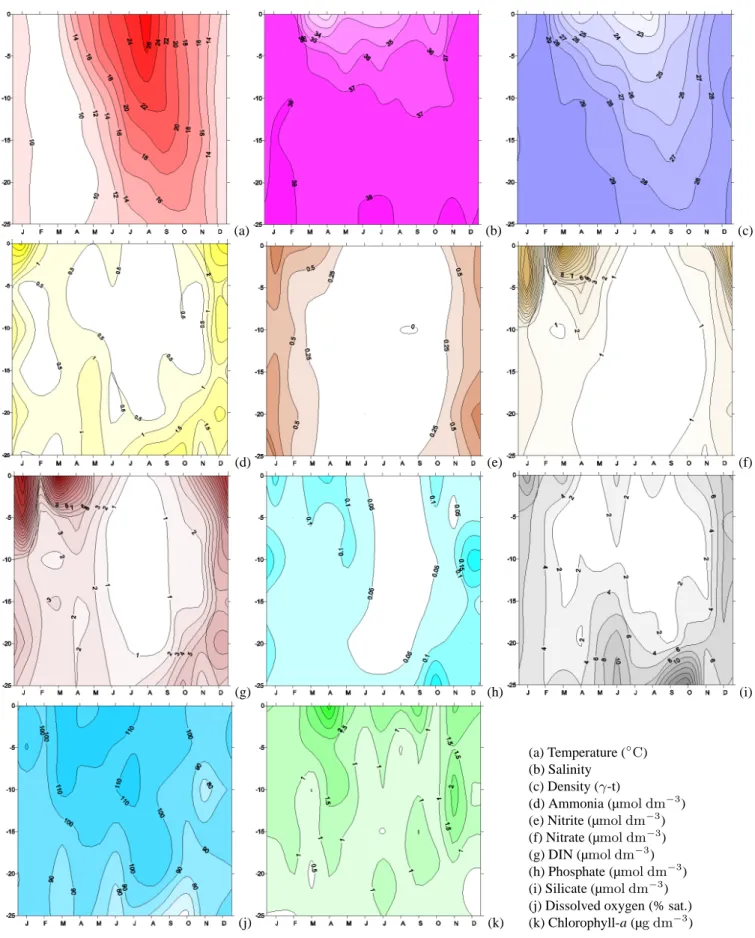
In order to study time (seasonal) and space (depth) fea-tures, which may explain those differences, and in order to provide an helpful analysis for model validation, we analyse the main features that result from all monthly median values, at every SL, shown in time-depth plots in Fig. 5 (C10) and in Fig. 6 (E06). Both sites show similar features in the hydro-logical variables. The density isolines (panel c) reveal that the water column is mixed between November and March and stratified for the rest of the year. Freshwater inputs, lim-ited to the top 10 m of the water column, affect the salinity fields in different ways from site to site. The salinity (panel b) at C10 begins to decrease in March, so that the minimum of surface salinity (S=34.6) is found in May–June, reflecting the first annual peak of the Po river discharge (Fig. 2). The salin-ity starts to increase in July, and in autumn the C10 area is less affected by the second peak of the Po river (S=36.3). The salinity at E06 has a much lower value in March, so it reaches a surface minimum earlier, in April (S=31.3), re-maining at constant values around 33–34 until August. In October it detects again the effect of the Po river peak with a second minimum surface value of 34.1.
The nutrients’ concentrations show similar distributions at both sites, with lower concentrations at C10. Nutrient pro-files are generally characterized by higher surface concen-trations down to a depth of 5–10 m. In the bottom 15 m of the water column, nutrient concentrations are either uniform (nitrate, phosphate in late summer) or increasing with depth (silicate, ammonium).
(a) (b) (c) (d) (e) (f) (g) (h) (i) (j) (k) (a) Temperature (◦C) (b) Salinity (c) Density (γ-t) (d) Ammonia (µmol dm−3) (e) Nitrite (µmol dm−3) (f) Nitrate (µmol dm−3) (g) DIN (µmol dm−3) (h) Phosphate (µmol dm−3) (i) Silicate (µmol dm−3) (j) Dissolved oxygen (% sat.) (k) Chlorophyll-a (µg dm−3)
(a) (b) (c) (d) (e) (f) (g) (h) (i) (j) (k) (a) Temperature (◦C) (b) Salinity (c) Density (γ-t) (d) Ammonia (µmol dm−3) (e) Nitrite (µmol dm−3) (f) Nitrate (µmol dm−3) (g) DIN (µmol dm−3) (h) Phosphate (µmol dm−3) (i) Silicate (µmol dm−3) (j) Dissolved oxygen (% sat.) (k) Chlorophyll-a (µg dm−3)
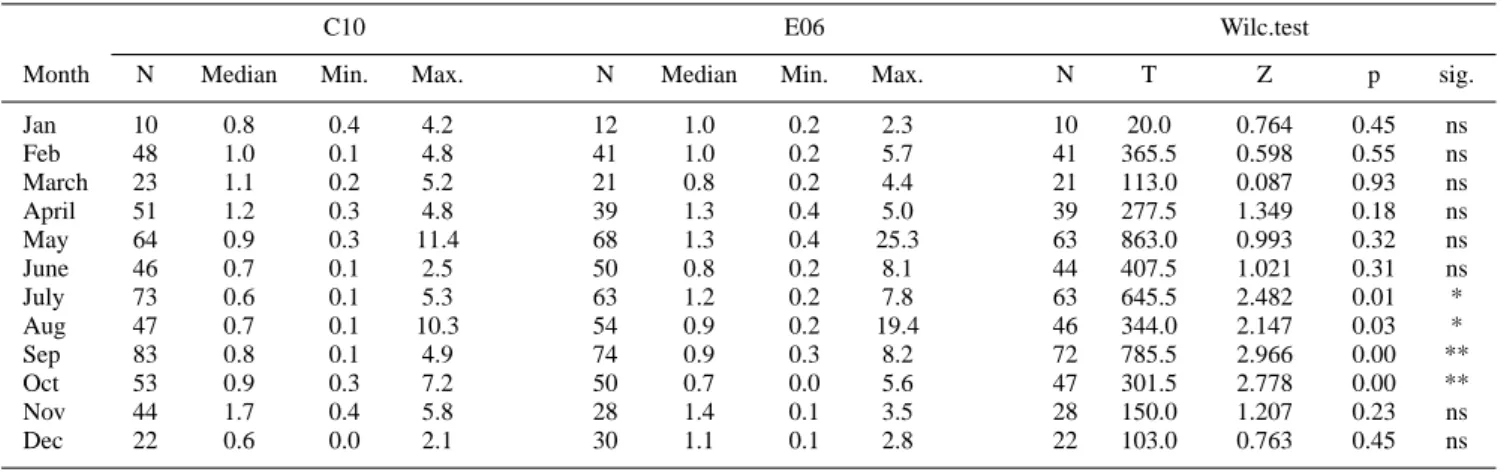
Table 2. Valid Number of samples, Median, Minimum, Maximum and Wilcoxon Matched Pairs test for chlorophyll-a at C10 and E06 on a
monthly scaleb.
C10 E06 Wilc.test
Month N Median Min. Max. N Median Min. Max. N T Z p sig.
Jan 10 0.8 0.4 4.2 12 1.0 0.2 2.3 10 20.0 0.764 0.45 ns Feb 48 1.0 0.1 4.8 41 1.0 0.2 5.7 41 365.5 0.598 0.55 ns March 23 1.1 0.2 5.2 21 0.8 0.2 4.4 21 113.0 0.087 0.93 ns April 51 1.2 0.3 4.8 39 1.3 0.4 5.0 39 277.5 1.349 0.18 ns May 64 0.9 0.3 11.4 68 1.3 0.4 25.3 63 863.0 0.993 0.32 ns June 46 0.7 0.1 2.5 50 0.8 0.2 8.1 44 407.5 1.021 0.31 ns July 73 0.6 0.1 5.3 63 1.2 0.2 7.8 63 645.5 2.482 0.01 * Aug 47 0.7 0.1 10.3 54 0.9 0.2 19.4 46 344.0 2.147 0.03 * Sep 83 0.8 0.1 4.9 74 0.9 0.3 8.2 72 785.5 2.966 0.00 ** Oct 53 0.9 0.3 7.2 50 0.7 0.0 5.6 47 301.5 2.778 0.00 ** Nov 44 1.7 0.4 5.8 28 1.4 0.1 3.5 28 150.0 1.207 0.23 ns Dec 22 0.6 0.0 2.1 30 1.1 0.1 2.8 22 103.0 0.763 0.45 ns
bns: not significant, * p<0.05: significant, ** p<0.01: very significant.
The water column is almost completely depleted in ammo-nia (panel d) throughout the year at C10, and between March and October at E06. Surface peaks are present at C10 in De-cember, while they are seen at E06 in December and January. Nitrite (panel e) remains at low concentrations at both sites: close to zero between April and October and slightly higher for the rest of the year, reaching a maximum in January. The nitrate time evolution (panel f) indicates that very low con-centrations are found between May and October at C10 and between June and September at E06. Because of the second Po river peak and the increase in the vertical mixing pro-cesses, which diffuse the bottom-regenerated nutrients, the entire water column shows high values during winter at both
sites. Dissolved inorganic nitrogen ([DIN]=[N-NO2
]+[N-NO3]+[N-NH3], panel g) reflects mainly the nitrate trend at
the surface and the ammonia trend at the bottom.
Phosphate concentrations (panel h) are close to zero at both sites, at all depths, during most of the year. Slightly higher concentrations are present in December and January, although E06 values are generally higher.
Silicate concentrations (panel i) are high throughout the water column at both sites in December and January, because of mixing processes, while are high only at the surface at E06 (e.g. in June), reflecting low salinity concentrations and therefore the Po river’s influence.
Dissolved oxygen (panel j) shows comparable concentra-tions at both sites, as well as a good general oxygenation of the waters and a progressive decrease of concentrations with depth, well revealing an opposite annual pattern compared to the ammonia, phosphate and silicate concentrations (panel d, h, i). Minimum values, well below saturation levels, are found in the deeper SL in September–October at the end of the stratification period. Successively, stratification is bro-ken by surface cooling and wind stirring action, redistribut-ing oxygen and nutrient concentrations throughout the whole
water column during the following months (November, De-cember).
Chlorophyll-a (panel k) shows a complex annual cycle at both stations. C10 surface waters are characterized by a Jan-uary peak and low values for the rest of the year. The lowest concentrations are found between May and October, corre-sponding to the stratified period (panel k) with low DIN and DIP (dissolved inorganic phosphate) concentrations. Subsur-face maxima, below a depth of 15 m in March and in the whole water column in November, coincide with the river nutrient inputs. E06 presents the highest chlorophyll-a con-centrations at the surface throughout the year, a pattern that is exactly opposite to that of salinity. In fact the highest val-ues are registered in March–April, September and Novem-ber, months that are characterized by very different hydro-logical and biogeochemical conditions.
3.2 The vertical variability of chlorophyll-a
The time-depth plots of Fig. 5 and Fig. 6 give an imme-diate overview of the median situation characterizing both sites’ environment. In this section we focus on an analysis of the variability. Monthly vertical profiles of
chlorophyll-a concentrchlorophyll-ations for both sites chlorophyll-are shown in Fig. 7, where
the Whisker plots represent the median values and the non-outliers ranges (Whisker, coeff.=1) at every SL. Table 2 presents the valid number of observations, the medians, the ranges and the Wilcoxon Matched Pairs test for
chlorophyll-a on chlorophyll-a monthly scchlorophyll-ale chlorophyll-at both stchlorophyll-ations.
Excluding exceptional values, classified as outliers, me-dian concentrations do not exceed 4 µg dm−3, and the scale is
limited to 8 µg dm−3. Similar vertical profiles are found
be-tween October and February, when mixing processes prevail. During the rest of the year, which is mainly characterized by strong temperature and salinity stratification, E06 maintains
January 0,008 0,04 0,08 0,4 0,8 4,0 8,0 3 0 6 12 18 24 d e p th (m ) February 0,008 0,04 0,08 0,4 0,8 4,0 8,0 3 0 6 12 18 24 d e p th (m ) March 0,008 0,04 0,08 0,4 0,8 4,0 8,0 3 0 6 12 18 24 d e p th (m ) April 0,008 0,04 0,08 0,4 0,8 4,0 8,0 3 0 6 12 18 24 d e p th (m ) May 0,008 0,04 0,08 0,4 0,8 4,0 8,0 3 0 6 12 18 24 d e p th (m ) June 0,008 0,04 0,08 0,4 0,8 4,0 8,0 3 0 6 12 18 24 d e p th (m ) July 0,008 0,04 0,08 0,4 0,8 4,0 8,0 3 0 6 12 18 24 d e p th (m ) August 0,008 0,04 0,08 0,4 0,8 4,0 8,0 3 0 6 12 18 24 d e p th (m ) September 0,008 0,04 0,08 0,4 0,8 4,0 8,0 3 0 6 12 18 24 d e p th (m ) October 0,008 0,04 0,08 0,4 0,8 4,0 8,0 3 0 6 12 18 24 d e p th (m ) November 0,008 0,04 0,08 0,4 0,8 4,0 8,0 3 0 6 12 18 24 d e p th (m ) December 0,008 0,04 0,08 0,4 0,8 4,0 8,0 3 0 6 12 18 24 d e p th (m )
Fig. 7. Monthly vertical profiles of chlorophyll-a medians (log-scale) and range of variability at C10 (red continuous line) and E06 (green
Table 3. Ridge Regression results for C10 (left) and E06 (right)c.
C10 E06
Beta s.e.Beta B s.e.B t(494) p sig. Beta s.e.Beta B s.e.B t(455) p sig.
Intercept – – 1.667 0.411 4.057 0.000 – Intercept – – 0.584 0.107 5.436 0.000 –
NO3 0.248 0.066 0.180 0.048 3.770 0.000 *** Salinity −0.361 0.055 −0.000 0.000 −6.578 0.000 ***
Salinity −0.258 0.064 −0.043 0.011 −4.023 0.000 *** NO3 0.130 0.057 0.068 0.030 2.282 0.023 *
Depth 0.195 0.056 0.004 0.001 3.453 0.001 ** NH3 −0.145 0.051 −0.131 0.045 −2.874 0.004 **
Temper. −0.113 0.055 −0.004 0.002 −2.055 0.040 * PO4 −0.083 0.041 −0.205 0.101 −2.033 0.043 *
%Ox.sat 0.084 0.048 0.001 0.001 1.759 0.079 ns SiSO4 0.159 0.060 0.086 0.032 2.671 0.008 **
NH3 −0.062 0.047 −0.070 0.053 −1.336 0.182 ns % Ox.sat 0.138 0.057 0.001 0.001 2.437 0.015 *
NO2 0.062 0.055 0.126 0.112 1.119 0.264 ns
cs.e.: standard error, ns: not significant, * p<0.05: significant, ** p<0.01: very significant, *** p<0.001: highly significant.
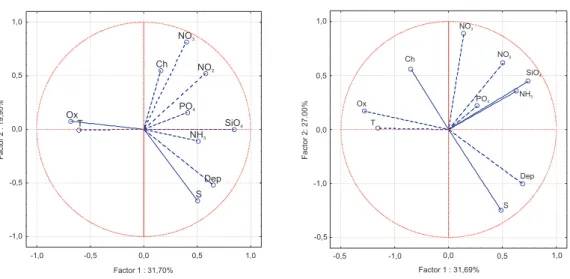
Dep T S Ox NH3 NO2 NO3 SiO4 PO4 Ch -1,0 -0,5 0,0 0,5 1,0 Factor 1 : 31,70% -1,0 -0,5 0,0 0,5 1,0 F a c to r 2 : 1 9 ,9 0 % 1,0 0,5 0,0 -0,5 -1,0 -0,5 -1,0 0,0 0,5 1,0 Factor 1 : 31,69% Factor2:27.00% Ch NO2 SiO4 Dep S T Ox PO4 NH3 NO3
Fig. 8. PCA: projection of the variables (T: temperature, S: salinity, Dep: depth, Ox: oxygen % sat., NH3, NO2, NO3, PO4, SiO4, Ch:
chlorophyll-a) on the factor plane (C10, left and E06, right).
higher concentrations in the surface layer, while C10 does the same mostly at deeper depths.
The annual cycle at C10 is characterized by minimum con-centrations between May and October, and maximum ones in November, followed by April, March and May, while the other months have intermediate values. Apart from October and November, E06 is generally characterized by high con-centrations limited to the top 5–10 m layer.
Statistically significant differences (Table 2) are found in July, August, September and October. The significant dif-ferences detected in July and August and the very significant ones in September are due to sensibly lower concentrations in the top 20 m at C10. October is the only month during which concentrations in the entire water column are very signifi-cantly higher at C10 than at E06. For the rest of the year, the chlorophyll-a profiles at C10 and E06 have opposite trends and cross each other at different depths between 10 and 20 m.
3.3 Relationships among variables
With the aid of principal component analysis (PCA) we in-tended to investigate which factors are related to the variabil-ity of, and which are the interconnections between, the phys-ical and biogeochemphys-ical variables, particularly in relation to the seasonal cycle and the loads of nutrients.
After the normalization of the non-normal distributions, we carried out the PCA and the Ridge Regression tests. The variables’ PCA projection on the factor plane is represented in Fig. 8. Among the variables, we also considered depth as an indicator that explains surface/bottom processes. The sum of the first two PC explained 51.61% of the total variance for C10 and 58.68% for E06. The factor plane representa-tion groups the variables in three quadrants for both starepresenta-tions: one quadrant is for salinity-depth covariance, a second one is for oxygen-temperature and a third one is for nutrients. At C10 ammonia is situated in the salinity-depth quadrant, opposite to the oxygen concentration. In this graphical rep-resentation chlorophyll-a is found in different quadrants: for C10 it is located in the nutrients quadrant, while for E06 it
has an intermediate position between nutrients and oxygen-temperature.
The Ridge regression results (Table 3) are listed accord-ing to the order in which the variable was introduced in the model equation, together with the consequent p–level of significance. At C10, the first highly significant positively-related variable is nitrate, followed by the highly significant negatively-related salinity, the very significant positive re-lation with depth and the significant negative rere-lation with temperature. The negative relation with ammonia and the positive one with nitrite are also introduced in the regression equation, although their relation is not significant. At E06, all the variables introduced in the model are at least signif-icant. The first highly significant negative relation is with salinity, followed by the significant positively-related nitrate, the very significant negative relation with ammonia, the sig-nificant negative relation with phosphate, the very sigsig-nificant positive relation with silicate and the significant positive re-lation with oxygen. The nutrient rere-lations were positive or negative depending on consumption or excess. The strongest chlorophyll-a dependence is then positive with nitrate at C10, followed by the hydrological variables, while at E06 it is neg-ative with salinity, followed by the nutrients’ concentrations.
3.4 Temperature, salinity and chlorophyll-a inter-annual
trends
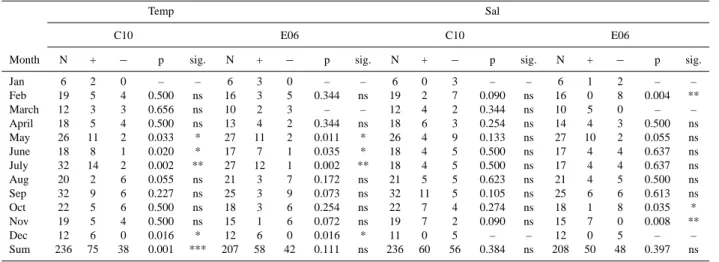
In order to analyse long-term variations in chlorophyll–a dynamics, we used the Cox-Stuart test for trends (Sect. 2) and we applied it both to the physical variables and to chlorophyll–a. The analysis of the surface water temperature (Table 4) shows a significant increase in May and June and a very significant one in July at both sites, in agreement with the rise in air temperature and annual heat fluxes observed in the Northern Adriatic Sea (Russo et al., 2002). Another significant increase is found in December at both sites, in-dicating a tendency towards milder winters. However, C10 is the only station showing a significant trend in the whole years median values. In fact, between August and November E06 is characterized by a negative temperature trend which, without being a significant value, still agrees with the regis-tered increasing flow of the Po river that causes floods dur-ing autumn (Raicich, 2003). The same feature is not found at C10, probably because the freshwater effect is confined to the Northern Adriatic Current region (Artegiani et al., 1997a).
This is further confirmed by the Cox-Stuart test results for surface salinity (Table 4). No significant trend is found at C10, either in spring, or in summertime, when the area may be reached by the Po river plume. Significant trends are in-stead seen at E06: a very significant decrease in February, a significant decrease in October and a very significant in-crease in November. In order to understand the relations be-tween the Po discharge and the physical variables, we have performed the Spearman Test for correlations on daily scale with a 1-week time lag between the observed run-off and the
observed salinity and temperature (Appendix A). Both sta-tions are generally influenced by the Po river’s spreading. C10 is mostly affected by temperature fields, since a larger effect may be detected during spring and summertime, when it feels the effect of the Po maximum in May, due mostly to snow melting, that slakens the thermocline formation. E06 is, instead, equally affected by temperature and salinity fields, since the impact of the river may be detect all year round and it is closer than at C10: thus, salinity and temperature values faster decrease than at C10.
The Cox-Stuart Sign test (Table 5) on chlorophyll–a re-veals no significant long-term trend in both the median and the dispersion. The weak negative trend in the C10 annual value is considered random, as is the slight increase at E06. On the other hand, C10 shows a significant increase in the central value in April, although this is not really relevant sidering the entire annual cycle. The variability is fairly con-stant, with a small indication of increase for both stations. Any missing result in the Cox-Stuart test is due to an insuffi-cient number of available comparisons.
4 Discussion
The hydrological and biogeochemical evolution presented in Sect. 3.1 shows that the C10 station is directly influenced by high river outflows, when the general circulation and strati-fication can favour the NE spreading of the Po plume. Con-versely, E06 is largely affected by the Po river run-off, irre-spective of their magnitude, and also by other smaller rivers, as confirmed by much lower salinity values for all of the non-mixed periods. Generally, the nutrient concentrations are higher in the near-surface region where the lowest salini-ties are observed. This is consistent with the role of the rivers as the major nutrient sources for the region.
Several works (e.g., Fonda Umani, 1996; Mozetic et al., 1998; Fonda Umani et al., 2005) have showed that the November blooming of the Northern Adriatic is poorly con-trolled by micro- or meso-zooplankton. Consequently, the surface peaks of winter ammonia are most likely due to bac-terial activity on senescent phytoplankton cells. The bottom 5 m of the water columns show concentrations that well re-flect a trend opposite to that of the dissolved oxygen in the same period, indicating benthic recycling of ammonia. The role of benthic nutrient remineralization is then an important factor that can be inferred from the monthly analysis.
Low salinity values during periods of low nitrate con-centrations suggest that most of the land-derived nitrate is taken up by phytoplankton. However, while C10 is charac-terized by low concentrations of chlorophyll-a, E06 main-tains higher values. The absence of a gradient in nitrate and the different response of chlorophyll–a at C10 and E06 may not be explained only by consumption. Different controlling factors may affect phytoplankton growth in the two areas. At C10, chlorophyll-a concentrations seem to pretty well follow
Table 4. Cox-Stuart test results for surface temperature (left) and salinity (right) at C10 and E06d.
Temp Sal
C10 E06 C10 E06
Month N + − p sig. N + − p sig. N + − p sig. N + − p sig.
Jan 6 2 0 – – 6 3 0 – – 6 0 3 – – 6 1 2 – – Feb 19 5 4 0.500 ns 16 3 5 0.344 ns 19 2 7 0.090 ns 16 0 8 0.004 ** March 12 3 3 0.656 ns 10 2 3 – – 12 4 2 0.344 ns 10 5 0 – – April 18 5 4 0.500 ns 13 4 2 0.344 ns 18 6 3 0.254 ns 14 4 3 0.500 ns May 26 11 2 0.033 * 27 11 2 0.011 * 26 4 9 0.133 ns 27 10 2 0.055 ns June 18 8 1 0.020 * 17 7 1 0.035 * 18 4 5 0.500 ns 17 4 4 0.637 ns July 32 14 2 0.002 ** 27 12 1 0.002 ** 18 4 5 0.500 ns 17 4 4 0.637 ns Aug 20 2 6 0.055 ns 21 3 7 0.172 ns 21 5 5 0.623 ns 21 4 5 0.500 ns Sep 32 9 6 0.227 ns 25 3 9 0.073 ns 32 11 5 0.105 ns 25 6 6 0.613 ns Oct 22 5 6 0.500 ns 18 3 6 0.254 ns 22 7 4 0.274 ns 18 1 8 0.035 * Nov 19 5 4 0.500 ns 15 1 6 0.072 ns 19 7 2 0.090 ns 15 7 0 0.008 ** Dec 12 6 0 0.016 * 12 6 0 0.016 * 11 0 5 – – 12 0 5 – – Sum 236 75 38 0.001 *** 207 58 42 0.111 ns 236 60 56 0.384 ns 208 50 48 0.397 ns
d+: number of increases, −: number of decreases, ns: not significant, * p<0.05: significant, ** p<0.01: very significant, *** p<0.001: highly significant.
Table 5. Cox-Stuart test results for chlorophyll-a at C10 (left) and E06 (right)e.
C10 E06
cent. dis. cent. disp.
Month N + - p sig. + - p sig. N + - p sig. + - p sig.
Jan 10 5 0 – – 2 0 – – 12 5 1 0.109 ns 1 2 – – Feb 48 9 15 0.240 ns 4 4 0.637 ns 40 7 13 0.132 ns 3 3 0.656 ns March 23 6 5 0.500 ns 4 1 – – 21 7 3 0.172 ns 3 2 – – April 51 22 3 0.006 ** 5 4 0.500 ns 38 11 8 0.324 ns 4 5 0.500 ns May 64 17 15 0.393 ns 5 3 0.363 ns 68 16 18 0.393 ns 10 6 0.227 ns June 46 13 10 0.365 ns 8 3 0.113 ns 50 14 11 0.368 ns 4 3 0.500 ns July 73 12 24 0.075 ns 5 4 0.500 ns 62 16 15 0.399 ns 8 2 0.055 ns Aug 43 10 13 0.365 ns 5 6 0.500 ns 54 18 9 0.122 ns 5 3 0.363 ns Sep 83 20 21 0.399 ns 5 5 0.623 ns 74 19 17 0.378 ns 4 4 0.637 ns Oct 53 11 15 0.340 ns 4 4 0.637 ns 50 9 16 0.194 ns 3 5 0.363 ns Nov 44 6 15 0.058 ns 7 4 0.274 ns 28 5 9 0.212 ns 3 4 0.500 ns Dec 22 0 11 – – 3 2 – – 30 9 6 0.304 ns 3 4 0.500 ns Sum 278 131 147 0.266 ns 48 37 0.223 ns 262 136 126 0.341 ns 51 43 0.261 ns
ecent.: central trend, disp.: data dispersion, +: number of increases, −: number of decreases, ns: not significant, **p<0.01: very significant.
the annual cycle of nutrients. At E06, every period of high concentration is followed by a period of low concentration, indicating that some factor acts successively and regulates phytoplankton abundance. Nutrients have shown to be suf-ficient and sometimes in excess at this site and are thus not limiting the growth. We suppose that zooplankton grazing, whose annual cycle is usually out of phase with that of phy-toplankton (e.g. in the Adriatic, Fonda Umani, 1996) may be one of the main regulating factors of the chlorophyll-a pat-tern.
Phosphate is considered as the principal nutrient limiting primary production in the region (e.g. Gilmartin et al., 1990). Socal et al. (1999) found that the Adriatic Surface Water (ASW) of the photic layer of the Otranto Strait was
char-actherized by an excess of nitrogen (N:P=50). While most of the nitrogen is advected out of the northern basin, phospho-rous is efficiently removed from the water column, brought to organic form and possibly buried in the bottom sediments on the Adriatic shelf. However, even though Socal et al. (1999) confirmed the thesis of P-limited Adriatic, the signif-icant presence of diatoms was explained by new production sustained by regenerative processes and DOP and DON as important sources of nutrients. Degobbis et al. (2005) anal-ysed changes in nutrient ratios in relation to mucilage events in the northern Adriatic. While DIN was mostly correlated to the Po river outflow, phosphate was efficiently controlled by phytoplankton assimilation. During a low freshwater input, the increased phytoplankton standing crop was ascribed to
more efficient DIN assimilation and faster recycling of phos-phate. Our data analysis shows that high concentrations of chlorophyll-a are detected during months and at depths at which the phosphate concentrations are close to zero. Fol-lowing these previous attempts to explain the phoshate be-haviour in the Adriatic Sea, we confirm that phosphorus is consumed and rapidly remineralized to sustain abundant biomass production in the Adriatic Sea.
Despite the observed coherent seasonal coupling be-tween physical and hydrochemical features (Figs. 5, 6), chlorophyll-a shows a complex annual cycle in both areas. Nevertheless, the chlorophyll-a vertical profiles are similar when mixing processes prevail (Fig. 7). For the rest of the year, which is characterized by a strong stratification of tem-perature and salinity, E06 maintains higher concentrations in the surface layer, where it is mostly affected by riverine loads, while C10 does so mostly at intermediate depths, be-cause a smaller presence of photo-attenuating materials may allow photosynthesis in the entire water column (Vichi et al., 2003b).
This is also confirmed by the PCA (Fig. 8). The first prin-cipal component of the PCA captures the effect of periodic stratification, while the second component highlights the ef-fect of river inputs. At C10, chlorophyll-a concentrations are mainly correlated to riverine run-off, while at E06, the nutri-ents being at least sufficient, the correlation with the seasonal cycle is strongly positive and opposite to depth-salinity, be-cause the highest concentrations are found at the surface. A further confirmation comes from the Ridge Regression test results (Table 3). At C10, the only nutrient in the equation is nitrate, which is also the closest variable to chlorophyll-a in the PCA projection. The following correlations are with the physical variables and are typical of offshore areas af-fected by land-derived nutrients and mostly characterized by blooms at intermediate depths. At E06, the Ridge Regres-sion highlights a strongly opposite trend with salinity, which is responsible for the surface blooms and is well-shown in the PCA diagram (Fig. 8). Finally, the test shows a posi-tive correlation with nitrate and silicate, indicating a contin-uous availability, and a negative correlation with ammonia and phosphate, that are therefore consumed at the site.
The Cox-Stuart test (Sect. 3.4) for the analysis of long-term trends detected significant changes only for the physical variable, but not for chlorophyll-a. A possible explanation for this behaviour lies in the different relationship that both stations have with the river run-off. Both areas detect the ef-fect of the warming (Corti et al., 1999; Rixen et al., 2005), but only E06 is likely to show the effects of the increasing precipitation. In fact, both stations are affected by the rise in summer temperature, due to higher heat fluxes. But, while at E06 the rise in temperature is balanced by an autumn reduc-tion, due to the large quantity of freshwater inflow, at C10 this does not happen, since no large effect is detected of the Po water spreading there during autumn. Therefore at C10 the water generally becomes warmer.
The absence of a trend was also found in model simula-tions (Vichi et al., 2003a). Even if we are not able to as-sess the climatological change, the Cox-Stuart test agrees pretty well with the Eastern Mediterranean Climatic Tran-sient (EMCT). The EMCT is a global change in the meteo-oceanographic conditions happening over the Mediterranean Sea during recent decades (Rixen et al., 2005), and is defined as a collection of events, such as rising temperature and fewer rainy days with heavier precipitation.
It is interesting to compare our results with other highly productive European regional seas, as the Black Sea and the Baltic Sea. Nehring (1992) analysed a 30-years (1958-1989) biogeochemical data set in the Baltic proper and found that, except for the period 1969–1977, nutrient concentrations no longer increased, remaining at stable, but high levels. Dur-ing periods of water renewal, a strong correlation was de-tected between salinity and nutrients. Oxygen was found to increase, although no significant trend was identified. The strong deterioration of oxygen conditions and the phosphate accumulation in central Baltic deep waters were attributed to the absence of water renewal caused by climate changes in the northern emisphere and worsened by the entrance of North Sea polluted waters through the Danish Strait into the Baltic.
Gomoiu (1992) synthetized in her work the ecological changes in the NW Black Sea in the period 1972–1992: increasing quantities of nutrients and organic matter, oxy-gen imbalance and appearance of hypoxic and anoxic phe-nomena, mass mortalities of benthic organisms, reduction in diversity at different levels, development of opportunistic species. The author concluded that the ecosystem reflected a regressive evolution and a fragile and unstable phase.
In both cases, and in contrast with our results, pos-itive trends were detected for phytoplankton biomass (chlorophyll–a) and primary productivity. We believe that the efficient mixing, especially due to local wind episodes, may prevent the eutrophication of the Adriatic Sea. Fur-thermore, we analysed a timeseries data postponed to the reduced quantities of phosphorus used in detergents in the
late 1980s. Degobbis et al. (2000) and Bernardi Aubry
et al. (2004) reported, in fact, a phosporous decrease in their works. Despite this, we are not able to define a possible associated chlorophyll-a change on this temporal scale and with this high natural variability. We can then hypothesize that: i) a real change did not happen; ii) the temporal scale of the chlorophyll-a processes might have not fit with the other variable trends; iii) the ecosystem evolution might have favoured new species in the composition of the phytoplank-ton population without changing the total stock; iv) a pos-sible trend might exist at the extreme concentrations, which are not sufficiently represented in the sample.
4.1 Trophic variability of the NW Adriatic
The descriptive statistical analysis presented in Sect. 3.1 indi-cates that the C10 and E06 areas have significantly compara-ble hydrological characteristics, while they are differently af-fected by the river’s discharge. However, chlorophyll-a only shows a weakly significant difference. High-frequency inter-connected physical and biological processes are thus likely to modulate chlorophyll-a dynamics, also when the nutri-ents’ availability is dominant. We may thus define these sta-tions as highly variable and varying between meso and meso-oligotrophic characteristics.
There is no international agreement between different in-dicators and indices regarding the assessment of the trophic status of seawater, mostly due to different criteria, method-ologies of data analysis and restrictions to selected
re-gions. For example, Giovanardi and Tromellini (1992)
refers to oligotrophic status for the Northern Adriatic wa-ters characterized by chlorophyll–a levels <1.7 µg dm−3,
Ig-natiades (2005) for Aegean Sea waters having chlorophyll–
a values <0.5 µg dm−3, while Babin et al. (1996) for
Northern Atlantic waters with chlorophyll–a concentrations
<0.05 µg dm−3. We prefer to analyse the trophic status of
a certain region as the result of the complex interactions be-tween all the dynamic processes that in time, as seasonal cy-cle, and space, as dynamic in the water column, bring to spe-cific nutrients and chlorophyll–a patterns, oxygen saturation and vertical stability of the water column. Our main interest is thus not an absolute definition of the trophic status of each station, but a relative comparison between the areas to find possible differences or similarities.
The Wilcoxon Matched Pairs test (Table 1) shows that, considering all the data set (in time and space), the two sites are affected by similar hydrodynamics, highly significant dif-ferent nutrient inputs and slightly significant differences in chlorophyll–a concentrations. The same test applied to the intra-annual variability of chlorophyll–a (Table 2) shows that those differences are due to significant differences between June and August, when E06 maintains higher concentrations, and vice versa in September. On the other hand, the analy-sis of the intra-annual variability, considering also the differ-ent depths, presdiffer-ented in time-depth plots (Fig. 5 and Fig. 6) shows that, in the same period, both stations are character-ized by a reduction in nutrient concentrations, stable oxy-genation, stratified waters and chlorophyll–a values with the lowest annual values (Fig. 7). Besides, the slightly higher values of chlorophyll–a in the deepest layer at both stations are a clear indicator of photosynthetic activity of the bottom SL and thus water transparency. This leads us to consider the areas as trophically much similar than previously reported in literature (e.g., Alberighi et al., 1997; Pugnetti et al., 2003, 2004; Bernardi Aubry et al., 2006).
5 Conclusions
The long-term set of hydrological and biogeochemical data coming from the C10 and E06 stations, located in the NW Adriatic Sea, allowed us to formulate a reasonable picture of the NW Adriatic biogeochemical variability and we are now able to answer to the main questions that guided our scientific work.
(i) Generally, the two stations cannot be considered troph-ically different, as some previous literature had done. Our data analysis show similarities between the two ar-eas, concerning the chlorophyll–a response to differ-ent physical and biological features. Nutridiffer-ents stand-ing stocks cannot be considered a sufficient criterion to characterize conditions and trophic differences between different areas.
(ii) The two stations may be characterized by different con-trolling factors regarding the chlorophyll–a dynamics. C10 chlorophyll-a is mainly controlled by periodic river inputs. E06 is strongly correlated with the seasonal cy-cle, may be efficiently grazed by zooplankton and a high presence of photo-attenuating material may limit the photosynthesis at the deepest SL. We suggest the importance of studying the coupling between the phy-toplankton cycle and zooplankton abundance and distri-bution, since zooplankton is an essential controlling fac-tor in the phytoplankton trend and evolution throughout the trophic chain characterizing an area.
(iii) Data analysis shows that we should review the thesis of phosphorous being a classical growth-limiting fac-tor of phytoplankton abundance in the NW Adriatic
Sea. Other phosphorous sources besides
orthophos-phate, such as organic phosphorous and fast regener-ation processes, can contribute to maintaining phyto-plankton growth. It is therefore necessary to resolve the fast remineralization processes in the pelagic domain on a higher frequency scale in order to clarify the effective co-limiting factors.
(iiii) The absence of a significant chlorophyll-a trend in time at either site, in agreement with model results of sce-nario simulations (Vichi et al., 2003a), is not sufficient to allow us to assume that the communities or other in-dicator did not change. Previous studies, based on a shorter time scale (Pugnetti et al., 2003; Bernardi Aubry et al., 2006), could not typify any significant difference in community composition. Our next step will there-fore be to couple this study with an analysis of the abundance, biodiversity and distribution of the different species of phytoplankton during the same study period in order to find if an intra- and inter-annual variability is present in the long term.
Appendix A
Time series plots of the studied variables (except
chlorophyll–a, presented in Fig. 4) and the analysis of the correlation between the physical oceanic variable (temperature and salinity) and the Po river’s discharge (data scatterplots and Spearman Test) are available as supplemen-tal material at http://www.biogeosciences.net/4/673/2007/ bg-4-673-2007-supplement.pdf.
Acknowledgements. Data from 1999 to date have been collected
in the framework of the EU programs INTERREG II and IN-TERREG III Italia-Slovenia. We thank the ISMAR colleagues for having taken part in most of the data collection and also for critical contributions to the manuscript. L. Tedesco, M. Vichi and G. Socal acknowledge support from the Italian project VECTOR. We are grateful to three anonymous referees for their critical comments, which helped us to improve the manuscript. R. King is acknowledged for the language review of this paper and the Editor (E. Boss) for his continued support during the editorial process. Edited by: E. Boss
References
Alberighi, L., Franco, P., Bastianini, M., and Socal, G.: Pro-duttivit´a primaria, abbondanza fitoplanctonica e campo di ir-radianza, in due stazioni dell’Adriatico settentrionale. Crociere marzo e giugno 1994, Biologia Marina Meditterranea, 4, 17–23, 1997.
Artegiani, A., Bregant, D., Paschini, E., Pinardi, N., Raicich, F., and Russo, A.: The Adriatic Sea General Circulation. Part I: Air-sea interactions and water mass structure, J. Phys. Oceanogr., 27(8), 1492–1514, 1997a.
Artegiani, A., Bregant, D., Paschini, E., Pinardi, N., Raicich, F., and Russo, A.: The Adriatic Sea General Circulation. Part II: Baro-clinic Circulation Structure, J. Phys. Oceanogr., 27(8), 1515– 1532, 1997b.
Babin M., Morel A., Claustre H., Bricaud A., Kolber Z., Falkowski P.G.: Nitrogen-and irradiance-dependent variations of the maxi-mum quantum yield of carbon fixation in eutrophic, mesotrophic and oligotrophic marine systems, Deep-Sea Res., 43(8), 1241– 1272, 1996.
Bernardi Aubry, F., Berton, A., Bastianini, M., Socal, G., and Acri, F.: Phytoplankton succession in a coastal area of the NW Adri-atic, over a 10-year sampling period (1990–1999), Cont. Shelf Res., 24(1), 97–115, 2004.
Bernardi Aubry, F., Acri, F., Bastianini, M., Bianchi, F., Cassin, D., Pugnetti, A., and Socal, G.: Seasonal and interannual variations of phytoplankton in the Gulf of Venice (Northern Adriatic Sea), Chemistry and Ecology, 22, 1, 71–91, 2006.
Corti, S., Molteni, F., and Palmer, T. N.: Signature of recent climate change in frequencies of natural atmospheric circulation regimes, Nature, 398, 799–802, 1999.
Degobbis, D., Precali, R., Ivan˘ci´c, I., Smodlaka, N., Fuks, D., and Kveder, S.: Long-term changes in the northern Adriatic ecosys-tem related to anthropogenic eutrophication, Int. J. Environ. Pol-lut., 13(1–6), 495–533, 2000.
Degobbis, D., Precali, R., Ferrari, C., Djakovac, T., Rinaldi, A., Ivan˘ci´c, I., and Smodlaka, N.: Changes in nutrient concentra-tions and ratios during mucilage events in the period 1999-2002, Science of the Total Environment, 353, 103–114, 2005. Fonda Umani, S.: Pelagic biomass and production in the Adriatic
Sea, Sci. Mar., 60(2), 65–77, 1996.
Fonda Umani, S., Milani, L., Borme, D., de Olazabal, A., Parlato, S., Precali, R., Kraus, R., Lu˘ci´c, D., Njire, J., Totti, C., Ro-magnoli, T., Pompei, M., Cangini, M.: Inter-annual variations of planktonic food webs in the northern Adriatic Sea, Science of the Total Environment, 353, 218–231, 2005.
Franco, P. and Michelato, A.: Northern Adriatic Sea: oceanogra-phy of the basin proper and of the western coastal zone, Marine Coastal Eutrophication, The Science of the Total Environment, pp. 35–62, 1992.
Gilmartin, M., Degobbis, D., Relevante, N., and Smodlaka, N.: The mechanism controlling plant nutrient concentrations in the Northern Adriatic Sea, Int. Rev. Gesamten. Hydrobiol., 75, 425– 445, 1990.
Giovanardi F. and Tromellini E.: Statistical assessment of trophic conditions. Application of the OECD methodology to the ma-rine environment, Science of the Total Environment Supplement, 211–234, 1992.
Gomoiu, M.-T.: Marine eutrophication syndrome in the north-western part of the Black Sea, Science of the Total Environment Supplement, 683–692, 1992.
Grasshoff, K., Erhardt, M., and Kremling, K.: Methods of Seawater Analysis, Wiley-VCH, Weinheim, 1999.
Holm-Hansen, O., Lorenzen, C. J., Holmes, R. W., and Strickland, J. D. H.: Fluorometric determination of chlorophyll, J. Cons. perm. int. Explor. Mer., 30, 3–15, 1965.
Ignatiades, L.: Scaling the trophic status of the Aegean Sea, eastern Mediterranean, Journal of Sea Research, 54(1), 51–57, 2005. Jeffries, M. A., and Lee, C. M.: A climatology of the Northern
Adriatic Sea’s response to bora and river forcing, J. Geophys. Res., 112, C03S02, doi:10.1029/2006JC003664, 2007.
Mauri, E., Poulain, P.-M., and Ju˘zni˘c-Zonta, ˘Z.: MODIS chloro-phyll variability in the northern Adriatic Sea and relation-ship with forcing parameteres, J. Geophys. Res., 112, C03S11, doi:10.1029/2006JC003545, 2007.
Mozetic, P., Fonda Umani, S., Cataletto, B., Malej, A.: Seasonal and inter-annual plankton variability in the Gulf of Trieste (north-ern Adriatic), ICES Journal of Marine Science, 55(4), 711–722, 1998.
Nehring, D.: Eutrophication in the Baltic Sea, Science of the Total Environment Supplement, 673–682, 1992.
Precali, R., Giani, M., Marini, M., Grilli, F., Ferrari, C. F., Pecar, O., Paschini, E.: Mucilaginous aggregates in the northern Adriatic in the period 1999–2002: typology and distribution, Science of the Total Environment, 353, 10–23, 2005.
Pugnetti, A., Acri, F., Bastianini, M., Bernardi Aubry, F., Berton, A., Bianchi, F., Noak, P., and Socal, G.: Primary production processes in the North-Western Adriatic Sea, Atti Assoc. Ital. Oceanol. Limnol., 16, 15–28, 2003.
Pugnetti, A., Acri, F., Alberighi, L., Barletta, D., Bastianini, M., Bernardi Aubry, F., Berton, A., Bianchi, F., Socal, G., and Totti, C.: Phytoplankton photosynthetic activity and growth rates ob-servations in the NW Adriatic Sea, Chemistry and Ecology, 20, 6, 399–409, 2004.
Raicich, F.: On the fresh water balance of the Adriatic Sea, J. Mar. Syst., 9, 305–319, 1996.
Raicich, F.: Recent evolution of sea-level extremes in the North Adriatic, Cont. Shelf Res., 23, 225–235, 2003.
Rixen, M., Bekers, J. M., Levitus, S., Antonov, J., Boyer, T., Mail-lard, C., Fichaut, M., Balopoulus, E., Iona, S., Dooley, H., Gar-cia, M. J., Manca, B., Giorgetti, A., Manzella, G., Mikhailov, N., Pinardi, N., and Zavatarelli, M.: The Western Mediterranean Deep Water: A proxy for climate change, Geophys. Res. Lett., 32, L12 608, doi:10.1029/2005GL022702, 2005.
Russo, A., Rabitti, S., and Bastianini, M.: Decadal Climatic Anomalies in the Northern Adriatic Sea Inferred from a New Oceanographic Data Set, Marine Ecology, 23(1), 340–351, 2002. Socal, G., Boldrin, A., Bianchi, F., Civitarese, G., De Lazzari, A., Rabitti, S., Totti, C., and Turchetto, M. M.: Nutrient, particulate matter and phytoplankton variability in the photic layer of the Otranto Strait, Journal of Marine Systems, 20, 381–398, 1999. Socal, G., Pugnetti, A., Alberighi, A., and Acri, F.:
Observa-tions on phytoplankton productivity in relation to hydrography in the Northern Adriatic, Chemistry and Ecology, 18(1–2), 61– 73, 2002.
Strickland, J. D. H. and Parsons, T. R.: A manual for sea water analysis, Bulletin of the Fisheries Research Board of Canada, Ottawa, Canada, 1972.
Vichi, M., May, W., and Navarra, A.: Response of a complex ecosystem model of the northern Adriatic Sea to a regional cli-mate change scenario, Clicli-mate Res., 24, 141–159, 2003a. Vichi, M., Oddo, P., Zavatarelli, M., Coluccelli, A., Coppini, G.,
Celio, M., Umani, S. F., and Pinardi, N.: Calibration and valida-tion of a one-dimensional complex marine biogeochemical fluxes model in different areas of the northern Adriatic shelf, Ann. Geo-phys., 21, 413–436, 2003b.
Winkler, L. W.: ¨Uber die Bestimmung des im Wasser gel¨osten Sauerstoffs, Fresenius’ Journal of Analytical Chemistry, 53(11), 665–672, 1914.
Zavatarelli, M., Raicich, F., Bregant, D., Russo, A., and Artegiani, A.: Climatological biogeochemical characteristics of the Adri-atic Sea, J. Mar. Syst., 18, 1, 227–263, 1998.