HAL Id: hal-00297875
https://hal.archives-ouvertes.fr/hal-00297875
Submitted on 22 Feb 2007HAL is a multi-disciplinary open access
archive for the deposit and dissemination of sci-entific research documents, whether they are pub-lished or not. The documents may come from teaching and research institutions in France or abroad, or from public or private research centers.
L’archive ouverte pluridisciplinaire HAL, est destinée au dépôt et à la diffusion de documents scientifiques de niveau recherche, publiés ou non, émanant des établissements d’enseignement et de recherche français ou étrangers, des laboratoires publics ou privés.
NW Adriatic Sea variability in relation to chlorophyll-a
dynamics in the last 20 years (1986?2005)
L. Tedesco, G. Socal, F. Bianchi, F. Acri, D. Veneri, M. Vichi
To cite this version:
L. Tedesco, G. Socal, F. Bianchi, F. Acri, D. Veneri, et al.. NW Adriatic Sea variability in relation to chlorophyll-a dynamics in the last 20 years (1986?2005). Biogeosciences Discussions, European Geosciences Union, 2007, 4 (1), pp.651-685. �hal-00297875�
BGD
4, 651–685, 2007 Chlorophyll-a variability in the NW Adriatic L. Tedesco et al. Title Page Abstract Introduction Conclusions References Tables Figures ◭ ◮ ◭ ◮ Back Close Full Screen / EscPrinter-friendly Version Interactive Discussion
EGU
Biogeosciences Discuss., 4, 651–685, 2007 www.biogeosciences-discuss.net/4/651/2007/ © Author(s) 2007. This work is licensed under a Creative Commons License.
Biogeosciences Discussions
Biogeosciences Discussions is the access reviewed discussion forum of Biogeosciences
NW Adriatic Sea variability in relation to
chlorophyll-a dynamics in the last 20
years (1986–2005)
L. Tedesco1,3, G. Socal2, F. Bianchi2, F. Acri2, D. Veneri2, and M. Vichi3
1
University of Bologna, Centro Interdipartimentale di Ricerca per le Scienze Ambientali, via S. Alberto 163, 48100 Ravenna, Italy
2
CNR – ISMAR, Istituto di Scienze Marine, Castello 1364/a, 30122 Venezia, Italy
3
INGV – CMCC, Euro-Mediterranean Center for Climate Change, via D. Creti 12, 40128 Bologna, Italy
Received: 6 February 2007 – Accepted: 10 February 2007 – Published: 22 February 2007 Correspondence to: L. Tedesco ([email protected])
BGD
4, 651–685, 2007 Chlorophyll-a variability in the NW Adriatic L. Tedesco et al. Title Page Abstract Introduction Conclusions References Tables Figures ◭ ◮ ◭ ◮ Back Close Full Screen / EscPrinter-friendly Version Interactive Discussion
EGU
Abstract
This paper presents a long-term time series (1986–2005) of hydrological and biogeo-chemical data, both published and unpublished. Data were collected in the north-western area of the Adriatic Sea, at two stations that are considered hydrodynamically and trophically different. The time series have been statistically and graphically
inves-5
tigated on a monthly scale in order to find not only possible chlorophyll-a trends over time, but also links between the concentrations of chlorophyll-a and the variability in the environment, as well as trophic differences between the two areas. Basically, in both cases the statistical test results show no significant trends in either the average chlorophyll-a values or in dispersion of the data, in contrast with significant trends in
10
temperature and salinity. The two areas have similar hydrological features, yet they present significant differences in the amount of nutrient inputs: these are in fact higher at the coastal site, which is characterized by a prevalence of surface blooms, while they are lower at the offshore station, which is mainly affected by intermediate blooms. Nonetheless, throughout the whole water column, chlorophyll-a concentrations are only
15
slightly different. Both areas are affected by riverine discharge, though in the first case considered chlorophyll-a concentrations are also driven strongly by the seasonal cy-cle. Finally, the results show that the two stations are not trophically different, although some controlling factors, such as zooplankton grazing in one case and light attenuation in the other, may regulate the growth of phytoplankton.
20
1 Introduction
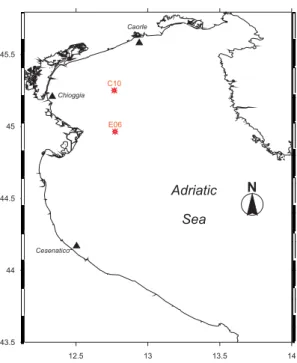
The Northern Adriatic Sea (Fig.1) is a shallow shelf basin with an average depth of 35 m and a prevalent cyclonic circulation of water masses (Artegiani et al.,1997a). The area is largely affected by riverine inputs that provide the basin with a significant flow of freshwater and land-derived nutrients. The Po river is by far the largest Italian river:
25
BGD
4, 651–685, 2007 Chlorophyll-a variability in the NW Adriatic L. Tedesco et al. Title Page Abstract Introduction Conclusions References Tables Figures ◭ ◮ ◭ ◮ Back Close Full Screen / EscPrinter-friendly Version Interactive Discussion
EGU
inter-annual variability (st. dev.=1056 m3s−1), with peaks in May, mainly due to snow
melting, and in October–November, because of high precipitation (Fig. 2). Further-more, the Northern coast has several smaller rivers that contribute to the overall flow. Consequently, the hydrodynamics of the Northern Adriatic Sea are quite complex and strongly affected by large variations in heat fluxes and the volume of incoming
fresh-5
water (Artegiani et al.,1997a). A temporal succession of two different hydrodynamic patterns has been recognized: between November and March, the westernmost waters are diluted mainly by the Po River outflow and remain separated from the highly saline and vertically-mixed offshore waters thanks to a frontal system located 8–16 km from the coast. The dissolved and particulate matter, coming from the land, therefore
re-10
mains more or less confined. Between April and October, warmer waters diluted by freshwater inflows are confined to the surface layer and reach almost all of the North-ern basin. During that period, one or more pycnoclines separate the water masses of intermediate density, while the high-density waters are confined near the bottom (Artegiani et al.,1997a).
15
Phytoplankton abundance and distribution is largely dependent on nutrients and light availability, but also on the stability of the water column. The large periodic modification in the structure and dynamics of the Northern Adriatic Sea causes large spatial and temporal distribution of phytoplankton species composition, biomass and production
(Fonda Umani,1996). A general west-to-east decreasing gradient in the
phytoplank-20
ton standing crop and production has been recognized in winter, while during summer stratification the lateral advection of river run-off in surface layers and the presence of marked pycnoclines result in vertical heterogeneities and local variations in primary productivity (Franco and Michelato,1992). Primary productivity, representing the im-mediate result of interactions among physical, chemical and biological variables, gives
25
a dynamic overview of the environment, and is therefore a valuable tool for following the complex effects of freshwater inputs in the Northern Adriatic system (Socal et al.,
2002). Although there have been some previous large-scale spatial and temporal stud-ies that focused on the hydrological (e.g.,Artegiani et al.,1997a,b;Raicich,1996) and
BGD
4, 651–685, 2007 Chlorophyll-a variability in the NW Adriatic L. Tedesco et al. Title Page Abstract Introduction Conclusions References Tables Figures ◭ ◮ ◭ ◮ Back Close Full Screen / EscPrinter-friendly Version Interactive Discussion
EGU
biogeochemical (Zavatarelli et al.,1998) characteristics of the Adriatic Sea, research into the inter-annual variability of the Northern basin productivity related to its hydrology is still scarce.
Recent studies have reported a rise in water temperature (e.g.,Corti et al.,1999), in the Mediterranean Sea (Rixen et al.,2005) and in the Northern Adriatic basin (Russo
5
et al., 2002). Not much data analysis, apart from model experiments (Vichi et al.,
2003a), has been done, however, on the chlorophyll-a response to the changing
mete-orological conditions in the Northern Adriatic Sea.
We present here the analysis of 20 years (1986–2005) of physical, chemical and bio-logical data, both published and unpublished, collected at two stations, that have
oper-10
ated since the beginning of the twentieth century (Fig.1). Many authors (e.g.,Alberighi
et al., 1997; Pugnetti et al., 2003, 2004; Bernardi Aubry et al., 2006) have classified E06 as a station that is influenced by the Po river run-off and characterized by meso-eutrophic waters, while they have represented C10 as a meso-oligotrophic station that is only partially influenced by the Po river discharge; the latter occurs particularly
dur-15
ing intense stratification periods, when the Po plume eventually turns north-eastwards. In particular, whereasAlberighi et al.(1997) referred to the two stations as trophically different, Pugnetti et al. (2003) could not typify a significant difference in community composition, because a prevalence of tolerant species is observed in the whole area of the North Adriatic Sea.Bernardi Aubry et al.(2006) concluded that the hydrological
20
and trophic variability seemed mainly to affect phytoplankton abundance and biomass rather than species composition.
The main objectives of this work are:
(i) to analyse long-term variations in chlorophyll-a dynamics at the two stations, ei-ther highlighting or excluding possible trends related to climate change and/or to
25
anthropogenic pressures.
(ii) to compare C10 and E06 chlorophyll-a variability on a monthly scale in order to confirm or reject the hypothesis of two very different trophic areas.
BGD
4, 651–685, 2007 Chlorophyll-a variability in the NW Adriatic L. Tedesco et al. Title Page Abstract Introduction Conclusions References Tables Figures ◭ ◮ ◭ ◮ Back Close Full Screen / EscPrinter-friendly Version Interactive Discussion
EGU
(iii) to relate chlorophyll-a to other hydrological and biogeochemical variables so as to identify the principal factors influencing phytoplankton dynamics in both areas.
2 Sampling and methods
The sampling stations C10 (45◦15′00′′N, 12◦46′00′′E), and E06 (44◦57′50′′N, 12◦46′
20′′ E) are located about 20 and 10 nautical miles from the Italian coast and have a
5
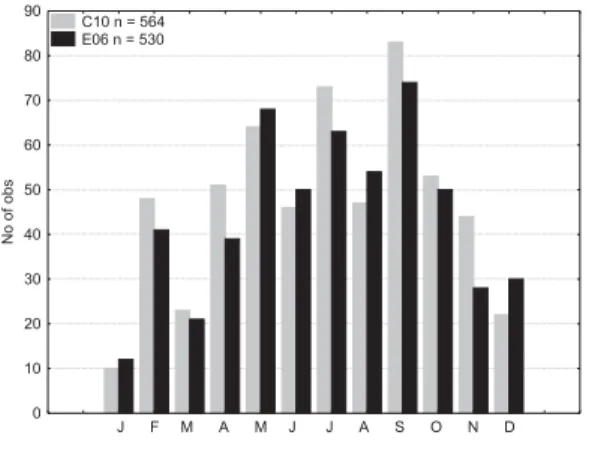
maximum depth of 29.5 and 32 m, respectively (Fig. 1). Chlorophyll-a, dissolved in-organic nutrients and oxygen samples were taken at fixed depths of 0, 5, 10, 15, 20, 25 m (standard levels, SL). Samples were collected monthly from April 1986 to August 2005, during different cruises and supported by different project funding. Because of the high short-term variability of the Adriatic environment, we decided to analyse the
10
data on a monthly scale, even if, in doing so, the winter months are less represented (Fig.3). The data frequency shows a different amount of samples for each month, while in the same month the number of samples from both C10 and E06 is comparable. For each station we analysed, at every SL: temperature, salinity and density, obtained using a CTD probe; samples of nutrients (N-NH3, N-NO2, N-NO3, Si-SiO4, P-PO4), dissolved
15
oxygen and chlorophyll-a using Niskin and Nansen bottles. Dissolved inorganic nutri-ents were analysed according to the methods described by Strickland and Parsons
(1972) andGrasshoff et al.(1999), dissolved oxygen by the Winkler method (Winkler,
1914), while chlorophyll-a was assessed according to Holm-Hansen et al. (1965). In the end, 564 samples from C10 and 530 from E06 were fluorometrically analysed.
20
Statistical analyses (descriptive, non-parametric, principal component analysis and partial regression) were performed using commercial software (Statistica by Statsoft). Test results were considered: significant at p–level <0.05, very significant at p–level
<0.01 and highly significant at p–level <0.001. The powerful non-parametric Wilcoxon Matched Pairs test was used to compare the biogeochemical features between the
25
two sampled sites. Both the Cox-Stuart test and the τ-Kendall test were performed to highlight possible trends in time. We only show the Cox-Stuart test results, since it
BGD
4, 651–685, 2007 Chlorophyll-a variability in the NW Adriatic L. Tedesco et al. Title Page Abstract Introduction Conclusions References Tables Figures ◭ ◮ ◭ ◮ Back Close Full Screen / EscPrinter-friendly Version Interactive Discussion
EGU
better suits our kind of data, which are non contiguous, generic and presenting several anomalous values. A comparison between the vertical distribution of chlorophyll-a in the water column at the C10 and E06 stations was carried out by Whisker plots and the significance of the results was tested by the non-parametric Sign test and the Wilcoxon Matched Pairs test. The results of both tests are pretty similar; we present only the
re-5
sults of the Wilcoxon test, since it is considered more powerful (Conover,1999;Sprent
and Smeeton, 2001). The correlation between chlorophyll-a and other physical and hydrochemical variables was studied using parametric tests, after the normalization of some of the non-normal distributions. A principal component analysis (PCA) was then applied to identify the weight of each variable, presenting the results of the first
10
two components. To avoid auto-correlation phenomena between the environmental variables considered independent, we finally applied a Ridge Regression analysis to the normalized data for clarifying the statistically-significant, linear correlation between chlorophyll-a and the other variables. Ridge regression is used when the indepen-dent variables are highly intercorrelated: a constant bias (λ) is added to the diagonal
15
of the correlation matrix, which is then re-standardized so that all diagonal elements are equal to 1 and the off-diagonal elements are divided by the constant. In this way Ridge regression artificially lowers the correlation coefficients so that more stable esti-mates (β coefficients) can be computed. Graphic linear interpolations were carried out using commercial software (Surfer 8.0 by Golden Software): the median values of all
20
the variables at every SL have been plotted on a monthly scale by the linear Kriging method.
3 Results
3.1 Temperature, salinity and chlorophyll-a inter-annual trends
The Cox-Stuart test, which analyses the central trends in the surface water
temper-25
BGD
4, 651–685, 2007 Chlorophyll-a variability in the NW Adriatic L. Tedesco et al. Title Page Abstract Introduction Conclusions References Tables Figures ◭ ◮ ◭ ◮ Back Close Full Screen / EscPrinter-friendly Version Interactive Discussion
EGU
one in July at both sites, in agreement with the rise in air temperature and annual heat fluxes observed in the Northern Adriatic Sea (Russo et al.,2002). Another significant increase is found in December at both sites, indicating a tendency towards milder win-ters. However, C10 is the only station showing a significant trend in the whole years median values. In fact, between August and November E06 is characterized by a
neg-5
ative temperature trend which, without being a significant value, still agrees with the registered increasing flow of the Po river that causes floods during autumn (Raicich,
2003). The same feature is not found at C10, probably because the freshwater effect is confined to the Northern Adriatic Current region (Artegiani et al.,1997a).
This is further confirmed by the Cox-Stuart test results for surface salinity (Table1).
10
No significant trend is found at C10, either in spring, or in summertime, when the area is eventually reached by the Po river plume. Significant trends are instead seen at E06: a very significant decrease in February, a significant decrease in October and a very significant increase in November.
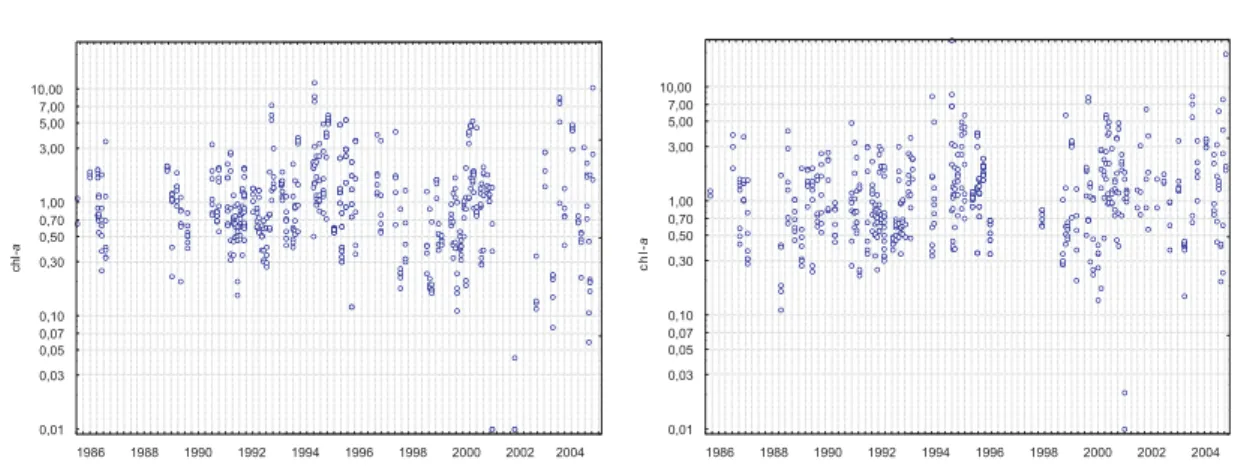
Chlorophyll-a data for both stations, are plotted in Fig. 4for the whole period. The
15
Cox-Stuart Sign test (Table2) reveals no significant long-term trend in either the central (median) value of chlorophyll-a concentration, or in its dispersion of data: the slight negative trend in the C10 annual value is considered random, as is the slight increase at E06. On the other hand, C10 shows a significant increase in the central value in April, although this is not really relevant considering the entire annual cycle. The
20
variability is fairly constant, with a small indication of increase for both stations. Any missing result is due to an insufficient number of available comparisons.
3.2 Hydrological and biogeochemical features
In Table3 we list the number of valid observations, the medians, the ranges and the Wilcoxon Matched Pairs test results of comparison between the two stations for all the
25
available hydrological and biogeochemical variables over the 20-year period. Descrip-tive statistics reveals that the main differences between the two sites are due to the large dispersion in the E06 variable values, rather than to any differences in the trends
BGD
4, 651–685, 2007 Chlorophyll-a variability in the NW Adriatic L. Tedesco et al. Title Page Abstract Introduction Conclusions References Tables Figures ◭ ◮ ◭ ◮ Back Close Full Screen / EscPrinter-friendly Version Interactive Discussion
EGU
of the central (median) values. Statistically high significant differences are observed for all the nutrients’ concentrations, except N-NO2and also, to a less extent (p<0.05), for
the chlorophyll-a values between the two areas.
The high spatial and temporal variability of the hydrological and biogeochemical fea-tures directly and indirectly influencing the chlorophyll-a dynamics in the area needs
5
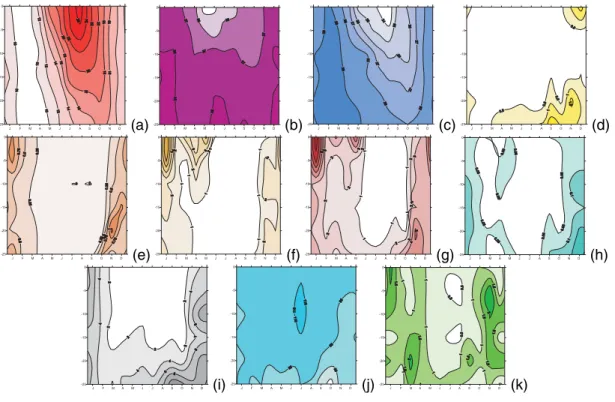
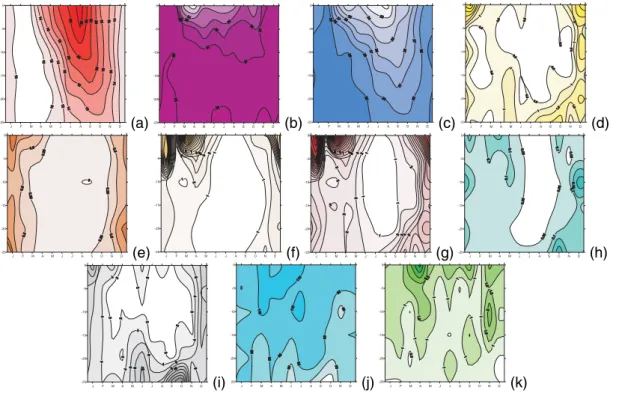
to be analysed on the proper scale, in order to be able to capture the variability. All monthly median values, at every SL, are shown in H ¨ovm ¨oller time-depth plots in Fig.5
(C10) and in Fig.6(E06).
Both sites show similar features in the hydrological variables. The density isolines (panel c) reveal that the water column is mixed between November and March and
10
stratified for the rest of the year. The rise in temperature (panel a) starts to stratify the water in April, with a maximum surface temperature in August (C10 T=27.2◦C, E06
T=27.1◦
C). Freshwater inputs, limited to the first 10 m of the water column, affect the salinity fields in different ways from site to site. The salinity (panel b) at C10 begins to decrease in March, so that the minimum of surface salinity (S=34.6) is found in May–
15
June, reflecting the first annual peak of the Po river discharge (Fig. 2). The salinity starts to increase in July, and in autumn the C10 area is less affected by the second peak of the Po river (S=36.3). The salinity at E06 has a much lower value in March, so it reaches a surface minimum earlier, in April (S=31.3), remaining at constant values around 33–34 until August. In October it detects again the effect of the Po river peak
20
with a second minimum surface value of 34.1.
The nutrients’ concentrations show similar distributions at both sites, with lower centrations at C10. Nutrient profiles are generally characterized by higher surface con-centrations down to a depth of 5–10 m. In the last 15 m of the water column, nutrient concentrations are either uniform or increasing with depth, depending on the variable.
25
The water column is almost completely depleted in ammonia (panel d) throughout the year at C10, and between March and October at E06. Surface peaks are present at C10 in December ([N-NH3]=1.7 µmol dm−3), while they are seen at E06 in
Decem-ber ([N-NH3]=3.1 µmol dm−3) and January ([N-NH
deep-BGD
4, 651–685, 2007 Chlorophyll-a variability in the NW Adriatic L. Tedesco et al. Title Page Abstract Introduction Conclusions References Tables Figures ◭ ◮ ◭ ◮ Back Close Full Screen / EscPrinter-friendly Version Interactive Discussion
EGU
est measured 5 m of the water column, values increase from April onwards, reach-ing a maximum in September ([N-NH3]=1.2 µmol dm−3) at C10 and in October
([N-NH3]=1.8 µmol dm−3) at E06. Values decrease again to a minimum ([N-NH3]=0.3
µmol dm−3) in January–February at C10 and in March at E06.
Nitrite (panel e) remains at low concentrations at both sites: close to zero between
5
April and October and slightly higher for the rest of the year, reaching a maximum in January ([N-NO2]=1.0 µmol dm−3: C10 at 5 m, E06 at the surface).
The nitrate time evolution (panel f) indicates that very low concentrations are found between May and October at C10 and between June and September at E06. Higher nitrate values are found at the surface in December, March, April and May at both
sta-10
tions, coinciding with high chlorophyll-a concentrations, marking an excess of nitrate. The E06 values are the highest, reaching a maximum of 21.0 µmol dm−3 in March in
correspondence with the Po outflow, while C10 reaches a maximum of 7.0 µmol dm−3
in January. Because of the second Po river peak and the increase in the vertical mix-ing processes, which diffuse the bottom-regenerated nutrients, the entire water column
15
shows high values during winter at both sites.
Dissolved inorganic nitrogen ([DIN]=[N-NO2]+[N-NO3]+[N-NH3], panel g) reflects
mainly the nitrate trend at the surface and the ammonia trend at the bottom.
Phosphate concentrations (panel h) are close to zero at both sites, at all depths, during most of the year. Slightly higher concentrations are present in December and
20
January ([P-PO4]=0.2 µmol dm−3), although E06 values are generally higher.
Silicate concentrations (panel i) are only high at the surface at E06 (max [Si-SiO4]=13.4 µmol dm−3in January), reflecting low salinity concentrations and therefore
the Po river’s influence, while they are high throughout the water column at both sites in December and January, because of mixing processes. Silicate concentrations,
in-25
creasing with depth at both stations, highlight the importance of benthic regeneration processes to this variable (Giordani et al.,1992).
Dissolved oxygen (panel j) shows comparable concentrations at both sites, as well as a good general oxygenation of the waters and a progressive decrease of
concentra-BGD
4, 651–685, 2007 Chlorophyll-a variability in the NW Adriatic L. Tedesco et al. Title Page Abstract Introduction Conclusions References Tables Figures ◭ ◮ ◭ ◮ Back Close Full Screen / EscPrinter-friendly Version Interactive Discussion
EGU
tions with depth, well revealing an opposite annual pattern compared to the ammonia, phosphate and silicate concentrations. Minimum values, close to hypoxic phenom-ena, are found in the deeper SL in September–October (C10: [O2]sat=56.8%, E06:
[O2]sat=59%) at the end of the stratification period. Successively, stratification is
bro-ken by surface cooling and wind stirring action, redistributing oxygen concentrations
5
throughout the whole water column during the following months (November, Decem-ber).
Chlorophyll-a (panel k) shows a complex annual cycle at both stations. C10 surface waters are characterized by a January peak and low values for the rest of the year. The lowest concentrations are found between May and October, corresponding to the
10
stratified period (panel k) with low DIN and DIP (dissolved inorganic phosphate) con-centrations. Subsurface maxima, below a depth of 15 m in March and in the whole water column in November, coincide with the river nutrient inputs. E06 presents the highest chlorophyll-a concentrations at the surface throughout the year, a pattern that is exactly opposite to that of salinity. In fact the highest values are registered in March–
15
April, September and November, months that are characterized by very different hy-drological and biogeochemical conditions.
3.3 The vertical variability of chlorophyll-a
The H ¨ovm ¨oller plots of Fig. 5 and Fig. 6 give an immediate overview of the median situation characterizing both sites’ environment. In this section we focus on an analysis
20
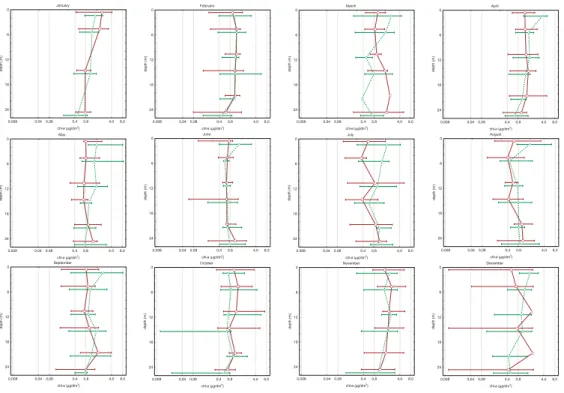
of the variability. Monthly vertical profiles of chlorophyll-a concentrations for both sites are shown in Fig. 7, where the Whisker plots represent the median values and the non-outliers ranges (Whisker, coeff.=1) at every SL. Table4presents the valid number of observations, the medians, the ranges and the Wilcoxon Matched Pairs test for chlorophyll-a on a monthly scale at both stations.
25
Excluding exceptional values, classified as outliers, median concentrations do not exceed 4 µg dm−3, and the scale is limited to 8 µg dm−3. Similar vertical profiles are
BGD
4, 651–685, 2007 Chlorophyll-a variability in the NW Adriatic L. Tedesco et al. Title Page Abstract Introduction Conclusions References Tables Figures ◭ ◮ ◭ ◮ Back Close Full Screen / EscPrinter-friendly Version Interactive Discussion
EGU
of the year, which is mainly characterized by strong temperature and salinity stratifi-cation, E06 maintains higher concentrations in the surface layer, while C10 does the same mostly at intermediate depths.
The annual cycle at C10 is characterized by minimum concentrations between May and October, but maximum ones in November, followed by April, March and May, while
5
the other months have intermediate values. Apart from November, E06 is generally characterized by high concentrations limited to the first 5–10 m layer.
Statistically significant differences (Table 4) are found in July, August, September and October. The significant differences detected in July and August and the very significant ones in September are due to sensibly lower concentrations in the first 20 m
10
at C10. October is the only month during which concentrations in the entire water column are very significantly higher at C10 than at E06. For the rest of the year, the chlorophyll-a profiles at C10 and E06 have opposite trends and cross each other at different depths between 10 and 20 m.
3.4 Relationships among variables
15
With the aid of principal component analysis (PCA) we intended to investigate which factors drive the variability of and the interconnections between the physical and bio-geochemical variables, particularly in relation to the seasonal cycle and the loads of nutrients.
In order to carry out the PCA and the Ridge Regression tests, it was necessary to
20
test the normality of the data distribution using the Shapiro-Wilk test. Table5 reports the Shapiro-Wilk test results and the transformation that better suited the normal distri-bution. A normal distribution was significantly obtained at both sites for all the variables, except for phosphate.
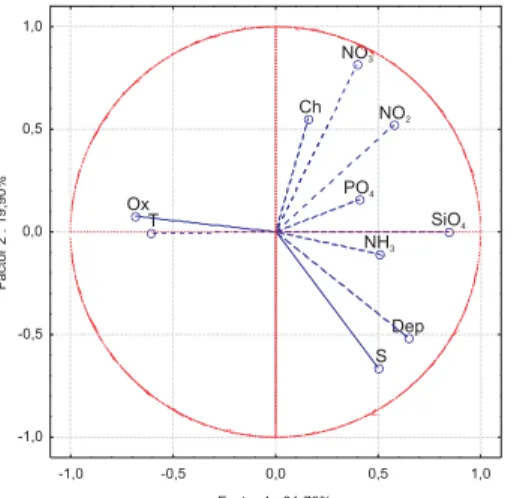
The variables’ PCA projection on the factor plane is represented in Fig.8. Among the
25
variables, we also considered depth as an indicator that explains surface/bottom pro-cesses. From the correlation matrix, the two components extracted explained 51.61% of the total variance for C10 and 58.68% for E06. Both stations present all the
consid-BGD
4, 651–685, 2007 Chlorophyll-a variability in the NW Adriatic L. Tedesco et al. Title Page Abstract Introduction Conclusions References Tables Figures ◭ ◮ ◭ ◮ Back Close Full Screen / EscPrinter-friendly Version Interactive Discussion
EGU
ered variables grouped in three quadrants: the first quadrant is for salinity-depth co-variance, the second one is for oxygen-temperature and the third one is for nutrients. At C10 ammonia is situated in the salinity-depth quadrant, opposite to the oxygen con-centration. In this graphical representation chlorophyll-a is found in different quadrants: in the case of C10 it is located in the nutrients quadrant, while in the case of E06 it has
5
an intermediate position between nutrients and oxygen-temperature.
The Ridge regression results (Table 6) are listed according to the order in which the variable was introduced in the model equation, together with the consequent p– level of significance. At C10, the first highly significant positively-related variable is nitrate, followed by the highly significant negatively-related salinity, the very significant
10
positive relation with depth and the significant negative relation with temperature. The negative relation with ammonia and the positive one with nitrite are also introduced in the regression equation, although their relation is not significant. At E06, all the variables introduced in the model are at least significant. The first highly significant negative relation is with salinity, followed by the significant positively-related nitrate, the
15
very significant negative relation with ammonia, the significant negative relation with phosphate, the very significant positive relation with silicate and the significant positive relation with oxygen. The nutrient relations were positive or negative depending on consumption or excess. The strongest chlorophyll-a dependence is then positive with nitrate at C10, followed by the hydrological variables, while at E06 it is negative with
20
salinity, followed by the nutrients’ concentrations.
4 Discussion
The analysis of relationships among the different physical and biogeochemical vari-ables is hampered by the imposed choice of the sampling frequency with respect to the temporal scale that would better characterize the processes that affected those
vari-25
ables. A monthly frequency analysis is probably sufficient to capture the seasonal cycle in the physical parameters, but not the local, directly-affected biological response. The
BGD
4, 651–685, 2007 Chlorophyll-a variability in the NW Adriatic L. Tedesco et al. Title Page Abstract Introduction Conclusions References Tables Figures ◭ ◮ ◭ ◮ Back Close Full Screen / EscPrinter-friendly Version Interactive Discussion
EGU
chlorophyll-a signature is less constrained by seasonal processes and more affected by short-term disturbances and small-scale spatial distribution.
Indeed, the Cox-Stuart test for temperature (Sect.3.1) is highly significant, especially in summer, at both stations, although an overall significant trend is detected only at C10. A possible explanation for this behaviour lies in the different relationship that
5
both stations have with the river run-off. This is further confirmed by the test for the salinity trend (Sect.3.1). The way we explain these results is that both areas detect the effect of the increasing warming (Corti et al., 1999;Rixen et al., 2005), but only E06 is likely to show the effects of the increasing precipitation. In fact, both stations are affected by the rise in summer temperature, due to higher heat fluxes. But, while
10
at E06 the rise in temperature is balanced by an autumn reduction, due to the large quantity of freshwater inflow, at C10 this does not happen, since no effect is detected of the Po water spreading there during autumn. Therefore at C10 the water generally becomes warmer. The analysis of a possible temporal trend for chlorophyll-a does not show any significant change in concentrations, either in the central value or in the data
15
dispersion, which is in contrast with the overall positive trend for temperature at C10 and the negative one for salinity at E06 during November. The trends in temperature and salinity are thus not associated with a trend in chlorophyll-a, which we may assume to be an indicator of standing biomass (Vichi et al.,2003a).
Despite some indications of altered concentrations in other hydrochemical
vari-20
ables, such as the phosphorous decrease reported by Degobbis et al. (2000) and later byBernardi Aubry et al. (2004), we are not able to define a possible associated chlorophyll-a change on this temporal scale and with this high natural variability. We can then hypothesize that: i) a real change did not happen; ii) the temporal scale of the chlorophyll-a processes might have not fitted with the other variable trends; iii) the
25
ecosystem evolution might have favoured new species in the composition of the phyto-plankton population without changing the total stock; iv) a possible trend might exist at the extreme concentrations, which are not sufficiently represented in the sample.
BGD
4, 651–685, 2007 Chlorophyll-a variability in the NW Adriatic L. Tedesco et al. Title Page Abstract Introduction Conclusions References Tables Figures ◭ ◮ ◭ ◮ Back Close Full Screen / EscPrinter-friendly Version Interactive Discussion
EGU
both sites, the physical variables are not significantly different, while the major nutri-ents’ concentrations are highly different. This indicates that the C10 and E06 areas have significantly comparable hydrological characteristics, while they are differently af-fected by the river’s discharge. However, chlorophyll-a only shows a weakly significant difference, indicating that the nutrient standing stocks are not a sufficient criterion to
5
characterize trophic conditions, in contrast with previous analyses of the trophic vari-ability of the area (e.g.,Alberighi et al.,1997). High-frequency interconnected physical and biological processes are thus likely to modulate chlorophyll-a dynamics, also when the nutrients’ availability is dominant.
The hydrological and biogeochemical evolution presented in Sect. 3.2 shows that
10
the C10 station is directly influenced by very high river outflows, which are stronger in May–June when the general circulation and stratification can favour the NE spreading of the Po plume, and weaker in October–November. Conversely, E06 is largely affected by the Po river run-off, irrespective of their magnitude, and also by other smaller rivers, as confirmed by much lower salinity values for all of the non-mixed periods. Finally, at
15
both stations the minimum surface density value is in August, revealing the fact that temperature has a major role in determining the density fields. Another minimum is present in April at E06 when the temperature is still low, indicating that salinity is the major factor responsible for the density value during this phase of the annual cycle.
Generally, the nutrient profiles have higher surface concentrations, reflecting the
op-20
posite trend of the vertical distribution of salinity and the direct influence of the river inputs.
The surface peaks of winter ammonia are most likely due to its release by phyto-plankton after the November blooming. The lowest 5 m of the water columns show concentrations that well reflect a trend opposite to that of the dissolved oxygen in the
25
same period, indicating benthic recycling of ammonia. The role of benthic nutrient rem-ineralization is then an important factor that can be inferred from the monthly analysis. Low salinity values during periods of low nitrate concentrations suggest that most of the land-derived nitrate is taken up by phytoplankton. However, while C10 is
char-BGD
4, 651–685, 2007 Chlorophyll-a variability in the NW Adriatic L. Tedesco et al. Title Page Abstract Introduction Conclusions References Tables Figures ◭ ◮ ◭ ◮ Back Close Full Screen / EscPrinter-friendly Version Interactive Discussion
EGU
acterized by low concentrations of chlorophyll-a, E06 maintains higher values. This means that N-NO3values are not the only explanation for high surface concentrations of chlorophyll-a at E06, but that some other controlling factors may affect phytoplankton growth there. Consequently, either the organisms developed a good adaptation at low nutrient concentrations at E06, or there was zooplankton consumption at C10; it may
5
also have been due to the higher surface concentrations of silicate that characterized only E06 (but not C10) over the year.
High concentrations of chlorophyll-a, during those months and at those depths at which the phosphate concentrations are close to zero, suggest that phosphorus is consumed and rapidly remineralized to sustain abundant biomass production.
10
Despite a good understanding of the behaviour of the hydrological and biogeochemi-cal features, one is faced with a chlorophyll-a time evolution that shows a very complex annual cycle in both areas. C10 blooms at different depths during the year, while E06 has mainly surface blooms. The chlorophyll-a vertical profiles are similar when mixing processes prevail. For the rest of the year, which is characterized by a strong
stratifi-15
cation of temperature and salinity, E06 maintains higher concentrations in the surface layer, where it is mostly affected by riverine loads, while C10 does so mostly at inter-mediate depths, because a smaller presence of photo-attenuating materials may allow photosynthesis in the entire water column (Vichi et al.,2003b).
At C10, chlorophyll-a concentrations seem to pretty well follow the annual cycle of
nu-20
trients. At E06, the annual cycle is much more complex, and does not seem to closely follow the temporal succession of nutrients. Except for November, high concentrations are limited to the first 5–10 m layer. However, every period of high concentration is followed by a period of low concentration, indicating that some factor acts successively and regulates phytoplankton abundance. We suppose that, the nutrients being
suffi-25
cient and sometimes in excess at this site, zooplankton grazing, whose annual cycle is usually out of phase with that of phytoplankton, can be one of the main regulating factors of the chlorophyll-a pattern.
BGD
4, 651–685, 2007 Chlorophyll-a variability in the NW Adriatic L. Tedesco et al. Title Page Abstract Introduction Conclusions References Tables Figures ◭ ◮ ◭ ◮ Back Close Full Screen / EscPrinter-friendly Version Interactive Discussion
EGU
first principal component of the PCA (Fig.8) captures the effect of periodical stratifica-tion, showing negative correlation between the groups of nutrients, salinity-depth and oxygen-temperature. The second component highlights the effect of river inputs, show-ing an opposition between nutrients and salinity, with little explanation of temperature-oxygen variability. The chlorophyll-a position confirms our previous hypothesis: at C10,
5
chlorophyll-a concentrations are mainly correlated to riverine run-off, while at E06, the nutrients being at least sufficient, the correlation is strongly positive with the seasonal cycle and opposite to depth-salinity, because the highest concentrations are found at the surface.
A further confirmation comes from the Ridge Regression test results (Sect.3.4). At
10
C10, the only nutrient in the equation is nitrate, which is also the closest variable to chlorophyll-a in the PCA projection. The following correlations with the physical vari-ables are significant: negative with salinity and temperature, as expected for areas located offshore but affected by land-derived nutrients, and positive with depth be-cause of the mostly intermediate blooms. At E06, the Ridge Regression highlights a
15
strongly opposite trend with salinity, which is responsible for the surface blooms and is well-shown in the PCA diagram (Fig. 8). Finally, the equation includes a positive correlation with nitrate and silicate, indicating an excess of these nutrients for phyto-plankton requirements, and a negative correlation with ammonia and phosphate, that are therefore consumed at the site.
20
5 Conclusions
The long-term set of hydrological and biogeochemical data coming from the C10 and E06 stations, located in the NW Adriatic Sea, allowed us to formulate a reasonable picture of: the a temporal trend, the vertical distributions of
chlorophyll-a chlorophyll-and other biogeochemicchlorophyll-al properties, their vchlorophyll-arichlorophyll-ability on chlorophyll-a monthly time scchlorophyll-ale chlorophyll-and
25
the links between them, as well as the trophic differences between the two areas. We recognize that lateral advection might have affected this scenario to some extent:
BGD
4, 651–685, 2007 Chlorophyll-a variability in the NW Adriatic L. Tedesco et al. Title Page Abstract Introduction Conclusions References Tables Figures ◭ ◮ ◭ ◮ Back Close Full Screen / EscPrinter-friendly Version Interactive Discussion
EGU
at C10, the biomass can indeed be mostly driven by remote production or extended sources (Carniel et al.,2007).
The main difference between the biogeochemical variables was not due to the cen-tral (median) values, but to a wider range of data distribution at E06, which showed a generally higher dispersion. Both sites showed similar hydrological features despite
5
their different location, both being clearly influenced by riverine inputs. C10 was mainly affected by river discharge maxima, while E06 was almost permanently stratified be-cause of freshwater inputs. Between June and October both areas have low nutrients and chlorophyll-a concentrations, and they have to be considered oligotrophic. For the rest of the year, they display meso-oligotrophic characteristics with temporary eutrophic
10
conditions only at the surface. This leads us to classify the area differently from the pre-vious literature (e.g.,Alberighi et al.,1997;Pugnetti et al.,2003,2004;Bernardi Aubry
et al.,2006).
The vertical distribution of properties also showed similar patterns: the hydro-logical variables, oxygen distribution and phosphate concentrations are comparable
15
in the water column, nitrogen is higher at the surface and silicate is higher at the bottom. Nonetheless, the vertical distribution of chlorophyll-a was rather different: E06 had mainly surface blooms in April, September and November, while C10 had blooms in January, March, September and November at different SL depending on the month. The analysis of the relationships among the variables suggested that at C10
20
chlorophyll-a was mainly controlled by river inputs, even though we expected this to be the main regulating factor at E06, which instead was positively correlated with the seasonal cycle and negatively correlated with depth and salinity, because of the mostly surface blooms. We suppose that a high presence of photo-attenuating material limits the photosynthesis at a deeper E06 SL, while nutrient availability is the main regulating
25
factor for phytoplankton growth at C10.
Finally, very low concentrations of phosphate, coupled with exceptional
chlorophyll-a vchlorophyll-alues, suggest thchlorophyll-at we should review the thesis of phosphorous being chlorophyll-a clchlorophyll-assi-
BGD
4, 651–685, 2007 Chlorophyll-a variability in the NW Adriatic L. Tedesco et al. Title Page Abstract Introduction Conclusions References Tables Figures ◭ ◮ ◭ ◮ Back Close Full Screen / EscPrinter-friendly Version Interactive Discussion
EGU
Sea. We suggest that other phosphorous sources besides orthophosphate, such as organic phosphorous and fast regeneration processes, can contribute to maintaining phytoplankton growth. It is therefore necessary to resolve the fast remineralization pro-cesses in the pelagic domain on a higher frequency scale in order to clarify the effective co-limiting factors.
5
A long-term monthly scale analysis was essential to understand typical time scales of the processes that control the concentration and distribution of the properties and the variability of the area. Even if we are not able to assess the climatological change, the Cox-Stuart test for temperature and salinity in the first 5 m of the water column, where the annual variability is higher, agrees pretty well with the Eastern Mediterranean
10
Climatic Transient (EMCT). The EMCT is a global change in the meteo-oceanographic conditions happening over the Mediterranean Sea during recent decades (Rixen et al.,
2005), and is defined as a collection of events, such as rising temperature and fewer rainy days with heavier precipitation. However, the absence of a significant
chlorophyll-a trend in time chlorophyll-at either site, in chlorophyll-agreement with model results of scenchlorophyll-ario simulchlorophyll-ations
15
(Vichi et al.,2003a), is not sufficient to allow us to assume that the communities did
not change. Previous studies, based on a shorter time scale (Pugnetti et al.,2003;
Bernardi Aubry et al., 2006), could not typify any significant difference in community
composition. Our next step will therefore be to couple this study with an analysis of the abundance, biodiversity and distribution of the different species of phytoplankton
20
during the same study period in order to find if an intra- and inter-annual variability is present in the long term instead.
Low salinity values together with low concentrations of nitrate and other nutrients, that result in high chlorophyll-a concentrations at E06, but low ones at C10, can prob-ably be explained by zooplankton uptakes at C10 and lower consumptions at E06. We
25
therefore suggest the importance of studying the coupling between the phytoplankton cycle and zooplankton abundance and distribution, since zooplankton is an essential controlling factor in the phytoplankton trend and evolution throughout the trophic chain characterizing an area.
BGD
4, 651–685, 2007 Chlorophyll-a variability in the NW Adriatic L. Tedesco et al. Title Page Abstract Introduction Conclusions References Tables Figures ◭ ◮ ◭ ◮ Back Close Full Screen / EscPrinter-friendly Version Interactive Discussion
EGU
Acknowledgements. Data from 1999 to date have been collected in the framework of the EU
programs INTERREG II and INTERREG III Italia-Slovenia. The authors thank their ISMAR col-leagues for having taken part in most of the data collection and also for critical contributions to the manuscript. L. Tedesco and M. Vichi acknowledge support from the Italian project VEC-TOR. R. King is acknowledged for the language review of this paper and the Editor (E. Boss)
5
for his continued support during the editorial process.
References
Alberighi, L., Franco, P., Bastianini, M., and Socal, G.: Produttivit ´a primaria, abbondanza fi-toplanctonica e campo di irradianza, in due stazioni dell’Adriatico settentrionale. Crociere marzo e giugno 1994, Biologia Marina Meditterranea, 4, 17–23, 1997. 654,664,667
10
Artegiani, A., Bregant, D., Paschini, E., Pinardi, N., Raicich, F., and Russo, A.: The Adri-atic Sea General Circulation. Part I: Air-sea interactions and water mass structure, J. Phys. Oceanogr., 27, 1492–1514, 1997a. 652,653,657
Artegiani, A., Bregant, D., Paschini, E., Pinardi, N., Raicich, F., and Russo, A.: The Adriatic Sea General Circulation. Part II: Baroclinic Circulation Structure, J. Phys. Oceanogr., 27,
15
1515–1532, 1997b.653
Bernardi Aubry, F., Berton, A., Bastianini, M., Socal, G., and Acri, F.: Phytoplankton succession in a coastal area of the NW Adriatic, over a 10-year sampling period (1990–1999), Cont. Shelf Res., 24(1), 97–115, 2004.663
Bernardi Aubry, F., Acri, F., Bastianini, M., Bianchi, F., Cassin, D., Pugnetti, A., and Socal, G.:
20
Seasonal and interannual variations of phytoplankton in the Gulf of Venice (Northern Adriatic Sea), Chemistry and Ecology, 22, 1, 71–91, 2006.654,667,668
Carniel, S., Vichi, M., and Sclavo, M.: Sensitivity of a coupled physical-biological model to turbulence: high frequency simulations in a northern Adriatic station, Chemistry and Ecology, 23(2), in press, 2007. 667
25
Conover, W. J.: Practical nonparametric statistics, John Wiley & Sons, New York, 1999.656
Corti, S., Molteni, F., and Palmer, T. N.: Signature of recent climate change in frequencies of natural atmospheric circulation regimes, Nature, 398, 799–802, 1999. 654,663
BGD
4, 651–685, 2007 Chlorophyll-a variability in the NW Adriatic L. Tedesco et al. Title Page Abstract Introduction Conclusions References Tables Figures ◭ ◮ ◭ ◮ Back Close Full Screen / EscPrinter-friendly Version Interactive Discussion
EGU
changes in the northern Adriatic ecosystem related to anthropogenic eutrophication, Int. J. Environ. Pollut., 13(1–6), 495–533, 2000.663
Fonda Umani, S.: Pelagic biomass and production in the Adriatic Sea, Sci. Mar., 60(2), 65–77, 1996. 653
Franco, P. and Michelato, A.: Northern Adriatic Sea: oceanography of the basin proper and of
5
the western coastal zone, Marine Coastal Eutrophication, The Science of the Total Environ-ment, pp. 35–62, 1992. 653
Giordani, P., Hammond, D., Berelson, W., Montanari, G., Poletti, R., Milandri, A., Frignani, M., Langone, L., Ravaioli, M., Rovatti, G., and Rabbi, E.: Benthic fluxes and nutrient budgets for sediments in the northern Adriatic Sea: burial and recycling efficiencies, Marine coastal
10
eutrophication, The Science of the Total Environment Supplement, pp. 251–276, 1992.659
Grasshoff, K., Erhardt, M., and Kremling, K.: Methods of Seawater Analysis, Wiley-VCH, Wein-heim, 1999. 655
Holm-Hansen, O., Lorenzen, C. J., Holmes, R. W., and Strickland, J. D. H.: Fluorometric deter-mination of chlorophyll, J. Cons. perm. int. Explor. Mer., 30, 3–15, 1965. 655
15
Pugnetti, A., Acri, F., Bastianini, M., Bernardi Aubry, F., Berton, A., Bianchi, F., Noak, P., and Socal, G.: Primary production processes in the North-Western Adriatic Sea, Atti Assoc. Ital. Oceanol. Limnol., 16, 15–28, 2003.654,667,668
Pugnetti, A., Acri, F., Alberighi, L., Barletta, D., Bastianini, M., Bernardi Aubry, F., Berton, A., Bianchi, F., Socal, G., and Totti, C.: Phytoplankton photosynthetic activity and growth rates
20
observations in the NW Adriatic Sea, Chemistry and Ecology, 20, 6, 399–409, 2004. 654,
667
Raicich, F.: On the fresh water balance of the Adriatic Sea, J. Mar. Syst., 9, 305–319, 1996.
653
Raicich, F.: Recent evolution of sea-level extremes in the North Adriatic, Cont. Shelf Res., 23,
25
225–235, 2003. 657
Rixen, M., Bekers, J. M., Levitus, S., Antonov, J., Boyer, T., Maillard, C., Fichaut, M., Balopoulus, E., Iona, S., Dooley, H., Garcia, M. J., Manca, B., Giorgetti, A., Manzella, G., Mikhailov, N., Pinardi, N., and Zavatarelli, M.: The Western Mediterranean Deep Water: A proxy for climate change, Geophys. Res. Lett., 32, L12 608, doi:10.1029/2005GL022702, 2005.654,663,668
30
Russo, A., Rabitti, S., and Bastianini, M.: Decadal Climatic Anomalies in the Northern Adriatic Sea Inferred from a New Oceanographic Data Set, Marine Ecology, 23(1), 340–351, 2002.
BGD
4, 651–685, 2007 Chlorophyll-a variability in the NW Adriatic L. Tedesco et al. Title Page Abstract Introduction Conclusions References Tables Figures ◭ ◮ ◭ ◮ Back Close Full Screen / EscPrinter-friendly Version Interactive Discussion
EGU
Socal, G., Pugnetti, A., Alberighi, A., and Acri, F.: Observations on phytoplankton productivity in relation to hydrography in the Northern Adriatic, Chemistry and Ecology, 18(1–2), 61–73, 2002. 653
Sprent, P. and Smeeton, N. C.: Applied nonparametric statistical methods, Chapman & Hall/CRC Press, Boca Raton, Florida, 2001.656
5
Strickland, J. D. H. and Parsons, T. R.: A manual for sea water analysis, Bulletin of the Fisheries Research Board of Canada, Ottawa, Canada, 1972.655
Vichi, M., May, W., and Navarra, A.: Response of a complex ecosystem model of the northern Adriatic Sea to a regional climate change scenario, Climate Res., 24, 141–159, 2003a.654,
663,668
10
Vichi, M., Oddo, P., Zavatarelli, M., Coluccelli, A., Coppini, G., Celio, M., Umani, S. F., and Pinardi, N.: Calibration and validation of a one-dimensional complex marine biogeochemical fluxes model in different areas of the northern Adriatic shelf, Ann. Geophys., 21, 413–436, 2003b. 665
Winkler, L. W.: ¨Uber die Bestimmung des im Wasser gel ¨osten Sauerstoffs, Fresenius’ Journal
15
of Analytical Chemistry, 53(11), 665–672, 1914.655
Zavatarelli, M., Raicich, F., Bregant, D., Russo, A., and Artegiani, A.: Climatological biogeo-chemical characteristics of the Adriatic Sea, J. Mar. Syst., 18, 1, 227–263, 1998. 654
BGD
4, 651–685, 2007 Chlorophyll-a variability in the NW Adriatic L. Tedesco et al. Title Page Abstract Introduction Conclusions References Tables Figures ◭ ◮ ◭ ◮ Back Close Full Screen / EscPrinter-friendly Version Interactive Discussion
EGU
Table 1. Cox-Stuart test results for surface temperature (left) and salinity (right) at C10 and
E06a.
Temp Sal
C10 E06 C10 E06
Month N + − p sig. N + − p sig. N + − p sig. N + − p sig.
Jan 6 2 0 – – 6 3 0 – – 6 0 3 – – 6 1 2 – – Feb 19 5 4 0.500 ns 16 3 5 0.344 ns 19 2 7 0.090 ns 16 0 8 0.004 ** March 12 3 3 0.656 ns 10 2 3 – – 12 4 2 0.344 ns 10 5 0 – – April 18 5 4 0.500 ns 13 4 2 0.344 ns 18 6 3 0.254 ns 14 4 3 0.500 ns May 26 11 2 0.033 * 27 11 2 0.011 * 26 4 9 0.133 ns 27 10 2 0.055 ns June 18 8 1 0.020 * 17 7 1 0.035 * 18 4 5 0.500 ns 17 4 4 0.637 ns July 32 14 2 0.002 ** 27 12 1 0.002 ** 18 4 5 0.500 ns 17 4 4 0.637 ns Aug 20 2 6 0.055 ns 21 3 7 0.172 ns 21 5 5 0.623 ns 21 4 5 0.500 ns Sep 32 9 6 0.227 ns 25 3 9 0.073 ns 32 11 5 0.105 ns 25 6 6 0.613 ns Oct 22 5 6 0.500 ns 18 3 6 0.254 ns 22 7 4 0.274 ns 18 1 8 0.035 * Nov 19 5 4 0.500 ns 15 1 6 0.072 ns 19 7 2 0.090 ns 15 7 0 0.008 ** Dec 12 6 0 0.016 * 12 6 0 0.016 * 11 0 5 – – 12 0 5 – – Sum 236 75 38 0.001 *** 207 58 42 0.111 ns 236 60 56 0.384 ns 208 50 48 0.397 ns a
+: number of increases, −: number of decreases, ns: not significant, * p<0.05: significant, ** p<0.01: very significant, *** p<0.001: highly significant.
BGD
4, 651–685, 2007 Chlorophyll-a variability in the NW Adriatic L. Tedesco et al. Title Page Abstract Introduction Conclusions References Tables Figures ◭ ◮ ◭ ◮ Back Close Full Screen / EscPrinter-friendly Version Interactive Discussion
EGU
Table 2. Cox-Stuart test results for chlorophyll-a at C10 (left) and E06 (right)b.
C10 E06
cent. dis. cent. disp.
Month N + - p sig. + - p sig. N + - p sig. + - p sig.
Jan 10 5 0 – – 2 0 – – 12 5 1 0.109 ns 1 2 – – Feb 48 9 15 0.240 ns 4 4 0.637 ns 40 7 13 0.132 ns 3 3 0.656 ns March 23 6 5 0.500 ns 4 1 – – 21 7 3 0.172 ns 3 2 – – April 51 22 3 0.006 ** 5 4 0.500 ns 38 11 8 0.324 ns 4 5 0.500 ns May 64 17 15 0.393 ns 5 3 0.363 ns 68 16 18 0.393 ns 10 6 0.227 ns June 46 13 10 0.365 ns 8 3 0.113 ns 50 14 11 0.368 ns 4 3 0.500 ns July 73 12 24 0.075 ns 5 4 0.500 ns 62 16 15 0.399 ns 8 2 0.055 ns Aug 43 10 13 0.365 ns 5 6 0.500 ns 54 18 9 0.122 ns 5 3 0.363 ns Sep 83 20 21 0.399 ns 5 5 0.623 ns 74 19 17 0.378 ns 4 4 0.637 ns Oct 53 11 15 0.340 ns 4 4 0.637 ns 50 9 16 0.194 ns 3 5 0.363 ns Nov 44 6 15 0.058 ns 7 4 0.274 ns 28 5 9 0.212 ns 3 4 0.500 ns Dec 22 0 11 – – 3 2 – – 30 9 6 0.304 ns 3 4 0.500 ns Sum 278 131 147 0.266 ns 48 37 0.223 ns 262 136 126 0.341 ns 51 43 0.261 ns b
cent.: central trend, disp.: data dispersion, +: number of increases, −: number of decreases, ns: not significant, **p<0.01: very significant.
BGD
4, 651–685, 2007 Chlorophyll-a variability in the NW Adriatic L. Tedesco et al. Title Page Abstract Introduction Conclusions References Tables Figures ◭ ◮ ◭ ◮ Back Close Full Screen / EscPrinter-friendly Version Interactive Discussion
EGU
Table 3. Valid Number of samples, Median, Minimum, Maximum and Wilcoxon Matched Pairs
test for all the variables at C10 and E06c.
C10 E06 Wilc.test
Variable N Median Min. Max. N Median Min. Max. N T Z p sig. Temper. 563 15.8 7.5 28.8 528 15.2 5.8 29.4 527 67738 0.45 0.65 ns Salinity 563 37.5 31.0 38.6 528 37.6 15.7 38.5 527 64877 1.34 0.18 ns Density 563 27.6 20.5 29.9 528 27.9 11.2 30.0 527 65164 1.26 0.21 ns OxSatur 511 99.2 7.7 134.6 485 99.1 13.4 158.1 451 49519 0.52 0.60 ns N-NH3 548 0.3 0.0 21.6 507 0.6 0.00 31.7 497 38806 6.98 0.00 *** N-NO2 549 0.1 0.0 5.0 507 0.1 0.0 4.7 497 52009 1.88 0.06 ns N-NO3 547 0.6 0.0 25.5 506 0.9 0.0 93.1 494 47760 4.08 0.00 *** DIN 555 1.3 0.0 27.8 506 2.0 0.0 97.7 503 43553 5.90 0.00 *** Si-SiO4 548 2.1 0.0 30.1 509 3.3 0.0 54.8 498 47055 4.69 0.00 *** P-PO4 550 0.04 0.00 1.30 512 0.06 0.00 1.09 503 40285 5.98 0.00 *** Chl-a 564 0.9 0.0 11.4 530 1.1 0.0 25.3 530 62886 2.05 0.04 *
BGD
4, 651–685, 2007 Chlorophyll-a variability in the NW Adriatic L. Tedesco et al. Title Page Abstract Introduction Conclusions References Tables Figures ◭ ◮ ◭ ◮ Back Close Full Screen / EscPrinter-friendly Version Interactive Discussion
EGU
Table 4. Valid Number of samples, Median, Minimum, Maximum and Wilcoxon Matched Pairs
test for chlorophyll-a at C10 and E06 on a monthly scaled.
C10 E06 Wilc.test
Month N Median Min. Max. N Median Min. Max. N T Z p sig.
Jan 10 0.8 0.4 4.2 12 1.0 0.2 2.3 10 20.0 0.764 0.45 ns Feb 48 1.0 0.1 4.8 41 1.0 0.2 5.7 41 365.5 0.598 0.55 ns March 23 1.1 0.2 5.2 21 0.8 0.2 4.4 21 113.0 0.087 0.93 ns April 51 1.2 0.3 4.8 39 1.3 0.4 5.0 39 277.5 1.349 0.18 ns May 64 0.9 0.3 11.4 68 1.3 0.4 25.3 63 863.0 0.993 0.32 ns June 46 0.7 0.1 2.5 50 0.8 0.2 8.1 44 407.5 1.021 0.31 ns July 73 0.6 0.1 5.3 63 1.2 0.2 7.8 63 645.5 2.482 0.01 * Aug 47 0.7 0.1 10.3 54 0.9 0.2 19.4 46 344.0 2.147 0.03 * Sep 83 0.8 0.1 4.9 74 0.9 0.3 8.2 72 785.5 2.966 0.00 ** Oct 53 0.9 0.3 7.2 50 0.7 0.0 5.6 47 301.5 2.778 0.00 ** Nov 44 1.7 0.4 5.8 28 1.4 0.1 3.5 28 150.0 1.207 0.23 ns Dec 22 0.6 0.0 2.1 30 1.1 0.1 2.8 22 103.0 0.763 0.45 ns
BGD
4, 651–685, 2007 Chlorophyll-a variability in the NW Adriatic L. Tedesco et al. Title Page Abstract Introduction Conclusions References Tables Figures ◭ ◮ ◭ ◮ Back Close Full Screen / EscPrinter-friendly Version Interactive Discussion
EGU
Table 5. Shapiro-Wilk test results and data normalizatione.
C10 E06
Variable Tran. Norm. Tran. Norm.
Temperature no y no y
Salinity no y 3power y
Density no y no y
% Sat. Oxygen no y no y
N-NH3 log y log y
N-NO2 4root y 4root y
N-NO3 log y log y
DIN log y log y
P-PO4 4root n log n
Si-SiO4 log y log y
Chl-a log y log y
BGD
4, 651–685, 2007 Chlorophyll-a variability in the NW Adriatic L. Tedesco et al. Title Page Abstract Introduction Conclusions References Tables Figures ◭ ◮ ◭ ◮ Back Close Full Screen / EscPrinter-friendly Version Interactive Discussion
EGU
Table 6. Ridge Regression results for C10 (left) and E06 (right)f.
C10 E06
Beta s.e.Beta B s.e.B t(494) p sig. Beta s.e.Beta B s.e.B t(455) p sig. Intercept – – 1.667 0.411 4.057 0.000 – Intercept – – 0.584 0.107 5.436 0.000 – NO3 0.248 0.066 0.180 0.048 3.770 0.000 *** Salinity −0.361 0.055 −0.000 0.000 −6.578 0.000 *** Salinity −0.258 0.064 −0.043 0.011 −4.023 0.000 *** NO3 0.130 0.057 0.068 0.030 2.282 0.023 *
Depth 0.195 0.056 0.004 0.001 3.453 0.001 ** NH3 −0.145 0.051 −0.131 0.045 −2.874 0.004 ** Temper. −0.113 0.055 −0.004 0.002 −2.055 0.040 * PO4 −0.083 0.041 −0.205 0.101 −2.033 0.043 * %Ox.sat 0.084 0.048 0.001 0.001 1.759 0.079 ns SiSO4 0.159 0.060 0.086 0.032 2.671 0.008 **
NH3 −0.062 0.047 −0.070 0.053 −1.336 0.182 ns % Ox.sat 0.138 0.057 0.001 0.001 2.437 0.015 *
NO2 0.062 0.055 0.126 0.112 1.119 0.264 ns
fs.e.: standard error, ns: not significant, * p<0.05: significant, ** p<0.01: very significant, *** p<0.001: highly
BGD
4, 651–685, 2007 Chlorophyll-a variability in the NW Adriatic L. Tedesco et al. Title Page Abstract Introduction Conclusions References Tables Figures ◭ ◮ ◭ ◮ Back Close Full Screen / EscPrinter-friendly Version Interactive Discussion EGU 12.5 13 13.5 14 43.5 44 44.5 45 45.5 C10 E06 Cesenatico Caorle Chioggia Adriatic Sea N
BGD
4, 651–685, 2007 Chlorophyll-a variability in the NW Adriatic L. Tedesco et al. Title Page Abstract Introduction Conclusions References Tables Figures ◭ ◮ ◭ ◮ Back Close Full Screen / EscPrinter-friendly Version Interactive Discussion EGU 10-Apr 10-Apr 11-Apr 12-Apr 13-Apr 14-Apr 15-Apr 16-Apr 17-Apr 18-Apr 19-Apr 20-Apr 0 500 1000 1500 2000 2500 3000 3500 4000 discharge (m 3/s) Mean ±SE ±SD J F M A M J J A S O N D
Fig. 2. Monthly mean and variability of the Po river discharge (daily data from “Magistrato del
BGD
4, 651–685, 2007 Chlorophyll-a variability in the NW Adriatic L. Tedesco et al. Title Page Abstract Introduction Conclusions References Tables Figures ◭ ◮ ◭ ◮ Back Close Full Screen / EscPrinter-friendly Version Interactive Discussion
EGU
GENFEBMAR APR MAG GIU LUG AGOSET OTT NOV DIC
0 10 20 30 40 50 60 70 80 90 No of obs C10 n = 564 E06 n = 530
BGD
4, 651–685, 2007 Chlorophyll-a variability in the NW Adriatic L. Tedesco et al. Title Page Abstract Introduction Conclusions References Tables Figures ◭ ◮ ◭ ◮ Back Close Full Screen / EscPrinter-friendly Version Interactive Discussion EGU 1986 1988 1990 1992 1994 1996 1998 2000 2002 2004 0,01 0,03 0,05 0,07 0,10 0,30 0,50 0,70 1,00 3,00 5,00 7,00 10,00 ch l-a 1986 1988 1990 1992 1994 1996 1998 2000 2002 2004 0,01 0,03 0,05 0,07 0,10 0,30 0,50 0,70 1,00 3,00 5,00 7,00 10,00 ch l -a
BGD
4, 651–685, 2007 Chlorophyll-a variability in the NW Adriatic L. Tedesco et al. Title Page Abstract Introduction Conclusions References Tables Figures ◭ ◮ ◭ ◮ Back Close Full Screen / EscPrinter-friendly Version Interactive Discussion EGU 25 20 15 10 -5 0 J F M A M J J A S O N D (a) -25 -20 -15 -10 -5 0 J F M A M J J A S O N D (b) -25 -20 -15 -10 -5 0 J F M A M J J A S O N D (c) -25 -20 -15 -10 -5 0 J F M A M J J A S O N D (d) -25 -20 -15 -10 -5 0 J F M A M J J A S O N D (e) -25 -20 -15 -10 -5 0 J F M A M J J A S O N D (f) -25 -20 -15 -10 -5 0 J F M A M J J A S O N D (g) -25 -20 -15 -10 -5 0 J F M A M J J A S O N D (h) -25 -20 -15 -10 -5 0 J F M A M J J A S O N D (i) -25 -20 -15 -10 -5 0 J F M A M J J A S O N D (j) -25 -20 -15 -10 -5 0 J F M A M J J A S O N D (k)
(a) Temperature (◦C), (b) Salinity, (c) Density (γ-t), (d) Ammonia (µmol dm−3), (e) Nitrite
(µmol dm−3), (f) Nitrate (µmol dm−3), (g) Diss.Inor.Nitr. (µmol dm−3), (h) Phosphate (µmol dm−3), (i) Silicate (µmol dm−3), (j) Dissolved oxygen (% sat.), (k) Chlorophyll-a (µg dm−3).
BGD
4, 651–685, 2007 Chlorophyll-a variability in the NW Adriatic L. Tedesco et al. Title Page Abstract Introduction Conclusions References Tables Figures ◭ ◮ ◭ ◮ Back Close Full Screen / EscPrinter-friendly Version Interactive Discussion EGU -25 -20 -15 -10 -5 0 J F M A M J J A S O N D (a) -25 -20 -15 -10 -5 0 J F M A M J J A S O N D (b) -25 -20 -15 -10 -5 0 J F M A M J J A S O N D (c) -25 -20 -15 -10 -5 0 J F M A M J J A S O N D (d) -25 -20 -15 -10 -5 0 J F M A M J J A S O N D (e) -25 -20 -15 -10 -5 0 J F M A M J J A S O N D (f) -25 -20 -15 -10 -5 0 J F M A M J J A S O N D (g) -25 -20 -15 -10 -5 0 J F M A M J J A S O N D (h) -25 -20 -15 -10 -5 0 J F M A M J J A S O N D (i) -25 -20 -15 -10 -5 0 J F M A M J J A S O N D (j) -25 -20 -15 -10 -5 0 J F M A M J J A S O N D (k)
(a) Temperature (◦C), (b) Salinity, (c) Density (γ-t), (d) Ammonia (µmol dm−3), (e) Nitrite
(µmol dm−3), (f) Nitrate (µmol dm−3), (g) Diss.Inor.Nitr. (µmol dm−3), (h) Phosphate (µmol dm−3), (i) Silicate (µmol dm−3), (j) Dissolved oxygen (% sat.), (k) Chlorophyll-a (µg dm−3).
BGD
4, 651–685, 2007 Chlorophyll-a variability in the NW Adriatic L. Tedesco et al. Title Page Abstract Introduction Conclusions References Tables Figures ◭ ◮ ◭ ◮ Back Close Full Screen / EscPrinter-friendly Version Interactive Discussion EGU January 0,008 0,040,08 0,4 0,8 4,0 8,0 3 0 6 12 18 24 depth (m) February 0,008 0,040,08 0,4 0,8 4,0 8,0 3 0 6 12 18 24 depth (m) March 0,008 0,040,08 0,4 0,8 4,0 8,0 3 0 6 12 18 24 depth (m) April 0,008 0,040,08 0,4 0,8 4,0 8,0 3 0 6 12 18 24 depth (m) May 0,008 0,040,08 0,4 0,8 4,0 8,0 3 0 6 12 18 24 depth (m) June 0,008 0,040,08 0,4 0,8 4,0 8,0 3 0 6 12 18 24 depth (m) July 0,008 0,040,08 0,4 0,8 4,0 8,0 3 0 6 12 18 24 depth (m) August 0,008 0,040,08 0,4 0,8 4,0 8,0 3 0 6 12 18 24 depth (m) September 0,008 0,040,08 0,4 0,8 4,0 8,0 3 0 6 12 18 24 depth (m) October 0,008 0,040,08 0,4 0,8 4,0 8,0 3 0 6 12 18 24 depth (m) November 0,008 0,040,08 0,4 0,8 4,0 8,0 3 0 6 12 18 24 depth (m) December 0,008 0,040,08 0,4 0,8 4,0 8,0 3 0 6 12 18 24 depth (m)
Fig. 7. Monthly vertical profiles of chlorophyll-a (log-scale) and range of variability at C10 (red
BGD
4, 651–685, 2007 Chlorophyll-a variability in the NW Adriatic L. Tedesco et al. Title Page Abstract Introduction Conclusions References Tables Figures ◭ ◮ ◭ ◮ Back Close Full Screen / EscPrinter-friendly Version Interactive Discussion EGU Dep T S Ox NH3 NO2 NO3 SiO4 PO4 Ch -1,0 -0,5 0,0 0,5 1,0 Factor 1 : 31,70% -1,0 -0,5 0,0 0,5 1,0 Factor 2 : 19,90% 1,0 0,5 0,0 -0,5 -1,0 -0,5 -1,0 0,0 0,5 1,0 Factor 1 : 31,69% Factor 2: 27.00% Ch NO2 SiO4 Dep S T Ox PO4 NH3 NO3
Fig. 8. PCA: projection of the variables (T: temperature, S: salinity, Dep: depth, Ox: oxygen
% sat., NH3, NO2, NO3, PO4, SiO4, Ch: chlorophyll-a) on the factor plane (C10, left and E06, right).