HAL Id: halshs-01390899
https://halshs.archives-ouvertes.fr/halshs-01390899
Submitted on 2 Nov 2016
HAL is a multi-disciplinary open access archive for the deposit and dissemination of sci-entific research documents, whether they are pub-lished or not. The documents may come from teaching and research institutions in France or abroad, or from public or private research centers.
L’archive ouverte pluridisciplinaire HAL, est destinée au dépôt et à la diffusion de documents scientifiques de niveau recherche, publiés ou non, émanant des établissements d’enseignement et de recherche français ou étrangers, des laboratoires publics ou privés.
The evolution of insurance regulation in the EU since
2005
Pierre-Charles Pradier, Arnaud Chneiweiss
To cite this version:
Pierre-Charles Pradier, Arnaud Chneiweiss. The evolution of insurance regulation in the EU since 2005. 2016. �halshs-01390899�
Documents de Travail du
Centre d’Economie de la Sorbonne
The evolution of insurance regulation in the EU since 2005
Pierre-Charles PRADIER, Arnaud CHNEIWEISS
1
The evolution of insurance regulation in the EU since 2005
Pierre-Charles Pradier,
LabEx RéFi and Paris 1 Panthéon-Sorbonne Arnaud Chneiweiss,
Fédération Française de l’Assurance Abstract
The Solvency 2 package, which went on force on January 1st, 2016, has had strong
implications on the insurance companies’ market conduct, consumer relation and solvency; an ongoing process with the FSB and the IAIS due to address systemic risk is also impacting systemic insurers. These milestones of insurance regulation are aimed at solving the social cost of the failure of financial institutions, in order to prevent future crisis. The paper at hand reviews the detail of these considerable reforms and show the consistence of the whole: prevention of systemic and microeconomic risk is first seen as prevention of regulatory arbitrage with the banking sector. This thorough legal package has but a cost, not only for every firm (cost of implementation of reforms, recurring cost of compliance including direct cost of funding supervisory authorities, indirect administrative costs and cost of regulatory capital) but also for the sector as a whole. We show that most of these costs have been played down so far, since the crisis prompted the authorities to appear tough on finance and set examples. Unfortunately, costs lead to market concentration and uniformization, which have significant systemic implications. To address this issue, finance future growth, advance market integration and development, we offer some insights on simplification and focusing of insurance regulation.
1. Introduction
While the consequences of the 2008 financial crisis seem to roll away, with many countries either back to growth or facing different problems, there is still a common tendency to blame the financial sector for the grim economic situation of the Eurozone, as if every financial institution bore a portion of liability for high unemployment, low investment and sad economic outlook. Some seem even more liable than others: in a report to the G-20 members, IMF (2009) chose to study the cases of Northern Rock, Lehman Brothers and American International Group. Is it to say that the insurance sector is responsible for one third of the misfortunes of the time? This would be highly questionable. Nevertheless, there is a widespread idea now that strong regulation of the insurance sector is needed to improve overall welfare. In the EU, the legal framework has shifted from “Solvency I” set of third generation EU directives (2002/13/EC for nonlife insurers and 2002/83/EC for life insurers) implemented in 2004 to Solvency 2 (later S2), passed in November 2009 as directive 2009/138/EC, eventually implemented since January 1st, 2016 after many delays. Meanwhile a European Insurance and
Occupational Pension Authority (EIOPA) was created in 2010 together with banking (EBA) and market (ESMA) counterparts to enforce the law and supervise the corresponding actors. To what aim?
The International Association of Insurance Supervisors issued in 2011 “insurance core principles” (later ICP) defining the objectives of supervision: “maintaining a fair, safe and stable insurance sector for the benefit and protection of the interests of policyholders” (IAIS 2013c p. 4). Decoding is needed to understand that “fair” is related to market or conduct regulation, “safe” to solvency regulation and “stable” to the system-wide consequences of firm-level problems, hence systemic risk1. European Union
Commission, on the other hand, takes into account a broader picture, where regulation aims at economic growth and employment through adequate microeconomic incentives (DG ECOFIN 2007). European regulation, though, must also develop the European single market, while the insurance sector still appears fragmented at country level. A true European insurance market is needed to enable students and workforce to move freely inside the Union; it would make local innovation available at the Union level; it would thus benefit employment and growth.
In order to analyse in due detail the aforementioned themes, the remaining of the paper is organized as follows: (2.) deals with market regulation; (3.) is concerned with solvency; (4.) with systemic risk; (5.) summarises the costs of regulation and their consequence, while (6.) will be looking at the consistency of the whole and offers some further developments and alternatives.
* 2. Market regulation
Market regulation is related to business conduct, comprising both business-to-business and business-to-consumer relationships. We will review price regulation (2.1.), and explicit consumer protection (2.2.) before turning to solvency, which can be understood as a particular form of consumer protection.
2.1. Price regulations
Back in the 80’s or early 90’s, insurance firms were in many continental European countries under close supervisory tutelage since EU Member States could introduce “laws, regulations or administrative provisions concerning, in particular, approval of general and special policy conditions, of forms (…) of premiums…” (Dir. 1988/357/EC on non-life insurance art. 18, Dir. 1990/619/EC on life insurance art. 12). The 1992 Directives terminated this “interventionist era” and abolished prior approval of prices and forms (see especially art. 39 of Dir. 1992/49/EC on non-life and art. 29 of Dir. 1992/96/EC on life insurance). By that time, 31 US States also had prior rate approval for automobile
1 The recent reference paper on insurance regulation in the Handbook of insurance (Klein 2014) uses
different words to address the same issues: “(1) catastrophe risk, (2) competition and (3) systemic risk”, with catastrophe being connected to solvency, competition to market and conduct and systemic risk is obvious. See also recital (16) of S2: “The main objective of insurance and reinsurance regulation and supervision is the adequate protection of policy holders (…) Financial stability and fair and stable markets are other objectives of insurance regulation.”
3
insurance (Harrington 2002 p. 292). The rationale for the liberal move of the EU was the inefficiency of prior approval; as Harrington later brilliantly summed up: “There is little or no evidence that prior approval on average has a material effect on average rates for any given level of claim costs. This finding is consistent with an inability of rate regulation to reduce average rates materially and persistently in competitively structured markets without significantly reducing product quality or ultimately causing widespread exit by insurers.” (Harrington 2002 pp. 310-311)
In fact, some marginal price regulation remained, such as the compulsory ‘bonus’ system in France (code des assurances A. 121); the basic idea behind it was to allow comparison of prices over time, a feature now rendered useless by Internet price comparison sites and on-demand contract termination (enabled by the recent 2014-344 law on consumption in France). The strongest point on pricing policy, though, was made by the European Court of Justice ruling of 1 March 2011 in the Test-Achats case (C-236/09), which gave insurers until 21 December 2012 to change their pricing policies in order to treat individual male and female customers equally in terms of insurance premiums and benefits. The scope of the ruling has since then been thought (Rego 2015) as encompassing all topics covered by Article 21 of the Charter of Fundamental Rights of the European Union (2000/C 364/01): “Any discrimination based on any ground such as sex, race, colour, ethnic or social origin, genetic features, language, religion or belief, political or any other opinion, membership of a national minority, property, birth, disability, age or sexual orientation shall be prohibited.” It is now uncertain whether place of residence will remain a valid basis for price discrimination after the EU commission decided in July 2015 to probe Eurodisney for charging more Northern Europe customers (Barker 2015). But the general idea is such: the supervisor is no longer supposed to decide on insurance prices, only the principles of pricing policy are amenable to regulation according to general non-discrimination principles.
Table 1 – Evolution of insurance prices 1996-2014 as % of CPI average dwelling health transport other
104,26 91,07 164,43 99,58 186,86
Source: Eurostat, HICP COICOP CP125 The overall effect of the liberalization of insurance marketing since the 90’s seems quite satisfactory. Table 1 shows that the price of insurance grew overall on almost the same pace as general inflation, with property-casualty insurance (as exemplified by dwelling and transport insurances) even slower than Consumer Price Indices, and health insurance growing faster since health expenses outpaced other consumption items in the EU. Appendix 1 shows that prices in the EU grew not as fast as in the European Economic Association, for instance, indicating that EU regulation could be better than the neighbour countries’. Now if we look at price convergence in the Union, the Eurostat Harmonised Index of Consumer Prices (see Appendix 1) is not precise enough since it provides only variations, not absolute levels, hence all we can learn is roughly that Eastern Europe (apart from Romania and Bulgaria) experienced a relative fall in prices, which can be interpreted as convergence toward Western European prices. It seems difficult to go farther than this conjecture, since average price for insurance contracts computed by most member states insurance associations do not feature the same
guarantees from one country to another. Overall, the general moderation of prices tends to show that competition is working better than under the previous overdone supervision. Until recently, academic evidence interpreted internet as a disciplining device: Brown and Goolsbee 2002 had shown that use of internet significantly reduced the price of insurance products which were offered through the online channel, and hence amenable to easy comparison. This evidence has been recently challenged by theoretical papers (Edelman-Wright 2015, Ronayne 2015), which proved that price comparison websites do not warrant the desirable properties of perfect competition (e. g. a unique price for a given service), furthermore these sites add their margin to the price paid by the consumer, a feat with a significant negative welfare impact. The combined effect has to be taken into account, not before business models in distribution are stabilized after further innovation likely to happen in the coming years.
Our inquiry so far proves that consumer protection issues have changed dramatically since the 1980’s: with increased competition, overpricing is no longer a concern for the supervisor. Concern remains on misinformation and misselling on the one hand dealt with by ‘conduct authorities’, while on the other hand ‘prudential authorities’ focus on solvency (3. below), which might become an issue when contracts are underpriced (see also Plantin-Rochet 2007).
2.2. Consumer protection
Most new rules pertaining to consumer protection are related to information: S2 articles 183 to 186 list precisely what information should be included in the contracts. Moreover, the Packaged Retail and Insurance-based Investment Products (PRIIPs, Regulation EU1286/2014) defines the set of key facts (assembled in a Key Information Document or KID), which should be provided to retail customers by investment product manufacturers; the number of pre-sale obligations also rise (from 29 to 102 according to Insurance Europe). The Insurance Distribution Directive (Directive EU 2016/97 due for implementation in national law in 2018) will force brokers to disclose the incentives and remuneration given to them by insurance companies. This normative approach is in fact different from prior form approval, as it existed before 1992, since consumer information is now in a process of being harmonized among Member States, not the contractual clauses themselves.
It should be emphasized that a common legal framework does not imply uniform supervision, as the recent history has shown: the appointment of Martin Wheatley as head of the Financial Conduct Authority of the United Kingdom in 2011 was seen as a symbol of an especially tough stance, which now seems to have reached its limits in the UK (FT 2015). Martin Wheatley had a personal record of solving a difficult case at Hong Kong’s Securities and Futures Commission, where thousands of savers lost money in complex structured products linked to Lehman Brothers. George Osborne, the UK chancellor of the Exchequer, chose him to broker a solution in the Personal Protection Insurance (PPI) mis-selling crisis as more than 1 million complaints have already been filed against intermediaries for various mis-selling of these products (which were usually sold to people who already enjoyed an income insurance in case of illness or unemployment, or sold on wrong promises). The boss of the FCA set up a simplified process, which enabled the plaintiffs to get their money back (FCA 2014). As of May 2016, more than 15m
5
complaints have been filed, leading to more than £23.8bn redress paid since 20112. Never
had such a large sum been paid as the result of a financial regulator’s decision. The need for funding led to price increases in the UK (see Appendix 1), which appeared to be detrimental to the consumer in the long run; this ultimately led Wheatley to resign. The punitive approach is still fashionable on the Continent, especially in France, where every foreign example is followed with utter toughness:
• the French Conseil d’Etat decision n° 353885 (23 July 2012) about loan insurance mimics the FCA approach to PPI,
• the French and Belgian action in favour of dormant life insurance contracts is modelled after the reparation of Nazi Germany crimes against the Jews.
In France, complaints against loan insurance are very common and the PPI is more or less a reference among commentators. There is an undeniable problem as competition between banks crushed their profit margins so most of the money they make when lending is on loan insurance: a typically perverse situation which has led to many complaints. In 2012 eventually, the Conseil d’Etat settled the pending cases by deciding that 1. a section of the code des assurances (article A. 331-3) to have been illegal before an ordinance of 23 April 2007 was issued to correct the problem; and 2. no redress were to be awarded, since the decision n° 307089 of 5 May 2010 by the same Conseil d’Etat, already established that only a clause in the contracts (which was banned by the aforementioned article A. 331-3) could have justified such redress. In the end, the Conseil did not go far enough to make the State liable for its past error, but the symbolic aspect of the decision was widely commented.
The French and Belgian action about dormant life insurance contracts has its origin in the action taken in reparation of aryanization by Nazi Germany. An International Commission on Holocaust Era Insurance Claims was setup in 1998 (ICHEIC 2007b), which eventually permitted to award more than $300 million to 48,000 claimants (ICHEIC 2007a). In Europe, the Directive 2002/83/CE included some provisions to enable the claims to be processed; they were translated in France by law n° 2005-1564 15 December 2005 and in Belgium by 24 July 2008 law, after an independent commission reported on the extent of looting of Jewish property during the War (Buysse 2008). Hence a one-off reparation of past injustices led to a permanent jurisprudence with non-negligible consequences: in France alone, two more laws were passed to settle the case of dormant insurance contracts (law n° 2007-1775, 17 December 2007 and n° 2014-617, 13 June 2014). Media coverage boasted billions retained by the insurers while the vice-president of the supervisor (ACPR) claimed the insurers to behave “scandalously” (Le Monde 2013), but no formal impact assessment was performed; in the end, the French legal provisions organize the custody of dormant contracts by the state-owned Caisse des Dépôts before they are taken over after 20 years: the State is then so much concerned by customer protection that it has entitled himself as perpetual trustee. Apart from these good
2
intentions, the main result for the time being was administrative penalties3 imposed
upon some insurance companies by ACPR, the largest so far in French history. *
Since the liberal reform of 2002, Europe is relying on effective competition to achieve price discipline in the insurance sector, with apparent success. Consumer protection is now seen by European authorities as the provision to the prospect or consumer of exhaustive product information. Recently, some national insurance supervisors or regulators have taken a tougher stance, which contrasts with a legal approach aimed at European harmonization. Let us look now more precisely at the solvency regulation, which is designed to enforce the policyholder’s right to indemnification.
3. The Solvency II Process
The S2 regulatory package contains provisions for consumer protection, but as the name implies, its main focus is on solvency. We introduce the objectives and features of the regulatory package (3.1.) before we review the positive aspects (3.2.) and the more controversial, still unsolved issues (3.3).
3.1. Objective and features of the Solvency II package
The proposed directive was introduced with an accompanying document (EC 2007) looking like an extended set of recitals, stating four weaknesses of the then current regulatory regime and four objectives for the planned one:
• Weaknesses of existing regime
o (w1) Lack of risk sensitivity (the capital requirement of Solvency I were function of premia or claims, not of the effective risk faced by insurance institutions);
o (w2) Restriction of the single market (Solvency I “sets out minimum standards that can be supplemented by additional rules at national level”) ; o (w3) Insufficient supervision of conglomerates and groups;
o (w4) Lack of convergence with both the banking regulation (i. e. Basel) and the international standards (as promoted by the International Association of Insurance Supervisers) leading to possibility of regulatory arbitrage. • Objectives of planned reform
o (o1) Deepen the integration of the EU insurance market;
o (o2) Enhance the protection of policyholders and beneficiaries;
o (o3) Improve the international competitiveness of EU insurers and reinsurers;
o (o4) Promote Better Regulation; • One should add now
o (o5-r), financial stability, which was not a major issue in 2007, but became the main concern of policymakers when the crisis broke out and took momentum.
3 10m€ for Cardif on the 7April 2014, 40m€ for CNP on 31 October 2014, 50m€ for Allianz on 19 December
7
While o4 seems an obvious objective for any concerned lawmaker and o1 seems to respond to w2 by extending the scope of the EU regulation (thus leaving less to do at the national level to prevent regulatory arbitrage between countries), o3 and o2 might appear conflicting as the protection of policyholders raises the cost function of the insurers, while greater international competitiveness could only be achieved by extracting a higher profit from the domestic consumers. Alternatively, the idea behind the reform package is simply that insurance buyers are paying to be sure that they will get relief in case of an unfortunate event; in other words they are buying the insurance company’s solvency. Better regulation (o4) can then warrant solvency (hence the name) and thus raise consumer satisfaction in order to improve insurer competitiveness.
The constraints w4 and w3 determine S2 to converge with the banking sector regulation to guarantee conglomerates are correctly monitored and to prevent regulatory arbitrage between sectors. Hence the architecture of the new reform looks very much like the then-in-force Basel II standards, with three “pillars4”:
• Pillar 1 – quantitative (capital) requirements – includes market-consistent valuation of the balance sheet leading to a risk-sensitive (w1) assessment of capital requirements.
• Pillar 2 – is relative to corporate and risk governance.
• Pillar 3 – is concerned with disclosure and transparency requirements. More precisely, Pillar 1 introduces deep changes with former practices:
• All assets and liabilities obey a market consistent valuation (art. 75)5. Insurance liabilities that cannot be valued using market prices is split into a best estimate (current estimate of expected cash flows, discounted using the risk free yield curve) and a risk margin (costs of ensuring that the capital needed to support the insurance obligations, based on a cost-of-capital rate given by the supervisor). • Then a Solvency Capital Requirement or SCR is calculated a the sum of partial risks
plus correlation factors. For every risk class, an assessment is made of the loss that may arise with a 0.5% probability over the next 12 months6 : this is the
(100%-0.5%=) “99.5% 1-year Value-at-Risk”.
4 Although neither the pillars themselves nor their designation appear in the Directive, every analytical
introduction to Solvency II describes these pillars by analogy with Basel II.
5 Prudential accounting standards are specific, albeit close to IFRS 4 ‘phase I’, which are compulsory for
listed companies and will be replaced by ‘phase II’, likely to be implemented in 2019 after two exposure drafts in 2010 and 2013. For a comparison of the two standards, see Visser and McEneaney 2015.
6 The solvency capital requirement is such that it must provide the insurance firm with enough own funds
to absorb the operating loss that could occur 199 years out of 200 (if the financial future is consistent with the observed history since 1971). Conversely, there is only 1 in 200 chance that the solvency capital requirement is not enough to overcome the operating loss.
This operating loss can be computed with an internal model authorized by the relevant supervisor or with the standard formula as the sum of partial risks (EIOPA 2014) broken down into 3 categories (Basic SCR, Operational risk and adjustment); BSCR features 6 modules and 35 sub-modules, every one being the Value-at-Risk at 99,5% of the corresponding risk. The standard formula takes correlation into account, through the definition equation:
!"#$ = !"#! !" !!! + !!,!!"#!!"#! !" !!! !!! !" !!! , or more generally
• If the own funds (classified in three tiers according to their quality) are below SCR, then the supervisor should take appropriate action.
• Minimum Capital Requirement (MCR) is a lower threshold7: if the own funds are insufficient to cover MCR, immediate and ultimate supervisory action is triggered. Pillar 2 (art. 40-50) defines the central Own Risk Self Assessment (art. 45) and imposes strong requirements on the key functions (art 41-49: Actuarial Function, Internal Audit, Internal Control, Risk management plus governance), which should be performed by fit and proper persons. Pillar 3 defines specific prudential accounting standards as well as disclosure modes to the supervisor (art. 27-39, revised in Omnibus) and to the public (art. 51-56).
This important regulation received mixed appreciation. 3.2. Positive interpretation
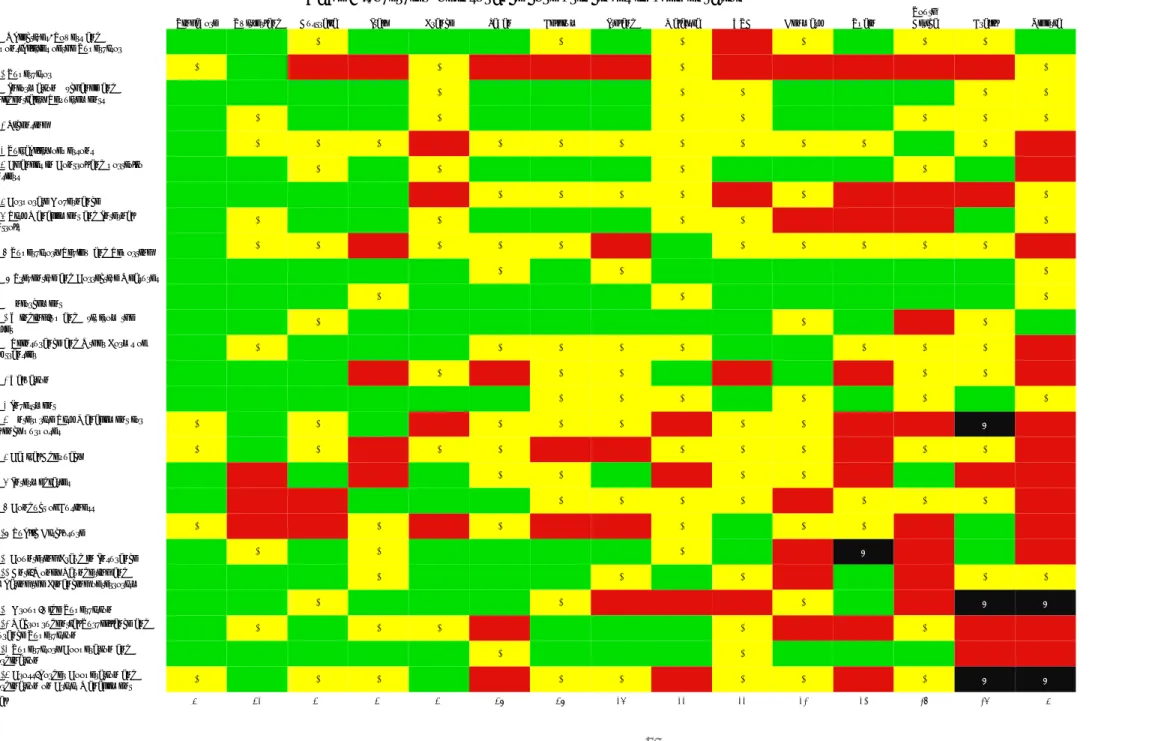
By comparison with other regulatory frameworks, S2 was generally welcomed by academics. In particular, Doff (2008), Holzmüller (2009), Lorent (2010) among others, compared the planned reform to main other frameworks by applying a set of criteria, which are summed up in chart 1: the EU Solvency appears to clearly dominate the US regulation, and does marginally better than the Swiss in some respect, as their summary table shows.
Chart 1 – Assessment of selected regulatory frameworks
!"#$ = !!,!!"#!!"#! !" !!! !" !!!
where !!,! denotes the linear correlation coefficient between !"#! (for sub-module i) and !"#! provided by
the supervisor.
7 Article 129 of the Directive introduced calculation principles for the MCR, which were rather vague, and
article 130 enabled the Commission to adopt implementing measures. The final rules (Delegated
Regulation EU 2015/35 art 248-253) are far more complex than the usually alleged “1-year 85% VaR” of the original Directive. The most striking feature of the complete rule set is that MCR is not fully risk-sensitive. To be more precise, MCR is the maximum of a linear formula (involving mostly technical provisions of the company) and of 25% of the SCR, capped at 45% of the SCR.
9
From Holzmüller (2009) p. 74 These criteria, while being somewhat shared among insurance academic specialists, are not aligned with the Insurance Core Principles as defined by the International Association of Insurance Supervisors, for instance (IAIS 2013c). There is some overlapping among the sets of criteria, though: for instance item #1 ‘getting appropriate incentives’, in Holzmüller is connected to ICP7 (corporate governance) and ICP17 (capital requirements); item #2 is reminiscent of ICP16 (ERM for solvency purposes8) and
ICP17; item #3 is relative to preliminary impact assessment which should meet, among others, ICP17 at a micro level and ICP24 at a macro level; #4 is also connected to ICP24; #5 is related to ICP14 (valuation); etc.
Preliminary impact assessment generally concluded that sound principles were correctly implemented by the projected reform, and that they would enable more effective competition and supervision, leading to healthier insurance firms and better pricing of products, hence a higher demand and consumption of insurance products, leading to enhanced consumer satisfaction with a positive impact on growth, as academic research such as Outreville (1990) and Webb and al. (1992) had shown. While “the direct macroeconomic effect of Solvency II would be rather marginal”, the study ordered by the European Commission in 2007 concluded that the process would lead to better efficiency and better European integration of both the insurance industry and the financial markets (DG ECOFIN 2007). The ECB was more prudent in identifying possible short to medium-term issues (see below § 5.3). On the long term, though, the effect was to be positive for the aforementioned reasons. It should be emphasized that, in comparison with the Basel regulation for banks (see Elkhalloufi and Pradier in this volume), the impact studies were mostly qualitative, with no precise forecasting of impact on the EU economy.
The a priori impact assessments were then supplemented by a series of Quantitative Impact Studies: five rounds have been carried on by the former insurance supervisor committee (CEIOPS) and voluntary insurers, from 2005 to 2010. The summary information shown in table 2 deserve interpretation:
• QIS and QIS2 were reviews intended to setup the methodology and new accounting rules. Hence not all participating firms were able to compute even the best estimate of insurance liabilities, let alone the probabilistic distribution thereof (needed to provide percentiles). Increased participation between QIS and QIS resulted by a falling response rate.
• QIS3 and later were true calibration experiences, testing the practicability of the standard formula among various social forms, such as insurance groups and mutual insurers9;
8 Cf. 16.16.13 “risk sensitive regulatory financial requirements should provide the incentive for optimal
alignment of the insurer’s risk and capital management and regulatory requirements”
9 QIS3 noted about the mutual insurers that a “severe fall was detected in their financial position and this
might be an insolvable issue because of the limited possibilities these firms have in raising own funds” (p. 23). Additional reflection was thus devoted about the mutuals’ specific capitals through supplementary
• In QIS4 and QIS5, a significant share of the participants used internal models, so that their output should be compared to the result of using the standard formula. • QIS5 involved 50% of all EU insurers totalling 85% of underwritten premiums and
95% of insurance provisions. 4.6% of the participants did not meet the MCR, which triggers “immediate and ultimate supervisory action”.
This latter figure was both very high as it meant 116 companies should be resolved or have their portfolio transferred, and rising quickly in comparison with QIS4, where the MCR-failure rate was 75% lower. QIS5 was then a turning point in the preliminary assessment, with a significant deterioration of the companies’ solvability. While this can be partly attributed to the consequences of the financial crisis, it could be feared that smaller, more fragile insurance undertakings surfaced with the extension of the sample, hence even more should follow among the 2,500 remaining firms who did not take part in QIS5.
As a result, additional impact study was performed under the title Long-Term Guarantees Assessment, testing few scenarios to fine-tune S2. While S0 provides the baseline scenario (S2 as of the 2009 Directive), S1 introduced some accounting changes so that the failure rate was kept at more reasonable level. 10% is still a very high failure rate, in comparison with the historical values recompiled for 2004 and 2009, even if one keeps in mind that the assessment did not make use of (generally less demanding) internal models. The latest simulation to date, a set of stress tests conduced in late 2014 (EIOPA 2014), also shown high level of SCR/MCR violation (respectively 14 to 16 and 6 to 8%) in unstressed scenario, climbing up to 44% in case of stress. Meanwhile, critics became increasingly vocal.
11
Table 2 – Summary of Quantitative Impact Studies
Source: CEIOPS (2006), (2007), (2008), (2009), (2010); EIOPA (2013), (2014); authors’ calculations.
exercise
name QIS QIS2 QIS3 QIS4 QIS5
LTGA
(S0) LTGA (S12) LTGA (S10) LTGA (S1) 2014 ST (base) 2014 ST stressed
Year 2005 2006 2007 2008 2010 2012 2004 2009 2012 2014 2014 # of participating firms 272 514 1027 1412 2520 427 427 427 427 167/225 167/225 market share (premium) 44% 60% >65% >75% >85% (TP) 70% (TP) 70% (TP) 70% 70% (TP) 55-60% 55-60% % of participants reporting best estimate 90 80 91 100 100 100 100 100 100 100 100 % of participants reporting 90th percentile 66 68 most 100 100 100 100 100 100 100 100 % of participants with partial internal models
nil some 13 50 42 n/a n/a n/a n/a n/a n/a
% of participants with
total internal models nil some some n/a 10 n/a n/a n/a n/a n/a n/a % of participants
that
do not meet MCR n/a n/a 2 1.20 4.60 28 4 3 10 6-8 ? % of participants
that
do not meet SCR n/a n/a 16 11 15 46 13 12 29 14-16 20-44 Additional
regulatory capital
(S2 RC – S1 RC) n/a n/a n/a (€46bn) €56bn n/a n/a n/a €88bn n/a n/a Cost of capital
(EY Euro Upper Bound + 6% as of
QIS5)
3.3. Criticism
The advent of a protracted financial crisis interfered with the consultation and deployment process and displayed disappointing consequences of the planned framework. Critical features included procyclicality and the feedback loop between accounting rules and capital requirements (A.), impact on investments (B.) and (C.) low predictive power of the capital requirements. While the appropriateness of a bank-based prudential model is still controversial, we save this criticism for later discussion (see below section 4).
A. Accounting-capital requirements feedback loop
In stark contrast with the lenient preliminary impact assessment (DG ECOFIN 2007), some economists issued a critical appraisal of the interaction between market value accounting and capital requirements: the Glachant et al. (2010) volume by the French economic council (the PM’s counselling team) issued an early warning shot. First, Natacha Valla (2010) recalled that an investor with liquidity constraint might be forced to sell his assets in order to get cash; if forced to do so in time of trouble, he will be caught in a feedback loop: I need some cash therefore I sell assets, but doing so I increase the excess supply of assets, which leads to falling prices and the need to sell more assets in order to obtain the same amount of cash, etc. As Rodarie (2010) shows, the business model of insurance (with inverted production cycle) normally leads to positive cash flows, hence no liquidity constraint should be experienced unless the firm is poorly managed, in which case the supervisor should intervene before the liquidity problem arises. Eventually, thinking in terms of liquidity constraints is just like thinking all insurers are doing bad, which does not seem a sound basis for supervision.
Lombard and Mucherie (2010) advance a step further, showing that the combination of market valuation of asset and 1-year VaR actually transforms the risk of feedback loop into certain procyclicality: when the balance sheet of the insurance company is assessed according to market value, the value of the asset side will follow the economic cycle, while the liabilities (being mostly insurance provisions) will stay steady; hence the own funds fluctuate according to the cycle (while the target SCR is approximately constant). Insurance firms will then need to build up capital requirements in the downturns. If they cannot raise any more own funds, they will need to sell part of their asset to diminish their SCR. In the first case, they will crowd out other borrowers hence negatively contribute to the long-term financing of the economy, in the second case, they will start fire sales that could cause market crash according to Valla’s feedback loop model. In both cases, the capital requirements are procyclical and only add problems in time of crisis.
In the same volume, La Martinière (2010) shows that VaR is not intrinsically perverted: if 1-year VaR means that we consider stress on the economic environment while the assets set to be held to maturity (of the corresponding liabilities, as stocks, for instance, do not have an intrinsic maturity) are valued at their “long-term” price, then the procyclicality would disappear. The problem is that most supervisors interpreted 1-year VaR to be computed on the liquidation value of assets, which leads to procyclicality. Once again, this would mean that all insurance firms are supervised in a way, which contradicts their business model. Overall, the Glachant volume calls for changes in accounting rules, in
13
order to limit the prudential undervaluation of assets needed for long-term financing (mostly stocks and securitized assets) as well as the volatility of the whole balance sheet. The facts proved the authors of the 2010 volume to be true. As we have seen, from QIS5 on (2010), worsening market conditions led to rising SCR for life insurance companies so that many of them where no longer able to cover their SCR (Planchet Leroy 2012), as the LTGA ultimately shown (our table 2). The same authors diagnosed that the standard formula incentivized sovereign bonds against other instruments: this is another line of criticism.
B. Long-term financing and asset concentration
The distribution of investments of the insurance firms dramatically changed in the last ten years as Table 3 shows. Between 2005 and 201310, the relative weight of shares fell by
almost 50% (or 18 percentage points) while bonds, particularly sovereign securities, rose by a comparable amount: the private sector has been losing billions of potential funding to the states. Given the primary importance of the insurance sector in the funding channels of the EU economies, this could lead to severe consequences regarding the financing of long-term growth. Laas and Siegel (2015) have shown this tendency to be a direct result of the standard formula, which imposes far higher capital requirements on stocks than on sovereign debt, thus negating the benefits of the former excess return.
Table 3 – distribution of investments of EU insurance firms
2000 2005 2010 2011 2012 2013 Land and buildings 5,24% 4,2% 3,1% 3,1% 3,1% 3,4% Participating interests 3,80% 4,4% 6,3% 6,2% 7,9% 7,8% Shares and variable yield 36,72% 37,5% 31,0% 30,9% 21,0% 19,5% Debt securities and fixed-income 30,98% 35,7% 41,6% 41,8% 50,4% 52,4% Loans, including mortgages 16,36% 10,6% 10,7% 10,3% 13,2% 13,6% Deposits 1,07% 2,4% 2,5% 2,4% 1,3% 1,4% Other investments 5,84% 5,3% 4,8% 5,5% 3,0% 1,8%
Source: insurance Europe It seems difficult to disentangle the combined effects of a major financial crisis from the anticipation of S2 by the companies in order to form a definite opinion of the impact of
10 No satisfactory consolidated regional data exist beyond 2012 since the ECB and OECD statistics rely on
different typology (for instance, OECD statistics usually consider a significant share of ‘other’ investments which have to be broken down). The state-level data confirm that the 2012 level are still valid in 2015 for many countries.
the Directive on the financing of long-term growth, however Pradier and El Khalloufi in this volume (section 3) argue that regulatory uncertainty surrounding Basel III is detrimental to the funding of the EU economy by the banks; the same point could be made about S2 and the insurance companies. A more detailed look at some countries will show that the current structure of investment differs greatly from one EU country to another (table 4): Eastern and Latin Europe countries exhibit a very low relative weight for shares and conversely a large share of bonds; Scandinavian countries are just the reverse; the German insurers grant a large amount of loans, etc. One would hardly see a common pattern; hence the change might not be entirely attributable to S2, as S2 is supposed to imply convergence.
Table 4 – distribution of investment of insurance firms in selected countries (2013) `
Real Estate Mortgage Loans
Shares Bonds Loans, non-mortgage Other Investments Denmark 0,8% 0,0% 50,7% 40,2% 1,1% 7,2% Germany 1,8% 5,2% 5,8% 38,6% 18,9% 29,7% Hungary 2,0% 0,0% 1,9% 88,5% 0,1% 7,5% Portugal 2,3% 0,0% 2,6% 75,0% 0,0% 20,1% Sweden 3,0% 0,1% 35,6% 52,9% 1,1% 7,4% United Kingdom 3,9% 2,9% 16,6% 51,1% 1,6% 23,9%
Source : OECD insurance database, authors calculations Diversity across countries of the EU would avoid asset concentration, which has been shown in the banking sector (Blundell-Wignall and Atkinson 2012) to be responsible for the build-up of systemic risk. The level of asset concentration is notwithstanding high enough for the EIOPA to recently announce it will “monitor consistency and convergence of supervisory practices” relative to “the modelling of Sovereign Exposures” (EIOPA 2015). As the internal models are supposed to be approved by national supervisors, it shall be asked whether the difference in table 4 proceeds from national idiosyncrasies or from incentives provided by the National Competent Authorities (national supervisors). One possible explanation is that NCA in over indebted countries are especially lenient toward the holding of domestic sovereign debt by insurers. This raises questions about possible conflict of interest of national supervisors (an issue which will be discussed in section 4 below), for instance in assessing the need for regulatory action, now supposedly prompted by capital requirement thresholds.
C. Very low predictive power
In a risk-sensitive framework, the capital requirements of any firm are proportional to the level of risk it is facing, and the probability of a failure should rise with the capital gap. So far, many tests of the US prudential framework11 have been performed to assess
its predictive power. Cummins et al. (1999), for instance, tested on a large sample of
11 It should be recalled here that the law governing US insurance activity and supervision are enabled at
the state level. The National Association of Insurance Commissioners has nevertheless developed and sponsored a prudential framework known as “risk-based capital”, which has been passed into law in most states.
15
insurance companies whether the US Risk Based Capital (RBC) formula correctly predicted corporate failures and their results were disappointing: type I error (i. e. wrongly assessing a failing firm as solvent) as high as 89% (p. 442), which means that almost 9 out of 10 insolvency cases are not predicted. This figure can be diminished at the price of rising type II error (i. e. wrongly assessing a healthy firm as insolvent): for a 5% type II error, type I error ranges from 48% to 84% according to the year and the test in consideration while for a 20% type II error, type I is comprised between 18% and 52%. The lack of predictive power is a serious problem, since type I error means failures are not predicted and type II error means measures would be taken against healthy firms: in both case, the legitimacy of the supervisor is likely to be eroded.
Further advances have shown that prediction is in fact difficult for purely statistical reasons: Kartasheva and Traskin (2011) have shown that very low insolvency rates lead to low predictive accuracy. As the EU experienced far lower failure rates than the US, as can be seen in table 3, the predictive accuracy of the SCR/MCR, whatever their sophistication, is likely to be even lower than the often-criticized US RBC model. For comparison matter, failure rate was equal to zero for the whole 2008-2012 period in many EU countries, while 4.6% (2010) to 28% (2012) of companies where reputed amenable to “immediate and ultimate supervisory action” (DR 2015/35 art. 378-380). Type II error is then at 100% for countries without failures (and above 95% on average): this seems intolerably high after 5 years of calibration; moreover type I error is still undocumented in countries with failed firms.
Table 5 — fraction of total insurance sector’s liabilities in default
Percentage of world assets (2012) country 2008 2009 2010 2011 2012 2008-2012 27% United States 0.042% 0.006% 0.012% 0.013% 0.004% 0.0151% 24% Japan 0.078% 0.000% 0.000% 0.000% 0.000% 0.0147% 12% United Kingdom 0.000% 0.001% 0.000% 0.000% 0.001% 0.0002% 9% Germany 0.000% 0.000% 0.000% 0.000% 0.333% 0.0075% 5% France 0.000% 0.000% 0.000% 0.000% 0.000% 0.000% 3% Netherlands 0.000% 0.000% 0.000% 0.000% 0.000% 0.000% 3% Switzerland 0.000% 0.000% 0.000% 0.000% 0.000% 0.000% 3% Sweden 0.355% 0.002% 0.034% 0.056% 0.004% 0.0820% 2% Danemark 0.000% 0.000% 0.000% 0.000% 0.000% 0.000% 1% Ireland 0.000% 0.000% 0.867% 0.000% 0.000% 0.1613% 1% Italy 0.058% 0.012% 0.078% 0.017% 0.000% 0.0326% 1% Spain 0.000% 0.005% 0.056% 0.000% 0.009% 0.0155% 0% Belgium 0.000% 0.000% 0.000% 0.052% 0.000% 0.0102%
94% Global default rate 0.038% 0.002% 0.020% 0.006% 0.005% 0.0139%
Table 6 – number and rate of property-casualty insurance insolvencies per year Year 1990 1991 1992 1993 1994 1995 1996 1997 1998 1999 2000 Number of companies 1897 1968 2012 2061 2065 2084 2100 2096 2096 2042 1952 Number of failures 23 33 21 22 7 8 25 6 10 18 16 %failed 1.21 1.68 1.04 1.07 0.34 0.38 1.19 0.29 0.48 0.88 0.82
From Kartasheva et al. 2011 While statistical literature has emphasized the importance of using twin threshold (see for instance Lalkhen and McCluskey 2008), the only acceptable way to deal with the MCR/SCR should be to calibrate them more finely in order to guarantee that SCR (which triggers supervisory inquiry) will minimize type I error, which is obtained at the cost of very high type II error. Standard, low-cost procedures should be designed for further inquiry. On the contrary, MCR, which prompts immediate action, should be calibrated to minimize type I error under type II error constraint of, say 1 or 5%. These figures should be made public so that the supervisory procedures become easier to understand for the stakeholders.
*
The S2 package is a comprehensive legal reform package, which goes far beyond solvency, since it also features provision for consumer protection and aims above all at European integration. While the initial assessments of the microprudential incentives and the macroeconomic effects were enthusiastic, a protracted tuning process has shown, from 2010 on, a significant part of the insurance firms not to meet the capital requirements and, more generally, time has paved the way for criticism. The procyclicality issue has been reduced by the LTGA package, but S2 (as Basel II-III) still leads to asset concentration on sovereign debt, and the usefulness of crucial capital requirements to predict insurance firm failures seem unsatisfactory. One can argue that these are necessary costs to prevent regulatory arbitrage with the banking sector. Before we can judge on this matter, we should add the cost of systemic risk regulation to the equation.
4. Systemic risk regulation
Whether the insurance sector is subject or source of systemic risk is still in debate. While the Financial Stability Board (FSB) has concluded that it is (4.1.), a large body of evidence suggests it is not (4.2.). We shall then distinguish more precisely the type of insurance activity or products exhibiting systemic risk.
4.1. From academic evidence to enhanced supervision of GSII
In the wake of their landmark paper on financial contagion, Allen and Gale circulated in the early 2000’s a paper about “systemic risk and regulation”. They showed that “there is evidence that risk has been transferred from the banking sector to the insurance sector. One argument is that this is desirable and simply reflects diversification opportunities. Another is that it represents regulatory arbitrage and the concentration of risk that may result from this could increase systemic risk” (Allen Gale 2007 p. 342). Only months later, the US government had to rescue AIG in order to prevent a failure with possible
17
systemic implications. The subsequent IMF (2009) report clearly proved that the problems with AIG were entirely due to the sale of credit default swap together with securities lending, carried on by a London branch called AIG-Financial Products, which was clearly not active in the insurance business. Nevertheless, the report by the FSB at the November 2010 G20 Summit in Seoul insisted on the role of Systemically Important Financial Institutions (SIFI) in financial crisis and proposed to mitigate systemic risk by identifying such firms and taking appropriate measures. A list of Global Systemically Important Banks (G-SIB) has been published in November 2011 and updated every year, while for insurance the IAIS proposed a list of 9 G-SIIs in July 201312, which was
confirmed by the FSB in November 2014 (IAIS 2015) and updated in 201513.
Together with the listing of G-SIIs, a framework of policy measures was published (IAIS 2013). These measures include:
• Enhanced Supervision comprises both supplementary prudential requirements decided by national authorities and proper international coordination of supervisors. • Effective resolution of SIFIs in an orderly manner without destabilising the financial system and exposing the taxpayer to the risk of loss should be made possible for the supervisors.
• Higher Loss Absorbency capacity for GSIIs to reflect the greater risks that these institutions pose to the global financial system.
As of 2015, IAIS is still consulting the stakeholders to agree on what will be done precisely from 2019 on.
It should be emphasised that there has been a fierce opposition against the classification of insurance institutions as systemic.
4.2. The insurance business is not systemic
Since 2009, numerous authors have shown that the insurance business model is not systemic by design: the inverted production cycle allows to build up capital reserves before payments are due. Only non-traditional and non-insurance activities, as in the case of AIG, lead to systemic risk. Thimann (2015) reviewed the theoretical literature on this topic and offers a nice classification of insurance activities and as well as product and balance sheet management tools according to their systemic riskiness. For example, pure life annuities are typical insurance business (they rest on mortality table and the law of large numbers) while variable annuities with living benefits rely on the uncertain performance of financial instruments, hence they are systemic: as Baranoff 2015 has shown, most failures of large insurance companies are linked with interest rate risk (especially in Japan during the 2000’s). The aforementioned GSII are financial conglomerates (amenable to the FiCoD Directive), and their systemic riskiness does not come from their insurance business. Overall, it appears that the key issue is to distinguish which activities and products could really build up systemic risk, being clear that pure insurance business is not concerned: Thimann (2015) shows that current
12 These are: AIG, Allianz, (Assicurazioni) Generali, Aviva, Axa, MetLife, Ping An insurance, Prudential,
Prudential financial.
13 On the 15th of November 2015, the list became: Aegon NV, AIG, Allianz, Aviva, Axa, MetLife, Ping An
typologies are not entirely consistent in 2015. Further research seems then necessary in this area.
Very recently, empirical papers made contribution to the question. In particular, Bierth et al. 2015 has shown that “the insurance sector predominantly suffers from being exposed to systemic risk, rather than adding to the financial system’s fragility.” Very significantly, they added that “ our study reveals that both the systemic risk exposure and the contribution of international insurers were limited prior to the financial crisis with all measures of systemic risk increasing significantly during the crisis. In contrast to the banking sector, however, systemic risk in the insurance sector does not appear to lead but rather follow macroeconomic downturns as evidenced by our analysis.” While these results have to be confirmed, they add empirical evidence to the theoretical assertion that the bank metaphor could be misleading.
4.3. Is the bank metaphor fully justified?
The rationale for capital requirements for banks shall be recalled: banks create money by giving credit. They are thus subject to liquidity risk, which can be prevented by holding cash balances and having enough own funds to absorb losses. Moreover, the banks enjoy a high level of public concern, with both a deposit guarantee scheme (which prevents bank runs) and a lender of last resort (which provides the banks with liquidity). As beneficiaries of public spending, it seems obvious that they should be regulated. Not only do the bank benefit from public spending, they also have invisible costs for the society: an implicit subsidy, which is more or less the difference between what they should pay to borrow at the cost incurred by their credit rating and what they do with an implicit state support that will not let them fail (Hoenig 2014). The reason why the state will not let the large bank fail is simply their systemic relevance. Overall, TBTF or systemic banks rely on hypothetic or probable public support: they should accept some regulation in exchange. Basically, capital requirement lessen the probability of their failure and can so be used to diminish the moral hazard, which grows with their systemic significance. For the insurance firms, the picture is quite different: at any rate, the expected cost of bailout for an insurance company is small as the probability appears minimal; the liabilities side of the balance sheet is only marginally borrowed, hence a minimal implicit subsidy; insurance company do not have access to the lender of last resort (such access qualifies a bank in most jurisdictions) and the insurance liabilities are not guaranteed by a public insurance scheme in the EU (and nothing such is planned albeit there has been a white paper see EC 2010). Overall, the dependence of insurance on possible public spending is far less than for the banking institutions. And, very significantly, it does not seem necessary to pile up own funds to start an insurance business, as payment is made by the customer upfront, while a borrower must repay the bank for months or years before the bank gets its money back. Hence correctly priced insurance contracts should not consume own funds, and the prime motive for supervision is simply to check whether the pricing of contracts covers the expenses.
It seems then very legitimate to ask whether the whole project of convergence with banking regulation is healthy. While it makes some sense to impose on the insurers the same kind of constraints the banks experience in order to guarantee that the insurers
19
will not host clandestine banking operations, it does not necessarily make sense to impose the same set of constraints to true insurance business. The aforementioned supervisor tendency to assume every company to act in contradiction with the business model of insurance (§ 3.3.A) adds up to the idea that insurance regulation the way it is brought by the S2 framework is, unless appropriately proved, not optimal and must thus have social costs, which were not appropriately accounted for in the preliminary impact assessment. What can be said about this?
5. From private to social costs
It appears now that all the costs of the S2 reform have not been taken into account. We try to list (5.1.) and assess (5.2) theses costs before thinking of the consequences (5.3.)
5.1. How many costs?
So far, we have mentioned many cost sources, which are amenable to categorization. Impact studies usually distinguish between the direct cost of regulation (i. e. funding of regulatory authorities through taxes) from indirect costs, featuring a one-off cost of implementation of the reform (a project team should be setup in order to meet the new supervisory expectation, IT systems were most often in need of a revamp, etc.) and recurring cost of compliance (additional capital and reporting requirements). In the case of S2, the literature has taken into account administrative costs, but costs of additional regulatory capital (as S2 commands more costly capital than the current framework) for instance, or cost of asset concentration (since sovereign bonds have a lower return than stocks, especially in conjunction with OECD-wide Quantitative Easing) should have been reviewed.
It should even be noticed that, while impact studies usually consider the cost of optimally working regulation, the process of fine tuning S2 through the QIS is still far away from this ideal state. Chneiweiss and Schnunt 2015 recently argued that the distribution of power among authorities has not yet reached an equilibrium point, on the contrary they give many examples for what they call “competition between authorities […] to take an ever larger share of the market regulation.” With a more theoretical approach, Plantin and Rochet 2007 concluded their remarkable book with a warning that “public regulators might aim to expand the scope of their mission in order to increase their resources.” A few examples will show how the legal innovation of the past years opened many avenues for coordination problems, both inside member states of EU and in relation between local and regional authorities.
Inside member states, interesting cases of competition between authorities involve for instance:
• Double jeopardy – The European Court of Human Rights (EHCR 2014) recently settled the Grande Stevens vs. Italy case condemning Italy for various procedural offences as well as a double punishment in the same case. The plaintiff has been imposed an administrative sanction by CONSOB (Italy financial market regulator) together with a sentence by a criminal court; this contradicts a legal principle since the Roman Republic: non bis in idem.
• Insufficient legal provision – The French Conseil Constitutionnel (2015) ruled against the national supervisor (ACPR), which transferred for solvency reasons an
insurance company’s portfolio to another company: the French Code monétaire et financier was ruled unconstitutional, violating property right, as the plaintiff was not given the opportunity to find a buyer for his portfolio.
As to what regards the relation between the national and regional authorities, there has been a clear distribution of powers in the banking sector with first the Eurosystem and then the banking union. In the insurance sector, EIOPA is producing standards and recommendations according to the Lamfalussy process, but also opinions, which might contradict the ACPR instructions (8 such texts about insurance have been produced between 2010 and 2015 without a clear legal status, see Thourot 2015). Another example is the interpretation of the insurance Directives: we already mentioned in §3.3.A. how the 1-year VaR was interpreted in the most counterproductive way; today there are some worries on the implementation of the “fit and proper” condition as part of the Pillar 2. As the IMF assessment of observance of the ICP has shown the French regulator was too lenient on the suitability of persons, there seem to be room for “setting an example”, especially with the administrators of (small) mutual insurances societies. ACPR first held that the chairman of the board could not be counted as executive director, since 2015, it holds to a ‘one-size-fits-all’ approach to ‘properness’, in contradiction with ICP2.5: “the supervisor applies [requirements and procedures] consistently and equitably, taking into account the nature, scale and complexity of insurers”. It seems fairly obvious now that some member states’ regulators (e. g. Ireland and Luxemburg) adopted a more relaxed and business friendly stance than some others’; different interpretation from country to country would mean different costs to the companies, this is then a case of regulatory arbitrage among jurisdictions.
Regulatory arbitrage incurs social costs, as it leads to capital misallocation and above all increased risks, hence larger probability of a larger financial crisis. Among other social costs, one can think that larger capital requirements raise the demand for capital, which could cause crowding out effect (although probably not in the same amount as Basel III, Oliveira Santos-Elliott 2012). While crowding out has been prevented by years of relaxed monetary policy, regulatory arbitrage is precisely what S2 was aiming to destroy: albeit there can still be competition among authorities as illustrated by Chneiweiss and Schnunt 2015, risk transfer from banking to insurance seems under control, as Laas and Siegel 2015 have shown that it is usually more costly (in terms of regulatory capital) to hold assets under S2 than under B3. One could be tempted to think, then, that the current European regulatory framework is successful at controlling social costs at the expense of the insurance sector. The next section elaborates on this idea to compute the cost to the insurance sector.
5.2. The cost to the insurance sector (see also Appendix 2)
While some preliminary impact studies made some significant contributions to the computation of the regulatory costs, it should be made clear that the costs and their effects were considerably underestimated, both at sector-wide and individual firm level.
A. Sector-wide costs
From QIS4 on, the preliminary impact studies have computed the overall surplus, that is to say, the difference between the excess regulatory capital in the whole insurance sector
21
under solvency 2 minus the same under solvency 1. While this overall surplus provides an indicator of the sector’s health, it has no practical meaning for cost computation since it gives no information about the distribution of shortage (which implies effective costs) among companies. Under the vague assumption of conserving the same level of overall surplus with a mean cost of capital (see table 2), QIS5 would imply €10bn additional cost of capital per year, but this figure is extremely variable from one QIS to another, and sensitive to the distribution of surplus/shortfalls.
While it could be computed straightforwardly (national supervisors publish detailed reports), the direct cost of regulation is rarely mentioned since supervisors usually argue their mandate is country-specific. Eling and Kilgus (2014) produced a notable breakthrough by computing the cost of supervision per employee in the financial sector in Austria, Germany and Switzerland. In order to expand the comparison, we performed additional computation for France and UK. The results appear in Table 6.
Table 6 – Cost of supervision in € per employee in the financial sector in 2012
AT CH DE FR UK
467,07 593,62 231,45 222,30 645,07
2014: 334,2* 244,71**
France and Germany seem to enjoy the same cost per employee, while the financial centres of UK and Switzerland are on a higher basis, with Austria somewhere in between. Nevertheless, it should be emphasized that the data for UK were taken before the split of the FSA into PRA and FCA. The budget of the Prudential Regulation Authority alone, which is closer to the current definition of ACPR and BaFin, is of the same order of magnitude (**), while Financial Conduct Authority has a larger budget. Evolutions should be taken into account: for instance FSA/FCA+PRA had the strongest growth since 2008 with a budget doubling; in France the tax on insurance was raised sharply in 2013, hence the cost of regulation per employee in the insurance sector is 50% above the average cost per employee in the overall financial sector (*). While a comparative appraisal of the value-for-money of regulation remains to be done, there is much room for European harmonization… and regulatory arbitrage.
B. Individual level costs
Preliminary impact studies focused on administrative costs (linked to reporting and governance requirements of pillars 2 and 3 in S2): CEIOPS (2007 p. 16) counted 2.7 billion overall for the whole EU27, or €40,000 for each insurance company, on the basis of 2 months equivalent full time job for each of the four “key functions”. A report by the Centre d’Etude des Assurances on the very same year (CEA 2007 p. 22) counted twice as much overall, while in 2011 Ernst and Young estimated with the FSA that the figure was close to £1.8bn (=€2.3bn) for UK alone, accounting for one fifth of the European insurance market. The implementation costs have then been multiplied by 5 at least between 2007 and 2011, and they continue to grow with every new QIS, with the recurring cost of compliance still difficult to assess. The only certainty about these recurring costs is that the 4 x 2 months-persons are insufficient to staff the key functions and fulfil the reporting obligations: Chneiweiss and Schnunt 2015 lists the 21 reports to
be prepared annually for the stakeholders (including the supervisors) and reviewed by board members. Administrative costs thus appear as non-negligible fixed costs, which must be added to the legal uncertainties reviewed in 5.1. and, rather unexpectedly, to regulatory capital-linked fixed costs.
Regulatory capital as it appears in pillar 1 of the S2 reform, is supposedly risk-based, it should then be treated as a variable cost. Nevertheless, the Quantitative Impact Studies (from QIS5 on) have shown that the internal models were able to save considerable amount of capital14. More precisely, they benefited more to large insurance companies
than to medium and small ones, as the following table demonstrates:
Table 7 – solvency global surplus and internal models Insurance
company type S1 Surplus S2 Surplus / Standard formula S2 Surplus / Internal model
Large 109,4 54,6 129,5
Medium 26,7 15,5 18,3
Small 64,3 43,6 49,5
Source: CEIOPS 2010 p. 136 While the standard formula leads the large companies to halving their overall surplus, internal models allow them to boost their surplus by 137% and look better under S2. The boost is less than 20% for both medium and small companies, which cannot reclaim under S2 the surplus level they have under S1. Internal models thus appear as an investment: they are costly to develop but can save regulatory capital and lower the mean cost of capital, since firms with better solvency experience better financial rating and lower funding costs. A very productive investment, since they save the large companies more than seventy billion of euros (hence at 10% WACC, which was the working assumption of QIS5, close to seven billion a year). While it seems obvious that the largest companies need more complex model, there is still a minimum cost to these internal models, which make them look like fixed costs.
The discussion of implementation and compliance cost might seem trifling in comparison with what has been lost on investments in crisis-stricken countries or with potential losses in life insurance when interest rates will revert to their normal level. Trifling at the industry level, but more or less of the nature of fixed costs (larger insurers had larger project teams but some of them prepared internal models to save regulatory capital), hence they weigh far more on small businesses and must lead to concentration.
5.3. From costs to concentration and uniformization
The preceding section has argued that most recent reforms, whether prudential (such as S2) or consumer oriented has been basically adding to fixed costs, thus promoting
14 More recently, Picagne and Tam (2016) have shown that the definition of capital was broadened during
the S2 maturing process, with additional categories (such as Deferred Tax Assets) being added under the pressure of companies to achieve more easily the requirement threshold. This analysis marginally lowers the overall cost of S2 without changing the argument in this section (on the contrary, these authors show that new capital categories were included as a consequence of efficient lobbying by larger insurance companies).