HAL Id: hal-01045056
https://hal-cstb.archives-ouvertes.fr/hal-01045056
Submitted on 24 Jul 2014HAL is a multi-disciplinary open access archive for the deposit and dissemination of sci-entific research documents, whether they are pub-lished or not. The documents may come from teaching and research institutions in France or abroad, or from public or private research centers.
L’archive ouverte pluridisciplinaire HAL, est destinée au dépôt et à la diffusion de documents scientifiques de niveau recherche, publiés ou non, émanant des établissements d’enseignement et de recherche français ou étrangers, des laboratoires publics ou privés.
CSTB - Projet Environnement et ambiances : effet des
basses fréquences sur le confort acoustique - tests
psychoacoustiques
S. Bailhache, J. Jagla, C. Guigou
To cite this version:
S. Bailhache, J. Jagla, C. Guigou. CSTB - Projet Environnement et ambiances : effet des basses fréquences sur le confort acoustique - tests psychoacoustiques. 2014. �hal-01045056�
Usages Santé Confort
Environnement et Ambiances
Effet des basses fréquences sur le confort
acoustique – Tests psychoacoustiques
Rapport final
BAILHACHE Simon JAGLA Jan
GUIGOU-CARTER Catherine
Usages Santé Confort
Environnement et Ambiances
Effet des basses fréquences sur le confort
acoustique – Tests psychoacoustiques
Rapport final
BAILHACHE Simon JAGLA Jan
GUIGOU-CARTER Catherine
Université Paris-Est, Centre Scientifique et Technique du Bâtiment, Direction Santé Confort, Division Acoustique et Vibrations des Bâtiments
Février 2014
4/49
Rapport de recherche n° [répeter la réf insérée en bas de la p. 3 ou supprimer la mention]
© 2014 CSTB
Ce texte est distribué sous les termes de la licence Creative Commons Attribution 3.0 non transposé (CC BY 3.0)
Le texte complet de la licence est disponible à l’adresse suivante : http://creativecommons.org/licenses/by/3.0/legalcode
Résumé des droits et conditions de la licence : Vous êtes libre de :
partager (reproduire, distribuer et communiquer) l’œuvre ; remixer, adapter l’œuvre ;
d’utiliser cette œuvre à des fins commerciales. Selon les conditions suivantes :
Attribution (paternité, crédit) : vous devez attribuer l’œuvre de la manière indiquée par l’auteur de l’œuvre ou le titulaire des droits (mais pas d’une manière qui suggérerait qu’ils vous approuvent, vous ou votre utilisation de l’œuvre).
Toute citation d’extraits, reproduction ou utilisation doit obligatoirement faire apparaitre la référence de ce document sous la forme : Bailhache, S., Jagla,
J., Guigou-Carter, C., Environnemment et Ambiances – Effet des
basses fréquences sur le confort acoustique – Tests
psychoacoustiques, CSTB, Février 2014, 49 pages [Rapport USC-EA-D1_A2.1.4_2]
Comprenant bien que :
les droits suivants ne sont en aucune manière affectés par la licence : Vos prérogatives issues des exceptions et limitations aux droits exclusifs
ou fair use ;
Les droits moraux de l’auteur que rien dans ce contrat ne diminue ou ne restreint.
A chaque réutilisation ou distribution de cette œuvre, vous devez faire apparaître clairement au public la licence selon laquelle elle est mise à disposition. La meilleure manière de l’indiquer est un lien vers cette page web : http://creativecommons.org/licenses/by/3.0/deed.fr.
5/49
Rapport de recherche n° USC-EA-D1_A2.1.4_2
Résumé
Aux niveaux européen et international, des propositions d’harmonisation des indices de performance acoustique des bâtiments sont actuellement à l’étude (projets de normes ISO 16717-1 et -2). Dans ce contexte, des questions ont notamment été soulevées sur le choix de ces indices et sur la prise en compte dans leur calcul des basses fréquences (tiers d’octave 50, 63 et 80 Hz). Afin d’évaluer la pertinence de différents indices existants, des tests d’écoute sont menés sur un panel d’une vingtaine de personnes. Des extraits sonores sont préparés sur la base d’une modélisation de la transmission à travers différents types de façades et de cloisons du bruit généré par des sources extérieures ou intérieures au bâtiment. La gêne provoquée par ces extraits est évaluée et corrélée aux différents indices de performance. Les résultats semblent indiquer que les nouveaux indices proposés ne sont pas mieux adaptés pour représenter la gêne.
Mots clés : indices de performance acoustique ; basses fréquences ; confort ; evaluation subjective.
Abstract
At the european and international levels, proposals to harmonize building acoustic performance indices are currently under study (ISO 16717-1 and -2 projects). In this context, questions have been raised concerning the choice of these indices as well as the integration of low frequencies theses indices calculation (third octave bands 50, 63 and 80 Hz). In order to assess the relevance of different existing indices, listening tests are carried on a panel of more than twenty participants. Sound samples are prepared by modelling the transmission of noise through different types of façade walls or separating walls or floors, for typical noise sources outside or inside the building. Annoyance is then rated and correlated to performance indices. Results tend to show that the new proposals of indices are not better suited to evaluate annoyance.
Keywords: acoustic performance indices ; low frequencies ; comfort ; subjective assessment.
6/49
Rapport de recherche n° USC-EA-D1_A2.1.4_2
Résumé long
Aux niveaux européen et international, des propositions d’harmonisation des indices de performance acoustique des bâtiments sont actuellement à l’étude (projets de normes ISO 16717-1 et -2). Dans ce contexte, des questions ont notamment été soulevées sur le choix de ces indices et sur la prise en compte dans leur calcul des basses fréquences (tiers d’octave 50, 63 et 80 Hz). Les laboratoires et institutions impliquées dans la normalisation en acoustique du bâtiment au niveau français ont décidé de travailler ensemble afin d’évaluer la pertinence des indicateurs proposés par l’ISO et éventuellement d’en proposer de nouveaux. En effet, la définition de nouveaux indices acoustiques doit permettre d’évaluer de façon plus fidèle le confort pour les occupants des bâtiments.
Les travaux présentés dans ce rapport s’attachent à caractériser, par le biais de tests d’écoute, la relation entre différents indices de performance acoustique et le ressenti des occupants dans les bâtiments d’habitation. Des sources de bruit aérien présentes à l’extérieur et à l’intérieur du bâtiment sont sélectionnées de façon à représenter les principales sources de plaintes des habitants, mais aussi de manière à ce que leur contenu fréquentiel soit différent. Des extraits sonores sont préparés sur la base d’une modélisation de la transmission à travers différents types de façades et de cloisons ou planchers séparatifs représentatifs des systèmes couramment utilisés. Les participants aux tests doivent alors associer à chaque extrait une note sur une échelle de gêne. Les résultats de ces tests menés sur un panel d’une vingtaine de personnes sont présentés et commentés.
Les résultats obtenus tendent à montrer que la prise en compte des basses fréquences ne permet pas d’obtenir une meilleure corrélation entre les indices de performance acoustique et la gêne des occupants des bâtiments vis-à-vis des bruits aériens. Néanmoins, des tests complémentaires doivent encore être menés afin de valider la méthodologie. Une fois les sources de biais potentielles écartées, ce type de tests pourrait être étendu aux bruits d’impact.
7/49
Rapport de recherche n° USC-EA-D1_A2.1.4_2
Table des matières
INTRODUCTION ... 9 1.CONTEXT ... 10 1.1ISO 16717 proposals ... 10 1.1.1 Air-borne noise ... 10 1.1.2 Impact sound ... 10 1.2Previous studies ... 11
1.3Link to the on-going ACOUBOIS project ... 13
2.DESCRIPTION OF THE TEST METHOD ... 15
2.1General principle ... 15
2.2Test design ... 15
2.3Experimental setup ... 15
2.3.1 Procedure ... 15
2.3.2 Stimuli presentation and rating ... 16
2.4Production of the audio stimuli ... 16
2.4.1 Filtering ... 16
2.4.2 Sound reproduction ... 17
2.5Participants ... 17
2.6Results post-processing ... 18
3.DESCRIPTORS UNDER STUDY ... 19
3.1Descriptors used by the French acoustic regulation ... 19
3.2New proposals ... 19
3.3Other descriptors ... 19
4.LISTENING TESTS ON INDOOR AIRBORNE NOISE ... 21
4.1Selected sound sources and level setting ... 21
4.2Selected separating walls and floors ... 22
4.3Results ... 24
5.LISTENING TESTS ON OUTDOOR AIRBORNE NOISE ... 27
5.1Selected sound sources and level setting ... 27
5.2Selected façade walls ... 28
5.3Results ... 30
5.4Additional tests ... 33
CONCLUSION ... 35
REFERENCES ... 36
ANNEXES ... 38
ANNEXE 1:PICTURES OF THE TEST ROOM ... 39
ANNEXE 2:QUESTIONNAIRE AND INSTRUCTIONS GIVEN TO THE TEST PARTICIPANTS ... 40
ANNEXE 3:GRAPHICAL USER INTERFACE DEVELOPED FOR THE LISTENING TESTS ... 41
8/49
Rapport de recherche n° USC-EA-D1_A2.1.4_2
Liste des tableaux
Table 1: Overall responses to the questionnaire ...18
Table 2: Selected sources of interior noise ...21
Table 3: Selected separating elements ...22
Table 4: Single Number Ratings of the selected separating elements ...23
Table 5: Correlation coefficients (R) between performance descriptors and annoyance – Interior noise ...26
Table 6: Selected sources of exterior noise ...27
Table 7: Selected façade walls ...29
Table 8: Single Number Ratings of the selected façade walls ...30
Table 9: Correlation coefficients (R) between performance descriptors and annoyance – Exterior noise ...32
Table 10: Correlation coefficients (R) between performance descriptors and annoyance – Exterior noise (additional tests) ...34
Liste des figures Figure 1: Calibration result for one of the sound stimuli ...17
Figure 2: Age and gender distribution of the test panel ...18
Figure 3: Frequency weightings used to calculate single number descriptors ...20
Figure 4: Emission spectra of the selected interior noise sources ...22
Figure 5: Acoustic performance of the selected separating walls and floors ...23
Figure 6: Separating elements classified by average annoyance ...24
Figure 7: Relationship between performance descriptors and average annoyance - Interior noise (all sources) ...25
Figure 8: Emission spectra of the selected exterior noise sources ...28
Figure 9: Description of the lightweight façade element ...28
Figure 10: Acoustic performance of the selected façade walls ...29
Figure 11: Façade walls classified by average annoyance ...31
Figure 12: Relationship between performance descriptors and average annoyance - Exterior noise (all sources) ...32
Figure 13: Relationship between performance descriptors and average annoyance - Exterior noise (all sources; additional tests) ...33
9/49
Rapport de recherche n° USC-EA-D1_A2.1.4_2
INTRODUCTION
In the context of new ISO standard drafts for evaluating acoustic performance indices (ISO 16717-1 and -2 projects), questions have been raised concerning the choice of these indices as well as the integration of the low frequencies in theses indices calculation. In order to assess the compliance of the ISO 16717 drafts to the European needs, the European technical committee CEN/TC 126 has launched applicability studies in October 2012 concerning airborne sound insulation related to external noise, airborne sound insulation related to internal noise and impact sound insulation. French acoustic laboratories and institutions involved in building acoustics standardization have decided to work together in order to investigate the relevance of the ISO proposed indicators and eventually suggest new ones. The goal in defining new acoustic indices is indeed to more closely evaluate building occupants comfort.
The work conducted concerns mostly extended listening tests. Noise sources from outside and inside a building are chosen so they correspond to those for which inhabitants mostly complain, but also so that their frequency spectrum is different. Representative façades including windows, separating walls and floors with their usual complements (linings, floor coverings, etc…) are selected. Listening sequences are then prepared for different levels of the different noise sources and the different building components (only direct transmission is considered). Listening tests are performed on about 25 persons of different ages and backgrounds.
Preliminary results of this work were presented at the Inter-Noise congress held in Innsbruck, Austria, in September 2013 [1]. Extended results and more details about the methodology are given in this report.
10/49
Rapport de recherche n° USC-EA-D1_A2.1.4_2
1. CONTEXT
1.1 ISO 16717 PROPOSALS
The ISO/CD 16717 drafts are briefly discussed in this section with the different advantages and disadvantages that have already been pointed out. It should be stressed that converting a measured frequency dependent data to a single number rating corroborating acoustic comfort or annoyance due to different types of noise either outdoor or in a neighboring apartment is quite a challenge. No perfect rating system valid for all building situation and noise types can be expected. The single number rating proposed in ISO/CD 16717-1 and ISO/NP 16717-2 drafts is based as previous ratings on a spectral approach with different reference adaptation spectra, but integrating frequencies below 100 Hz. The background for the proposed changes in ISO 717 standards is presented in [2]. 1.1.1 AIR-BORNE NOISE
Two different noise types are distinguished: outdoor traffic noise and noise from neighbor. In the draft standard ISO/CD 16717, two descriptors are proposed to deal with these noise types: Rtraffic and Rliving. Their definitions are given in section
3.2.
Remark: the two proposed indices, even if their name is new, are based on already existent index combinations (RW+C or RW+Ctr) except that the frequency
range starting at 50 Hz is made mandatory for laboratory results (instead of optional previously) and optional for in-situ measurements (depending on acoustic regulation in each country). The addition of the low frequency range (third octave 50 to 80 Hz) followed the conclusions of the study on subjective evaluation of noise from neighbors carried by Mortensen in 1999 [3].
At first, a third descriptor Rspeech was proposed for speech noise (for privacy
reasons). It has howerver been withdrawn from the draft standard. 1.1.2 IMPACT SOUND
The proposed change for rating impact noise is much deeper, since a new impact sound reduction index is defined. A major reason for this proposed change is that this new index Rimpact now increases (instead of decreasing for the presently used
index Ln,w or Ln,w+CI) when acoustic performance with respect to impact
increases [4]. However, the choice for the reference spectra to evaluate the new index Rimpact allows obtaining a simple expression between the old and new
indices ) ( 104 , ,502500 nw I impact L C R (1)
The adaptation term CI,50-2500 is included to take into account the annoyance at
low frequencies following recommendations from [3].
It should be mentioned that one advantage of using sound reduction index is that it is presumably independent of the noise source. For example, to create listening stimuli in a reception room the noise source located in an emission
11/49
Rapport de recherche n° USC-EA-D1_A2.1.4_2
room can simply be filtered with the sound reduction index. However, for the proposed impact sound reduction index, this is not the case since it is still fully dependent on the impact source being the tapping machine. There is still no easy way to apply different impact sources (such as walking person or jumping children) with this proposed impact sound reduction index. Therefore, its interest appears to remain up to now quite limited.
1.2 PREVIOUS STUDIES
Listening tests have been already performed in order to evaluate the advantage or disadvantage of different ratings with respect to noise annoyance; the most recent and closely related to the proposed new ratings have been carried out at KUL in Belgium [5] and NRC in Canada [6].
In [5], two different walls (lightweight gypsum boards partition wall and masonry wall) having the same single value rating Rliving but different sound insulation
spectra R were considered with 64 different typical “living room noises”. The stimuli with duration of 5 to 10 seconds were presented in pairs via headphones; the listening subjects were asked to indicate the louder stimuli for each pair. The results indicated that proposed “living noise rating” did not adequately correspond with perception due to an overestimation of the importance of low frequencies for sound at low intensities. Masking effects were not taken into account. The tests were carried out in an anechoic chamber, which obviously cannot represent a realistic situation such as being at home.
In [6], a number of 12 different spectrum weightings are considered for possible inclusion in the new ISO/CD 16717-1 standard. The 12 spectrum weightings were evaluated using previously acquired data consisting of annoyance ratings of speech and music sounds modified to represent transmission through 20 different walls with a wide range of sound transmission characteristics. Subjects rated the annoyance of each sound on a 7-point scale from 1 for “Not at all annoying” to 7 for “Extremely annoying”; the stimuli was produced by a loudspeaker system located 2 m in front of them and hidden behind a curtain. A background noise level of 35 dB(A) simulating a ventilation type noise was also produced in the listening room. The results showed that many of the spectrum weightings led to similarly accurate predictors of the annoyance due to transmitted music sounds and suggested that only a relatively small number of spectrum weightings could be justified. Based on these new analyses, 3 spectrum weightings were recommended for inclusion in the ISO/CD 16717-1 standard: living, traffic and a new improved speech spectrum weighting. It should be pointed out, the living spectrum weighting is equal to the already existing C50-5000 weighting, and is a very close approximation to the standard
A-weighting.
From these two studies, it was believed that more listening tests could be performed to include different types of sound sources and to use commonly found French building elements (wall, floors, etc…). Furthermore, the listening tests were concerned with airborne noise; however, impact noise is also of interest since it is often a source of annoyance and the new proposed rating should also be evaluated.
12/49
Rapport de recherche n° USC-EA-D1_A2.1.4_2
Concerning impact noise, Bodlund [7] proposed an alternative reference curve for evaluation of impact sound insulation between dwellings based on a survey comprising measurements and interviews with tenants in eight housing areas. This work concluded that a straight curve with a positive slope of 1 dB per third octave band starting at 50 Hz and terminating at 1000 Hz was a very good alternative for a reference curve, while keeping the standard tapping machine as the sound source. A comparison of methods for rating the insulation of floors against impact sounds was performed in 1998 by BRE and CSTB [8]. Recording were obtained for four different floors, without and with two different floor coverings (plastic flooring and carpet), under two types of excitation: a modified tapping machine to simulate woman walking and a sand bag to simulate children jumping. The levels of statistical significance attained did not allow a firm recommendation. However, the results were consistent with those obtained by Bodlund [7] in terms of extending the frequency range down to 50 Hz and using a straight line of slope 3 dB per octave as a reference curve. The Dutch method was found to be the most satisfactory; the dB(A) method was also found better performing than the ISO method even though it was poor at relating physical and subjective rating of bare floors. In 1999, a study from Lundt university [9] demonstrated through listening tests using the standard tapping machine as exciter the loudness measured according to ISO 532B was better correlated to the subjective impression of the impact sound than the commonly used weighted value Ln,w; high correlation coefficients ware also obtained for the Bodlund index
and Leq,A,F. Further analysis [10] based one new data (in-situ measurements and
tenants interviews) as well as some of Bodlund’s data, combining hollow and solid concrete based and lightweight floors, resulted in a new proposal for reference curve. It was also demonstrated that if low frequencies have to be taken into account to a greater extent, high frequencies must also be considered so as to prevent the future adoption of heavy floor structures with hard floor coverings. An objective and subjective assessment of lightweight wood-framed floor assemblies was performed at NRC [11]. The stimuli were recorded in the laboratory and played back for the tests. They were presented by pairs and the test participants were asked to rate one sound with respect to the other one which was always the same for a given test, on a 1 to 9 scale (much less annoying to much more annoying). The results obtained with the Japanese impact ball were more highly correlated with subjective judgments. However, the results using the standard tapping machine and index that include the spectrum adaptation term CI,50-2500, give the highest correlations for both types of impact
sounds. This supports similar conclusions offered in [12], which included only objective analyses, but of a wider range of assemblies, and included walkers wearing shoes, as well as those presented in [3].
In 2011, a resident’s survey (using questionnaire proposed by COST Action TU0901 [14]) and field measurements in apartment buildings was carried out in Sweden [13]; buildings were either with concrete floors and walls or with timber joist floors and walls. The results from these surveys were amended by data from previous studies to search for correlations between subjective ratings (by residents) and objective measurement results. A reasonable correlation was found between ratings and the calculated and/or the measured normalized impact sound pressure level L’n,w+CI,50-2500. However, for airborne sound
13/49
Rapport de recherche n° USC-EA-D1_A2.1.4_2
Through the COST Action TU0901 [14][1], descriptors for the acoustic performance of buildings have also been proposed: DnT,50 = DnT,w+C50-5000 for
airborne sound insulation, LnT,50 = LnT,w+C50-5000 for impact sound insulation and
D2m,nT,50 = D2m,nT,w+C50-5000 or D2m,nT,w+C50-31500 depending on type of outdoor
noise for façade sound insulation. The proposed descriptors are standardized with respect to reverberation time; however the reference reverberation time of 0.5 s might not be representative at low frequencies.
Ratings method is necessary to reduce the complex spectra of insulation against airborne or impact sounds to a more convenient single figure index. The test of a good rating method is how well the resulting indices are correlated with subjective assessments of the insulation. From the short review of previous studies it can be seen that this is a difficult task. First of all, the building practice (type of walls and floors) are quite different in the European countries and even more throughout the ISO involved countries; thus it is questionable that “the perfect rating” can be found. Nevertheless, it appears that acoustic ratings could be improved; this however requires compromises and changes in building practice and regulation.
It should also be mentioned than a very large investigation, regarding on airborne sound insulation and impact sound insulation and the perception of external sounds in respect with the sound insulation performance between the source and the listener, has been undertaken in Finland. Preliminary results have been presented at the Internoise 2013 conference [15].
In parallel, a laboratory experiment was also conducted in Finland using listening tests to evaluate the correlation between single number quantities and disturbance perceived at home [16]. Sound stimuli were produced from recordings of representative sources of interior noise filtered with the sound reduction index of a selection of commonly used partition walls (measured down to 50 Hz). Six different noise sources and nine different walls were considered. Only direct transmission was accounted for. From the results of this work, the inclusion of low frequencies in the new single number quantity Rliving was not
recommended.
The French work program as presented in this report introduction will then just be a complement to these already conducted studies.
However, from the majority of the already conducted studies the proposed changes in rating methods in ISO/CD 16717 drafts by including the adaptation terms down to 50 Hz do not appear out of sense and not much different from what already exists, except for the impact sound insulation.
1.3 LINK TO THE ON-GOING ACOUBOIS PROJECT
The French ACOUBOIS project with CSTB, FCBA and QUALITEL-CERQUAL as partners has been launched in 2010. The main goal of the project is to provide a prediction method for evaluating acoustic performance of lightweight buildings at the conception stage and as well as a database for acoustic performance of lightweight elements (wall, floor, façade and roof) fulfilling actual regulations (thermal, fire, humidity, etc....) for frequency range from 50 to 5000 Hz. In
14/49
Rapport de recherche n° USC-EA-D1_A2.1.4_2
order to test and validate the prediction method, in-situ acoustic measurements on about 30 different buildings should be performed, including airborne and impact sound insulation as well as service equipment noise. To further evaluate the discomfort sometimes reported in residential multi-family lightweight buildings, measurements of low frequency impact sound with a heavy soft rubber ball representative of jumping children are also included. Resident survey by face-to-face interviews based on questionnaire adapted from the one proposed by COST Action TU0901 [14] is also realized on ten different apartment buildings where acoustic measurements have been performed. This will hopefully help correlating acoustic indices from actual measurements and occupants perception. Acoustic measurements and resident surveys will also be implemented on some concrete based most common type French buildings in order to complete the picture. Most of these results should be available by the end of the year. It should be however stressed that since neither the building nor the residents were sampled in a statistical point of view, it will not be possible to interpret the results from these in-situ surveys as fully representative of multifamily buildings in France.
It is expected that from the results of these different underway studies, a common position for the French acoustic experts involved in the French Building Acoustics standardization committee can be reached; this common position could end up in proposals for amendment and modification of the proposed standard drafts.
15/49
Rapport de recherche n° USC-EA-D1_A2.1.4_2
2. DESCRIPTION OF THE TEST METHOD
In this section, the listening test experiments are described and details about the methodology are given.
Lots of different types of listening tests can be found in the literature, each one having its advantages and drawbacks. The method used in this study is strongly inspired from the work by Hongisto et al. in Finland [16].
2.1 GENERAL PRINCIPLE
The present listening tests aim at evaluating the correlation between various acoustic performance descriptors and the annoyance felt by building occupants when they are exposed to noise produced by their neighbors or by other sources outside the building.
For that purpose, audio stimuli are produced by filtering recorded sound samples with the transmission characteristic of different building elements, i.e. façades or separating walls and floors. The assumption is made that only direct transmission occurs. Different noise sources are considered for both interior and exterior noise. Noise sources are selected in a way that they are representative of sources encounterd in daily life and that their frequency content is different. Participants have to listen to the audio stimuli while imagining themselves to be at home, and rate them on an annoyance scale. Then a statistical analysis is performed to establish the relationship between the ratings given and the acoustic performance of the building elements considered.
2.2 TEST DESIGN
2.3 EXPERIMENTAL SETUP
The listening tests take place in a quiet room furnished like a living room with a reverberation time of about 0.5 s. The listening subject is comfortably sitting in front of a portable computer equipped with a mouse (see pictures in Annexe 1). The audio stimuli are played by two loudspeakers placed at the top of a shelf with an approximate distance of 1.5 m between them and hidden behind a thin fabric screen.
With only a fake window, the room has a relatively good sound insulation against exterior noise.
2.3.1 PROCEDURE
The listening tests follow a rather simple procedure: no hearing tests are performed on the participants, no rehearsal phase is proposed.
Participants are first given a sheet of paper (reproduced in Annexe 2) containing a short questionnaire and the instructions for the test. The questions concern the participant (age, gender, presence of identified hearing impairment) and his home (type of dwelling and environment) for eventual detailed analysis.
16/49
Rapport de recherche n° USC-EA-D1_A2.1.4_2
Once they are ready, participants take the test and can take as much time as they need to complete it. The test uses a MATLAB program running on a computer so that no intervention of another person is required.
2.3.2 STIMULI PRESENTATION AND RATING
A direct scaling method has been chosen for this experiment, using a discrete scale from 0 (not at all annoying) to 10 (extremely annoying) as recommended in ISO 15666 [17].
The whole test is divided into 2 parts: first the stimuli corresponding to outside noise are played and rated, and then the stimuli corresponding to noise from the neighboring dwellings.
Within each of these parts, all the stimuli that correspond to a given sound source are presented together on the same screen (see Annexe 3). The listener can play each of these stimuli as many time as he wants by clicking a button and adjust the ratings using the corresponding cursors. Once he is satisfied with the ratings, the participant validates his choice and proceeds to the next sound source. At this level, previous ratings can not be longer modified.
Cursors have a red color and turn green once the corresponding stimulus has been played and rated. All stimuli have to be rated in order for the participant to validate his choice and go on to the next screen.
In order to compensate for any order effect on the test results, stimuli that are presented together are placed in a random order on the screen. Similarly, a random order is applied to the different groups of stimuli.
2.4 PRODUCTION OF THE AUDIO STIMULI
The audio stimuli used in the test are obtained from recorded sound samples of the database of the Acoubat Sound software. The sound samples are representing noise produced in the emission room or outside the building and must be filtered to reproduce the transmission through façade walls or separating walls and floors.
2.4.1 FILTERING
The initial audio sequences are filtered in third octave bands with the sound reduction index of building elements, taking only the direct transmission path into account. Digital filtering using second-order Butterworth filters is performed. Remark : the sound samples are filtered in the range 50-5000 Hz, for which sound reduction index data are available. All the frequency content below and above this range is cut off. This may result in a lack of realism of the sound reproduction, in particular for noise sources that have a strong low frequency content (e.g. music, road traffic, airplane, construction works). Other techniques can be implemented in order to keep low frequencies in the signals, as in the work by Mortensen [3], Ordoñez et al. [18] or in the Swedish project Akulite
17/49
Rapport de recherche n° USC-EA-D1_A2.1.4_2
[13]. However, when evaluating the filtered sound samples before using them in the listening tests, this lack of realism was not detected.
2.4.2 SOUND REPRODUCTION
The sound stimuli are recorded as mono signals with a sampling frequency of 44100 Hz and encoded as 16-bit WAVE files. They are played by the computer running the MATLAB program (with its built-in sound card) connected to two Genelec 8020A active loudspeakers.
Once the volume knob on the loudspeakers is set, a calibration step is required to compensate for the frequency response of the whole electroacoustic system, which is most likely not flat in the frequency range of interest (especially in the low frequency range where the response of the loudspeakers drops). To that end, sound pressure level measurements are performed in the room with an averaging time of 15 s while some stimuli are played, and measured and expected spectra are compared. Then all the stimuli are filtered in third octave again, the filter characteristic being equal to the average difference between the expected and measured sound pressure levels. This procedure allows to reproduce the expected sound pressure level in the listening room within a 3 dB accuracy at all frequency bands (see Figure 1).
Figure 1: Calibration result for one of the sound stimuli 2.5 PARTICIPANTS
For a better reliability of the statistical analysis, it is important to perform the test with an important number of participants and that the panel is representative of the French population in terms of age and gender distribution, home environment, cultural background, etc.
-10 0 10 20 30 40 50 50 63 80 10 0 12 5 16 0 20 0 25 0 31 5 40 0 50 0 63 0 80 0 10 00 12 50 16 60 20 00 25 00 31 50 40 00 50 00 LP [d B ] Frequency [Hz]
Expected SPL from the sound stimulus only Measured background noise
Expected total SPL Measured total SPL
18/49
Rapport de recherche n° USC-EA-D1_A2.1.4_2
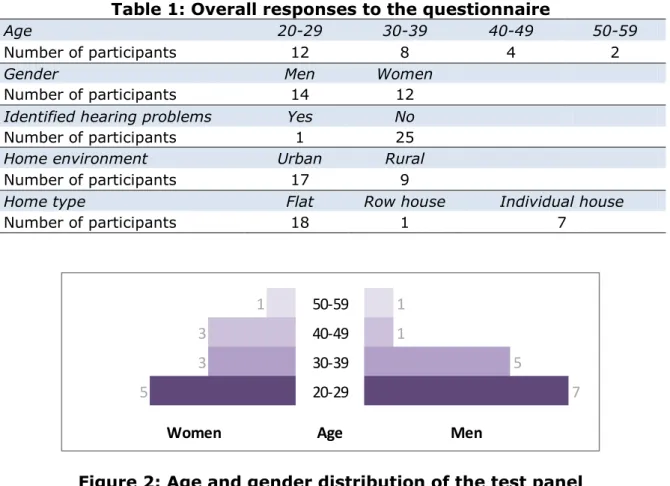
Due to the time available, 26 persons took the test. All test subjects got rewarded with a 10 euro gift certificate for their participation at the end of the test. Despite a large majority of them were working at CSTB, only a few were familiar with acoustics and had already participated in listening tests before. Results of the questionnaire are reproduced in Table 1. The age and gender distribution is represented in Figure 2.
Although a good balance between male and female subjects, it should be noted that the panel is mostly composed of rather young people, which is not really representative of the French population.
Remark: despite one participant was subject to light hearing problems, it was still decided to account for his responses since they were not significantly different from the responses of other participants.
Table 1: Overall responses to the questionnaire
Age 20-29 30-39 40-49 50-59
Number of participants 12 8 4 2
Gender Men Women
Number of participants 14 12
Identified hearing problems Yes No
Number of participants 1 25
Home environment Urban Rural
Number of participants 17 9
Home type Flat Row house Individual house
Number of participants 18 1 7
Figure 2: Age and gender distribution of the test panel 2.6 RESULTS POST-PROCESSING
All the participants have to rate the same set of sound stimuli. For each stimulus, all the ratings are averaged over the panel. Then a linear fit is performed between the average rating and the performance descriptor under consideration, following the method presented in [19].
A good performance descriptor is characterized by a decrease of the averaged annoyance with increasing performance, for all types of sound sources. Consequently, the Pearson correlation coefficient R is expected to be close to -1
1 50-59 1 3 40-49 1 3 30-39 5 5 20-29 7 Age Men Women
19/49
Rapport de recherche n° USC-EA-D1_A2.1.4_2
for good descriptors. The correlation analysis is carried out by considering all the different situations (all building elements and all sound sources) and also at a more detailed level for each sound source independently. Distinction is made between interior and exterior noise.
3. DESCRIPTORS UNDER STUDY
In this work, 12 different Single Number Ratings (SNR) describing the protection against noise provided by building components are considered. They are all obtained from third octave band values of the sound reduction index R, either by comparison to a reference spectrum or by applying a given frequency weighting. Some of them are already used in the current French acoustic regulation, and others are introduced by the new draft standard ISO/CD 16717-1.
3.1 DESCRIPTORS USED BY THE FRENCH ACOUSTIC REGULATION
RW+C100-3150 : as defined in ISO 717-1 [20], is obtained by comparison to
the reference curve for airborne noise and addition of the adaptation term C, in the range 100-3150 Hz. It is used in the French acoustic regulation as the performance of building elements for sources of airborne noise located inside the building.
RW+Ctr,100-3150 : as defined in ISO 717-1 [20], is obtained by comparison
to the reference curve for airborne noise and addition of the adaptation term Ctr, in the range 100-3150 Hz. It is used in the French acoustic
regulation as the performance of building elements for sources of airborne noise located outside.
3.2 NEW PROPOSALS
Rliving : the “living noise sound reduction index” as defined in ISO/CD
16717-1, evaluated from 50 to 3150 Hz, representing insulation against “living noise” with an A-weighted pink noise spectrum as given for the previous spectrum adaption term C50−5000.
Rtraffic : the “traffic noise sound reduction index” as defined in ISO/CD
16717-1, evaluated from 50 to 3150 Hz, representing insulation against annoyance by traffic noise with an A-weighted traffic noise spectrum as given for the previous spectrum adaption term Ctr,50−5000.
3.3 OTHER DESCRIPTORS
Rspeech : the “speech sound reduction index”, evaluated from 200 to 3150
Hz, representing speech privacy (formerly introduced by the new draft standard but recently removed after discussion).
Rliving,85% : similar to the “living noise sound reduction index” Rliving, except
that an alternative reference spectrum supposedly valid for 85% of real sound sources is used (formerly introduced by one of the standard draft version but then removed after discussion).
20/49
Rapport de recherche n° USC-EA-D1_A2.1.4_2
RW : as defined in ISO 717-1 [20], is obtained by comparison to the
reference curve for airborne noise without addition of any adaptation term.
R100-5000 – dB(A) : evaluated by applying the A-weighting spectrum in the
range 100-5000 Hz.
R100-5000 – ISO226-40Phon : evaluated by applying a frequency weighting
corresponding to the 40 Phon curve defined in ISO 226 [21] in the range 100-5000 Hz.
R100-5000 – ISO226-30Phon : evaluated by applying a frequency weighting
corresponding to the 30 Phon curve defined in ISO 226 [21] in the range 100-5000 Hz.
R50-5000 – ISO226-40Phon : evaluated by applying a frequency weighting
corresponding to the 40 Phon curve defined in ISO 226 [21] in the range 50-5000 Hz.
R50-5000 – ISO226-30Phon : evaluated Hz by applying a frequency weighting
corresponding to the 30 Phon curve defined in ISO 226 [21] in the range 50-5000.
The A-weighting spectrum as well as the frequency weighting spectra corresponding to the 40 Phon and 30 Phon curves are represented in Figure 3. These two last weighting spectra are related to loudness threshold of audibility and are supposed to give a better representation of the sensitivity of human ear at normal sound levels encountered in a dwelling.
Figure 3: Frequency weightings used to calculate single number descriptors -50 -40 -30 -20 -10 0 10 50 63 80 10 0 12 5 16 0 20 0 25 0 31 5 40 0 50 0 63 0 80 0 10 00 12 50 16 60 20 00 25 00 31 50 40 00 50 00 [d B ] Frequency [Hz] dB(A) 40 Phon 30 Phon
21/49
Rapport de recherche n° USC-EA-D1_A2.1.4_2
4. LISTENING TESTS ON INDOOR AIRBORNE NOISE
4.1 SELECTED SOUND SOURCES AND LEVEL SETTING
The 6 sound sources listed in Table 2 were selected because they were representative of what building occupants complain most.
To keep the test duration within reasonable limits, only a certain part of the initial sound samples had sometimes to be selected. The spectra of the initial sound samples (before time selection and filtering) corresponding to each of the selected sound sources are given in Annexe 4. Other sources were available but were not selected, since their spectra were not significantly different.
Table 2: Selected sources of interior noise
Source
no. Source type
Duration [s] Leq [dB] LAeq [dB(A)] 1 Rock music 8 86 75
2 Television (news program) 20 79 74
3 Birthday party (with singing voices) 14 83 82 4 House warming party (with music and
voices) 14 82 80
5 Home cinema (war movie with blasts
and voices) 24 84 82
6 Classical music 14 75 75
Before being filtered with the sound reduction index of the separating walls and floors, different values of volume gain are applied to the sound samples so that the resulting levels are representative of a normal situation in the virtual “emission room” and that a good balance is found between them.
22/49
Rapport de recherche n° USC-EA-D1_A2.1.4_2
Figure 4: Emission spectra of the selected interior noise sources 4.2 SELECTED SEPARATING WALLS AND FLOORS
In this part of the test, sound samples are filtered with the sound reduction index of the 8 following separating walls and floors.
Table 3: Selected separating elements
Separating
element No. Description
1 Lightweight wall made of plasterboards mounted on double metallic frame
2 Heavy wall made of 200 mm thick hollow concrete blocks
3 Lightweight plasterboard wall on double wood frame with internal bracing boards
4 Lightweight plasterboard wall on double wood frame with external bracing boards
5 Lightweight wall made of plasterboards on simple wood frame with an independent lining on one side
6 Heavy floor made of 200 mm thick concrete
7 Wooden floor with suspended ceiling and plastic floor covering 8 Wooden floor with suspended ceiling and parquet flooring
These building elements have very different acoustic performances, as shown in Figure 5. Table 4 summarizes the Single Number Ratings of these walls and floors. 20 30 40 50 60 70 80 50 63 80 10 0 12 5 16 0 20 0 25 0 31 5 40 0 50 0 63 0 80 0 10 00 12 50 16 60 20 00 25 00 31 50 40 00 50 00 LP [d B r e 2 10 -5 Pa] Frequency [Hz] Rock music TV Birthday party House warming party Home cinema Classical music
23/49
Rapport de recherche n° USC-EA-D1_A2.1.4_2
Figure 5: Acoustic performance of the selected separating walls and floors
Table 4: Single Number Ratings of the selected separating elements
Separating element No.
1 2 3 4 5 6 7 8 Rliving 58.4 54.0 48.0 51.8 54.7 61.0 52.5 52.5 Rtraffic 43.8 47.1 36.8 40.5 41.6 50.4 41.5 41.6 Rspeech 71.8 54.8 62.1 64.1 67.7 64.0 58.4 61.4 RW+C100-3150 64.0 54.0 49.0 53.0 58.0 62.0 54.0 54.0 RW+Ctr,100-3150 57.0 51.0 42.0 47.0 52.0 57.0 48.0 47.0 RW 66 55 54 57 61 63 56 56 R100-5000 - dB(A) 64.7 54.4 50.3 54.2 59.5 62.8 54.6 54.6 R100-5000 - ISO226-40Phon 68.5 55.0 55.1 57.4 63.4 65.2 57.4 58.3 R100-5000 - ISO226-30Phon 70.2 55.3 57.3 58.9 65.2 66.3 58.5 60.1 R50-5000 - ISO226-40Phon 65.0 54.9 53.5 56.3 60.6 64.5 56.5 57.2 R50-5000 - ISO226-30Phon 67.7 55.3 56.0 58.1 63.1 65.9 58.0 59.3 Rliving,85% 56.1 52.1 44.9 48.9 52.1 58.2 49.6 49.5
Note: a wide variety of descriptors can be defined using the A-weighting spectrum, however only R100-5000 – dB(A) is considered here to avoid redundancy.
Indeed, R50-5000 – dB(A) and R50-3150 – dB(A) would have similar values as Rliving, while
R100-3150 – dB(A) would be very close to RW+C100-3150.
15 25 35 45 55 65 75 85 95 50 63 80 10 0 12 5 16 0 20 0 25 0 31 5 40 0 50 0 63 0 80 0 10 00 12 50 16 60 20 00 25 00 31 50 40 00 50 00 R [ d B ] Frequency [Hz] No. 1 No. 2 No. 3 No. 4 No. 5 No. 6 No. 7 No. 8
24/49
Rapport de recherche n° USC-EA-D1_A2.1.4_2
4.3 RESULTS
The average annoyance rating given by the test subjects to the different separating elements, considering all the sound sources, is represented together with their sound reduction indices in Figure 6, where high values of annoyance are represented in red and low values in blue.
From these results, it can be observed that low annoyance values correspond to sound reduction indices with important slopes and high values at medium and high frequencies (above 65 dB at 1 kHz), while high annoyance values correspond to sound reduction indices with smoother slopes and moderate values in the medium and high frequency range.
However, even though flanking transmission is not taken into account in this experiment, the sound pressure level in the listening room is not only determined by the source emission level and the wall sound reduction index. Indeed, the level of the audio stimuli can be lower than the background noise in the room, especially at high frequencies, as shown in Figure 1. Consequently, the ability to hear differences between the stimuli is limited above a certain frequency. The dashed black curve in Figure 6 represents the limit above which background noise is higher by at least 5 dB than the sound pressure level of the source, for any of the audio stimuli used in this part of the experiment. This shows that differences in the sound reduction indices above 500 Hz can hardly explain differences in the annoyance ratings obtained by the walls.
Remark: complementary tests were performed by increasing the level of all the sound stimuli by 5 dB, thus decreasing the influence of background noise. Results were not significantly affected.
Figure 6: Separating elements classified by average annoyance 15 25 35 45 55 65 75 85 95 50 63 80 10 0 12 5 16 0 20 0 25 0 31 5 40 0 50 0 63 0 80 0 10 00 12 50 16 60 20 00 25 00 31 50 40 00 50 00 R [ d B ] Frequency [Hz] 2.8 3.9 4.3 5.3 5.3 5.4 6.4 7.0 Limit
25/49
Rapport de recherche n° USC-EA-D1_A2.1.4_2
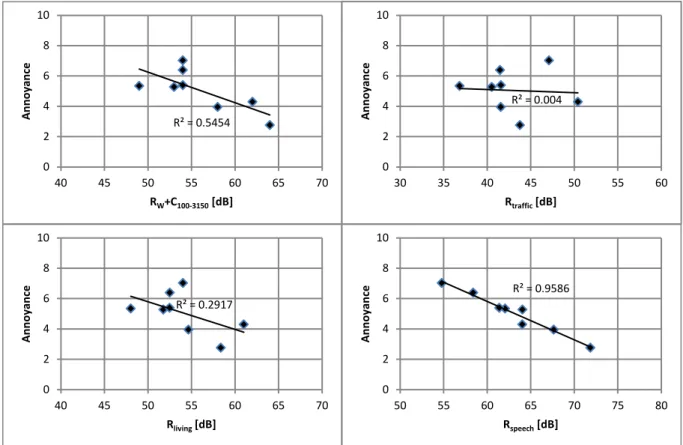
A linear fit is performed between the average annoyance and the performance descriptors mentioned in section 3, considering all the separating walls and floors. Correlation coefficients are given in
Table 5. All values that are lower or equal to -0.95 (which corresponds to R² ≥ 0.9) are highlighted in green. Some examples of linear fits are represented in Figure 7.
The sound source that is evaluated as the most annoying is rock music. For this source, all descriptors except Rtraffic and Rspeech are very well correlated to
annoyance. For the other sound sources, Rtraffic, which was designed for exterior
noise, shows very poor correlation, while Rspeech shows the best results.
On average, the descriptors based on the Phon curves defined in ISO 226 show rather good correlations as well. However, no improvement is obtained by starting the evaluation at 50 Hz instead of 100 Hz, except for the rock music sound source.
The descriptor currently used for interior noise RW+C100-3150 does not appear to be
very well correlated to annoyance, but the new proposed quantity Rliving does not
show better results. Very little difference is observed with Rliving,85%.
These results are close to those obtained by Hongisto et al. in Finland [16].
Figure 7: Relationship between performance descriptors and average annoyance - Interior noise (all sources)
R² = 0.5454 0 2 4 6 8 10 40 45 50 55 60 65 70 A n n o y an ce RW+C100-3150[dB] R² = 0.2917 0 2 4 6 8 10 40 45 50 55 60 65 70 A n n o y an ce Rliving[dB] R² = 0.004 0 2 4 6 8 10 30 35 40 45 50 55 60 A n n o y an ce Rtraffic[dB] R² = 0.9586 0 2 4 6 8 10 50 55 60 65 70 75 80 A n n o y an ce Rspeech[dB]
26/49
Rapport de recherche n° USC-EA-D1_A2.1.4_2
Table 5: Correlation coefficients (R) between performance descriptors and annoyance – Interior noise
Rock music TV Birthday party House warming party Home cinema Classical music All sources Rliving -0.92 -0.48 -0.26 -0.55 -0.59 -0.37 -0.54 Rtraffic -0.60 0.00 0.22 -0.07 -0.12 0.11 -0.06 Rspeech -0.74 -0.97 -0.96 -0.98 -0.96 -0.97 -0.98 RW+C100-3150 -0.98 -0.69 -0.49 -0.75 -0.78 -0.58 -0.74 RW+Ctr,100-3150 -0.93 -0.52 -0.30 -0.58 -0.60 -0.40 -0.57 RW -0.99 -0.85 -0.69 -0.88 -0.89 -0.76 -0.88 R100-5000 - dB(A) -0.99 -0.73 -0.54 -0.78 -0.80 -0.63 -0.78 R100-5000 - ISO226-40Phon -0.97 -0.87 -0.73 -0.90 -0.92 -0.80 -0.90 R100-5000 - ISO226-30Phon -0.94 -0.91 -0.79 -0.94 -0.95 -0.85 -0.94 R50-5000 - ISO226-40Phon -0.98 -0.77 -0.61 -0.83 -0.86 -0.69 -0.82 R50-5000 - ISO226-30Phon -0.96 -0.85 -0.72 -0.90 -0.92 -0.79 -0.90 Rliving,85% -0.91 -0.46 -0.23 -0.52 -0.56 -0.34 -0.52
27/49
Rapport de recherche n° USC-EA-D1_A2.1.4_2
5. LISTENING TESTS ON OUTDOOR AIRBORNE NOISE
5.1 SELECTED SOUND SOURCES AND LEVEL SETTING
The 7 exterior noise sources listed in Table 6 were selected because they were representative of what building occupants complain most.
To keep the test duration within reasonable limits, only a certain part of the initial sound samples had sometimes to be selected. The spectra of the initial sound samples (before time selection and filtering) corresponding to each of the selected sound sources are given in Annexe 4. Other sources were available but were not selected, since their spectra were not significantly different.
Table 6: Selected sources of exterior noise
Source
No. Source type
Duration [s] Leq [dB] LAeq [dB(A)] 1 Pass-by of a plane 38 81 74
2 Traffic in a busy street 19 86 77
3 Construction works (with equipment
noise and loud voices) 24 85 83
4 Church bell ringing 19 84 83
5 Loud voices 19 82 81
6 Pass-by of a scooter 5 83 82
7 Pass-by of an ambulance (with siren
on) 10 84 83
Before being filtered with the sound reduction index of the façade walls, different values of volume gain are applied to the sound samples so that a realistic balance is found between them.
Then a second equalization step is performed on the traffic sound sample for each of the different façade walls in order to get a resulting sound pressure level in the reception room (after filtering with the sound reduction index) around 30 dB(A). Indeed, according to the French acoustic regulation, façades must be dimensioned based on the exterior noise level due to ground transportation. With a proper dimensioning, buildings that are strongly exposed to traffic noise should have better performing façades and, as a result, the interior noise level should always be approximately the same. The same correction is finally applied to the other sound sources, which implies that the levels of the different sources are all linked to that of traffic noise. The assumption is made that the distance between the building and the sound sources can vary (multiplication by a given factor, identical for all sources), and that the type of façade wall is chosen such that the sound pressure level inside the building remains the same. As a result, the difference in emission levels reaches 17 dB between the best performing and the worst performing façades. This corresponds to a multiplication of the source-building distance by a factor of 7.
28/49
Rapport de recherche n° USC-EA-D1_A2.1.4_2
The highest emission levels (i.e. for the best performing façade) of the 7 sound sources are represented in Figure 8.
Figure 8: Emission spectra of the selected exterior noise sources 5.2 SELECTED FAÇADE WALLS
In this part of the test, sound samples are filtered with the sound reduction index of the 10 following separating walls and floors. The dimension of the walls is 4x2.5 m² and that of the windows is 1.4x1.2 m². The lightweight façade element is described in Figure 9.
Figure 9: Description of the lightweight façade element 25 35 45 55 65 75 85 50 63 80 10 0 12 5 16 0 20 0 25 0 31 5 40 0 50 0 63 0 80 0 10 00 12 50 16 60 20 00 25 00 31 50 40 00 50 00 LP [d B r e 2 10 -5 Pa] Frequency [Hz] Plane Traffic Works Church bell Scooter Siren Voices
29/49
Rapport de recherche n° USC-EA-D1_A2.1.4_2
Table 7: Selected façade walls
Façade wall
No. Description
1 16 cm thick concrete wall and associated thermal insulation with RW+Ctr=48 dB + double pane window with RW+Ctr=28 dB
2
16 cm thick concrete wall and associated thermal insulation with
RW+Ctr=48 dB + double pane window with RW+Ctr=43 dB + air inlet with Dne,w+Ctr=36 dB
3 Lightweight wall with RW+Ctr=35 dB + double pane window with RW+Ctr=43 dB + air inlet with Dne,w+Ctr=39 dB
4
16 cm thick concrete wall and associated thermal insulation with
RW+Ctr=48 dB + double pane window with RW+Ctr=28 dB + roller shutter with Dne,w+Ctr=41 dB
5 Lightweight wall with RW+Ctr=35 dB + double pane window with RW+Ctr=36 dB + roller shutter with Dne,w+Ctr=41 dB
6 Lightweight wall with RW+Ctr=35 dB + double pane window with RW+Ctr=40 dB
7 20 cm thick hollow concrete blocks and associated thermal insulation with RW+Ctr=51 dB + double pane window with RW+Ctr=36 dB
8 20 cm thick hollow concrete blocks and associated thermal insulation with RW+Ctr=51 dB + double pane window with RW+Ctr=43 dB
9
Lightweight wall with RW+Ctr=35 dB + double pane window with RW+Ctr=28 dB + air inlet with Dne,w+Ctr=36 dB + roller shutter with Dne,w+Ctr=41 dB
10 Lightweight wall with RW+Ctr=35 dB + double pane window with RW+Ctr=43 dB
These walls have very different acoustic performances, as shown in Figure 10. Table 8 summarizes their Single Number Ratings.
Figure 10: Acoustic performance of the selected façade walls 10 20 30 40 50 60 70 50 63 80 10 0 12 5 16 0 20 0 25 0 31 5 40 0 50 0 63 0 80 0 10 00 12 50 16 60 20 00 25 00 31 50 40 00 50 00 R [ d B ] Frequency [Hz] No. 1 No. 2 No. 3 No. 4 No. 5 No. 6 No. 7 No. 8 No. 9 No. 10
30/49
Rapport de recherche n° USC-EA-D1_A2.1.4_2
Table 8: Single Number Ratings of the selected façade walls
Façade wall No.
1 2 3 4 5 6 7 8 9 10 Rliving 40.0 35.1 36.5 39.0 38.8 40.2 47.8 51.9 32.9 40.3 Rtraffic 34.9 35.4 31.9 34.0 32.1 33.0 42.4 46.7 29.5 33.0 Rspeech 42.9 36.0 37.5 40.4 40.6 44.2 48.8 52.0 34.3 44.0 RW+C100-3150 39.0 36.0 36.0 38.0 38.0 39.0 47.0 51.0 33.0 40.0 RW+Ctr,100-3150 35.0 36.0 33.0 34.0 33.0 34.0 43.0 48.0 30.0 34.0 RW 42 36 37 40 40 43 49 52 34 43 R100-5000 - dB(A) 40.1 35.1 36.6 39.0 39.1 40.6 47.9 52.0 32.9 40.6 R100-5000 - ISO226-40Phon 41.8 35.1 37.8 40.6 41.6 43.7 49.9 53.2 33.6 43.8 R100-5000 - ISO226-30Phon 42.6 35.0 38.2 41.4 42.7 45.2 50.7 53.8 33.8 45.1 R50-5000 - ISO226-40Phon 41.8 35.1 37.8 40.6 41.5 43.6 49.8 53.2 33.6 43.6 R50-5000 - ISO226-30Phon 42.6 35.0 38.2 41.4 42.7 45.1 50.7 53.7 33.8 45.1 Rliving,85% 37.2 35.6 34.8 36.2 35.8 37.0 45.1 49.5 31.6 37.1 5.3 RESULTS
The average annoyance rating given by the test subjects to the different façade walls, considering all the sound sources, is represented together with their sound reduction indices in Figure 11, where high values of annoyance are represented in red and low values in blue.
The dashed black line represents the limit above which background noise is higher by at least 5 dB than the sound pressure level of the source, for any of the audio stimuli used in this part of the experiment (see section 4.3 for more details). This shows that the influence of background noise on the test results is limited.
31/49
Rapport de recherche n° USC-EA-D1_A2.1.4_2
Figure 11: Façade walls classified by average annoyance
A linear fit is performed between the average annoyance and the performance descriptors mentioned in section 3, considering all the façade walls. Correlation coefficients are given in Table 9. The best correlation for each sound source is highlighted in green. Some examples of linear fits are represented in Figure 12. The sound source that is evaluated as the most annoying is people talking in the street. For this source, none of the descriptors listed in section 3 is well correlated to annoyance. Results are similar for the other sound sources and on average.
All descriptors are poorly correlated to annoyance, some of them even having positive correlation coefficients, which means that the higher the performance value, the higher the annoyance. This is the case for the descriptor currently used for exterior noise, RW+Ctr,100-3150, and for the proposed new descriptor Rtraffic.
Moreover, the worst correlation values observed concern the road traffic stimuli, despite the fact that these two indices were designed for this sound source. The method proposed to set the emission levels of the sound sources is probably the cause of these bad correlations. Indeed, when comparing two different façades, two parameters are modified: the sound reduction index of the building element and the level of the sound sources. This undoubtedly introduces a bias, compared to the part of the test that deals with indoor noise, where only the acoustic performance of the wall or floor was modified.
10 20 30 40 50 60 70 50 63 80 10 0 12 5 16 0 20 0 25 0 31 5 40 0 50 0 63 0 80 0 10 00 12 50 16 60 20 00 25 00 31 50 40 00 50 00 R [ d B ] Frequency [Hz] 2.5 2.7 3.7 4.3 4.3 4.4 4.4 4.6 4.9 5.6 Limit
32/49
Rapport de recherche n° USC-EA-D1_A2.1.4_2
Figure 12: Relationship between performance descriptors and average annoyance - Exterior noise (all sources)
Table 9: Correlation coefficients (R) between performance descriptors and annoyance – Exterior noise
Plane Traffic Works Church
bells Voices Scooter Siren
All sources Rliving -0.18 -0.12 -0.28 -0.26 -0.20 -0.15 -0.30 -0.23 Rtraffic 0.11 0.17 0.05 0.12 0.16 0.21 0.06 0.13 Rspeech -0.31 -0.32 -0.46 -0.43 -0.38 -0.33 -0.49 -0.41 RW+C100-3150 -0.16 -0.08 -0.23 -0.20 -0.14 -0.10 -0.24 -0.17 RW+Ctr,100-3150 0.05 0.13 0.01 0.08 0.12 0.17 0.04 0.09 RW -0.27 -0.25 -0.39 -0.37 -0.32 -0.26 -0.42 -0.35 R100-5000 - dB(A) -0.21 -0.14 -0.30 -0.28 -0.22 -0.17 -0.31 -0.25 R100-5000 - ISO226-40Phon -0.32 -0.28 -0.43 -0.43 -0.37 -0.32 -0.46 -0.40 R100-5000 - ISO226-30Phon -0.37 -0.33 -0.49 -0.48 -0.43 -0.38 -0.51 -0.45 R50-5000 - ISO226-40Phon -0.32 -0.27 -0.43 -0.42 -0.37 -0.32 -0.45 -0.39 R50-5000 - ISO226-30Phon -0.36 -0.33 -0.48 -0.48 -0.43 -0.38 -0.51 -0.45 Rliving,85% -0.08 0.00 -0.14 -0.10 -0.05 0.00 -0.13 -0.08 R² = 0.0083 0 2 4 6 8 10 25 30 35 40 45 50 55 A n n o y an ce RW+Ctr,100-3150[dB] R² = 0.2059 0 2 4 6 8 10 30 35 40 45 50 55 60 A n n o y an ce R100-5000 - ISO226-30Phon[dB] R² = 0.017 0 2 4 6 8 10 25 30 35 40 45 50 55 A n n o y an ce Rtraffic[dB] R² = 0.1693 0 2 4 6 8 10 30 35 40 45 50 55 60 A n n o y an ce Rspeech[dB]
33/49
Rapport de recherche n° USC-EA-D1_A2.1.4_2
5.4 ADDITIONAL TESTS
Further tests were carried out on 24 new participants. The same method used for interior noise was followed to produce new stimuli in which the “emission level” of each sound source is fixed. Consequently, the sound pressure level in the listening room directly depends on the performance of the façade. Results of these additional tests are given in Table 10. All correlation coefficient values that are lower or equal to -0.95 (which corresponds to R² ≥ 0.9) are highlighted in green. Some examples of linear fits are represented in Figure 13.
These results show very good correlations between most descriptors and annoyance. The worst – but still acceptable – correlations correspond to
RW+Ctr,100-3150 and Rtraffic, without any significant difference between them. It can
also be noticed that these two descriptors behave better for sound sources that have a strong low frequency content than for sources with a rather medium or high frequency spectrum such as church bells, voices or sirens for example.
Figure 13: Relationship between performance descriptors and average annoyance - Exterior noise (all sources; additional tests)
R² = 0.7548 0 2 4 6 8 10 25 30 35 40 45 50 55 A n n o y an ce RW+Ctr,100-3150[dB] R² = 0.9817 0 2 4 6 8 10 30 35 40 45 50 55 60 A n n o y an ce R100-5000 - ISO226-30Phon[dB] R² = 0.7391 0 2 4 6 8 10 25 30 35 40 45 50 55 A n n o y an ce Rtraffic[dB] R² = 0.9931 0 2 4 6 8 10 30 35 40 45 50 55 60 A n n o y an ce Rspeech[dB]
34/49
Rapport de recherche n° USC-EA-D1_A2.1.4_2
Table 10: Correlation coefficients (R) between performance descriptors and annoyance – Exterior noise (additional tests)
Plane Traffic Works Church
bells Voices Scooter Siren
All sources Rliving -0.96 -0.98 -0.98 -0.95 -0.94 -0.96 -0.90 -0.97 Rtraffic -0.95 -0.94 -0.86 -0.80 -0.78 -0.83 -0.73 -0.86 Rspeech -0.93 -0.97 -0.99 -0.99 -0.99 -1.00 -0.98 -1.00 RW+C100-3150 -0.98 -0.99 -0.97 -0.94 -0.92 -0.96 -0.89 -0.97 RW+Ctr,100-3150 -0.97 -0.94 -0.86 -0.81 -0.79 -0.84 -0.74 -0.87 RW -0.95 -0.98 -0.99 -0.99 -0.98 -0.99 -0.96 -1.00 R100-5000 - dB(A) -0.96 -0.98 -0.99 -0.97 -0.96 -0.98 -0.92 -0.99 R100-5000 - ISO226-40Phon -0.92 -0.96 -0.99 -0.99 -0.99 -0.99 -0.96 -0.99 R100-5000 - ISO226-30Phon -0.91 -0.95 -0.99 -0.99 -0.99 -0.99 -0.97 -0.99 R50-5000 - ISO226-40Phon -0.92 -0.96 -0.99 -0.99 -0.99 -0.99 -0.96 -0.99 R50-5000 - ISO226-30Phon -0.91 -0.95 -0.99 -0.99 -0.99 -0.99 -0.97 -0.99 Rliving,85% -0.98 -0.97 -0.93 -0.89 -0.87 -0.91 -0.82 -0.93

![Figure 3: Frequency weightings used to calculate single number descriptors-50-40-30-20-10010506380100125160200250315400500630 800 1000 1250 1660 2000 2500 3150 4000 5000[dB]Frequency [Hz]dB(A)40 Phon30 Phon](https://thumb-eu.123doks.com/thumbv2/123doknet/7855688.262961/21.892.242.674.693.1092/figure-frequency-weightings-calculate-single-number-descriptors-frequency.webp)