HAL Id: hal-00018866
https://hal.archives-ouvertes.fr/hal-00018866
Submitted on 27 Oct 2006HAL is a multi-disciplinary open access archive for the deposit and dissemination of sci-entific research documents, whether they are pub-lished or not. The documents may come from teaching and research institutions in France or abroad, or from public or private research centers.
L’archive ouverte pluridisciplinaire HAL, est destinée au dépôt et à la diffusion de documents scientifiques de niveau recherche, publiés ou non, émanant des établissements d’enseignement et de recherche français ou étrangers, des laboratoires publics ou privés.
Co-ordinated growth between aerial and root systems in
young apple plants issued from in vitro culture
E. Costes, E. Garcia-Villanueva, E. Jourdan, E. Regnard, Yann Guédon
To cite this version:
E. Costes, E. Garcia-Villanueva, E. Jourdan, E. Regnard, Yann Guédon. Co-ordinated growth between aerial and root systems in young apple plants issued from in vitro culture. Annals of Botany, Oxford University Press (OUP), 2006, 97 (1) (1), pp.85-96. �10.1093/aob/mcj003�. �hal-00018866�
Coordinated growth between aerial and root systems in young apple
plants issued from in vitro culture
1 2 3 4 5 6 7 8 9 10 11 12 13 14 15 16 17 18 19 20 Corresponding author : Dr E. Costes
UMR BEPC, Architecture et Fonctionnement des Espèces Fruitières, INRA - 2 Place Viala, 34060 Montpellier Cedex 1 - France
Tel: +33 4 99 61 27 87 Fax: +33 4 99 61 26 16 E-mail: costes@ensam.inra.fr
3 tables 7 Figures
Coordinated growth between aerial and root systems in young apple
plants issued from in vitro culture
1 2 3 4 5 6 7 8 9 10 11 12
E. Costes1*, E. Garcia-Villanueva1, C. Jourdan², J.L. Regnard1 and Y. Guédon3
1 : UMR BEPC, Architecture et Fonctionnement des Espèces Fruitières,
INRA - 2 Place Viala, 34060 Montpellier Cedex 1, France
² : CIRAD TA 80/01, Avenue Agropolis, 34398 Montpellier Cedex 5, France
3 : UMR AMAP, CIRAD TA40/PS2, 34398 Montpellier Cedex 5, France
Short running title: coordinated growth in young apple trees
1 2 3 4 5 6 7 8 9 10 11 12 13 14 15 16 17 18 19 20 21 22 23 24 Abstract
Background and aims: In several species exhibiting a rhythmic aerial growth, the
existence of an alternation between root and shoot growth has been demonstrated. The present study aims at investigating the respective involvement of the emergence of new organs and their elongation in this phenomenon and its possible genotypic variation in young apple plants.
Methods: Two apple varieties: X6407, recently named ‘Ariane’ and X3305
(Chantecler x Baujade) were compared. Five plants per variety, issued from in vitro culture, were observed in minirhizotrons over 4 months. For each plant, root emergence and growth were observed twice per week. Growth rates were calculated for all roots with more than two segments and the branching density was calculated on primary roots (R1). On the aerial part, the number of leaves, leaf area and total shoot length were observed weekly.
Key results: No significant difference was observed between varieties in any of the
final characteristics of aerial growth. Increase in leaf area and shoot length exhibited a 3-weeks rhythm in X3305 while a weaker signal was observed in Ariane. The R1 growth rate was homogeneous between the plants and likewise between the varieties, while their branching density differed significantly. Secondary roots (R2) emerged rhythmically, with a 3-week and a 2-week rhythm respectively in X3305 and Ariane. Despite a high intra-variety variability, significant differences were observed between varieties in the R2 life span and mean length. A synchronism between leaf emergence and primary root growth was highlighted in both varieties while an opposition phase was observed between leaf area increments and secondary root emergence in X3305 only.
Conclusion: A biological model of dynamics that summarises the interactions
between processes and includes the assumption of a feedback effect of lateral root emergence on leaf emergence is proposed.
1 2 3 4
Keywords: plant architecture, root-shoot equilibrium, rhythmic growth, synchronism, time series
5 6 7
1 2 3 4 5 6 7 8 9 10 11 12 13 14 15 16 17 18 19 20 21 22 23 24 25 INTRODUCTION
In perennial plants, organogenesis can occur throughout ontogeny due to the maintenance of cell divisions in meristems (Lyndon, 1998). The emergence of successive leaves is usually characterized by the time between two successive primordial, called plastochrone. On a longer time scale, many plants also exhibit rhythmic growth with an alternation of organogenesis and rest periods (Hallé et al., 1978). At the whole plant scale, many studies devoted to growth rhythmicity have demonstrated the existence of an alternation between root and shoot growth, for instance in Pinus taeda (Drew and Ledig, 1980), Theobroma cacao (Greathouse et
al., 1971), Ligustrum sp. (Kuehny and Halbrooks, 1993), and Hevea brasiliensis
(Thaler and Pagès, 1996). This has been interpreted as the result of competition for assimilates between root and aerial growth, while root branching was promoted by
leaf development(Aguirrezabal et al., 1993).
In temperate fruit trees which exhibit rhythmic growth, a similar alternating pattern has been demonstrated in adult trees, on an annual time scale, for instance in peach trees (Williamson and Coston, 1989) and apple trees (Psarras and Merwin, 2000). However, these studies did not distinguish between organogenesis and elongation processes as previously done for other non fruiting species, probably because adult trees are too complex for this purpose. Because of the practice of grafting in the fruit industry, the interactions between root and aerial systems are of major interest. In the apple tree, which is commonly grown on dwarfing rootstocks, these interactions have been widely studied through the description of the effects of rootstock on the aerial
2003), on fruiting (Avery, 1969; Larsen et al., 1992), or fruit characteristics (Drake, 1988; Daugaard and Callesen, 2002). The effects of rootstock on biomass allocation have also been reported (Zhu et al., 1999), and competition during the emergence and expansion of new organs, including cambial growth, has been shown to interact with fruit development (Costes et al., 2000; Berman and DeJong, 2003). However, less information is available regarding the patterns in aerial and root growth within a growth cycle. In addition, little information is available regarding the apple tree root system structure, i.e. the combination of root growth, branching and life span characteristics for several successive branching orders. This is probably due to the difficulty in observing in situ root systems (Atkinson, 1974 and 1983). Because the root systems develop in an environment with less variation in temperature than the air but which is physically heterogeneous, roots were often viewed as opportunist in their development (Lynch, 1995). However, like the aerial part, roots have been shown to develop according to architectural rules, by the architectural comparison of both aerial and root systems of tropical trees (Atger and Edelin, 1994).
1 2 3 4 5 6 7 8 9 10 11 12 13 14 15 16 17 18 19 20 21 22 23 24 25 26
The main aims in the present study were to investigate (i) whether the growth of the roots and shoots of the apple tree are coordinated and/or alternate, and when the emergence of new organ and elongation are involved in this phenomenon (ii) the characteristics of roots belonging to at least two successive branching orders. In these two investigations, particular focus was given to the comparison between two varieties in order to highlight which process could depend on genetic factors. This study was carried out on young self-rooted trees issued from in vitro culture which were small enough to observe the variations in new organ emergence and elongation in both root and shoot growth.
1 2 3 4 5 6 7 8 9 10 11 12 13 14 15 16 17 18 19 20 21 22 23 24 25
MATERIALS AND METHODS
Two newly released apple varieties which both showed scab resistance and offered good fruit quality were studied: X6407, named ‘Ariane’ after selection by INRA Angers; and X3305 (Chantecler x Baujade) selected by INRA Bordeaux (Roche et
al., 2003).
Both varieties were propagated vegetatively by in vitro culture on a culture medium adapted from Murashige (1962). Roots were induced with an IBA application (5g/l) and the plants were placed in darkness at 18°C for 5 days. The plants were then left without any hormone in the culture medium for three weeks. After a total period of three months of in vitro culture, five plants per variety, as homogeneous as possible in their development, were selected to be transplanted in root observation boxes (minirhizotron). The minirhizotrons were built as described in previous studies (Neufeld et al., 1989; Thaler and Pagès, 1996). The box dimensions were 0,50 x 0,22
x 0,03 m3. The back and sides were made of opaque PVC while the front, for
observation purpose, was transparent. This side was covered by black plastic to keep the roots in the dark. The boxes were filled first with gravel to 3cm and then with sterilized compost. The roots were kept separated from the substratum and sandwiched against the transparent side by nylon mesh (Neufeld et al., 1989).
Immediately after transplantation, the ten observed plants were placed in a climatic chamber at 25°C, with 100% relative humidity and light of 55 µmoles m²/s in PAR for fourteen hours per day. During the first week after transplantation, they were provided with the nutritive solution that was in the in vitro medium, but without
1 2 3 4 5 6 7 8 9 10 11 12 13 14 15 16 17 18 19 20 21 22 23 24
growth regulators. After one week and during the experimentation follow-up, the plants were watered twice per week. Fungicide treatments against powdery mildew were applied only if necessary.
After transplantation, all the roots initiated during in vitro culture died and turned brown. Within fourteen days, new white roots developed from the dead roots and grew straight downwards. In the following, these new roots are referred as R1, their lateral roots as R2 and the laterals borne on R2, if any, are called R3. To avoid root growth constraints, the growth dynamics of both the aerial and root systems were observed until the longest R1 roots reached the box bottom. This led us to observe the plants for 111 days after transplantation. The root growth dynamics were recorded twice per week on a transparent plastic sheet by drawing the roots with different coloured permanent markers (Neufeld et al., 1989).
The drawings were then digitised in 2D using Rhizodigit 1.2 software developed at CIRAD, France, by Jourdan and Mailhe. During digitising, each new root was labelled with a specific number, and its type and initial 2D coordinates were recorded at its insertion point. On each segment corresponding to the root length developed between two observation dates, the top spatial coordinates and the observation date were recorded. After digitising, different variables were computed with macro functions developed in Excel software. For each plant, the number of newly developed roots was counted per unit of time and per type (R1, R2 and R3). The growth rate was calculated for all roots with more than two segments as the ratio between the length and the difference in the number of days between the first and the
1 2 3 4 5 6 7 8 9 10 11 12 13 14 15 16 17 18 19 20 21 22 23 24 25
last observation dates. The branching density was calculated as the ratio between the number of lateral roots per unit length of the parent root.
On the aerial part, at each observation day, the number of nodes and leaves, and the total shoot length were noted. The length and width of each leaf were measured once per week. Then, leaf area was precisely measured on a sub-sample of leaves. A linear relationship was then calculated to correlate the length and width to the area (data not shown). A single relationship (y = 0.69 x) was proved to be suitable to represent both cultivars with an acceptable r² coefficient (0.88).
Because of the low number of plants per variety, intra- and inter-variety variations in the final characteristics were analysed by a Kruskal-Wallis non-parametric ANOVA using Statistica version 6.0. At the end of the observation period, the aerial growth was characterised by four variables: the total shoot length, number of leaves, leaf area and the basal diameter. R1 were characterised by their total length, mean growth rate and mean branching density. R2 roots were characterised by their length and life span, and by the percentage of R2 roots with more than one segment (poly-segmented R2 roots).
Growth dynamics were studied with time series analysis methods on three variables on the aerial system, i.e. weekly increase in the number of leaves, leaf area and shoot length using the statistical module of AMAPmod software (Godin et al., 1997) . Five variables were considered on the root systems in order to compare their development and dynamics to the aerial part: mean total length and growth rates of both R1 and R2 roots, and weekly increase in number of R2 roots. For analysing the relationships
1 2 3 4 5 6 7 8 9 10 11 12 13 14 15 16 17
between growth and branching in primary roots, the only R1 selected were those which emerged during the first month after transplantation, grew all along the observation time and reached at least 30 cm. One to seven roots per plant corresponded to these three criteria. On these roots, the number of R2 roots per week and the growth rate of the parent R1 during the corresponding week were analysed as time series.
For analysing the rhythmic variations of variables, trends i.e. long-term changes in the mean level, were removed in order to obtain stationary time series (Chatfield, 2003). Different filtering procedures were tested based on either first-order differencing or symmetric smoothing filters such as the binomial distributions B(n,
p) with p = 0.5. Residual values, i.e. (original value – smoothed value) for each rank,
were then extracted with a symmetric smoothing filter corresponding to the probability mass function of the binomial distribution B(4, 0.5). As proposed by Brockwell and Davis (2002), the first and the last terms of the series were repeated when applying this symmetric smoothing filter in order to overcome end-effect problem. Sample autocorrelation and cross-correlation functions were then computed
on residual values. Given τ observations in a sequence, x K1, ,xτ, τ −k pairs of
observations 18
(
x1,xk+1) (
, x2,xk+2) (
,K, xτ−k,xτ)
can be formed, considering the firstobservation in each pair as one variable, denoted by , and the second observation
19
20 X( )1
as a second variable, denoted by . The autocorrelation coefficient at lag k for a
single sequence of length τ is thus given by (Chatfield, 2003; Brockwell and Davis, 2002). (k+1) X 21 22 23
( )
(
)(
) (
)
(
)
/ , / 1 2 1 τ µ τ µ µ τ τ∑
∑
= − = + − − − − = t t k t t t k x k x x k r 24where µ =
∑
τt=1xt/τ . When generalizing to a sample of sequences, theautocorrelation at lag k is computed from the
1
(
)
∑
i τi −k pairs of observationsextracted from all the sequences. The usual rule of thumb to indicate the uncertainty in an autocorrelation coefficient is that under the null condition of no correlation
(purely random sequence), the autocorrelation coefficient at lag k has standard error
which is roughly 2 3 4 5
(
)
∑
− i τi k± 961. in the case of a sample of sequences (Diggle et
al., 2002). 6 7 8 9 10 ) 11 12
Correlation properties of multivariate sequences can be investigated by sample cross-correlation functions which are a direct generalization of sample autocross-correlation
functions in which the pair of variables is either and Y or Y and
(Chatfield, 2003; Diggle, 1990). Hence, while the sample autocorrelation function is an even function of the lag in that
( )1
X (k+1 ( )1 X(k+1)
( ) ( )
k r kr = − , the sample cross-correlation
function is not an even function of the lag. 13 14 15 16 17 18 19 20 21 22 23 24 25
Since the application of linear filters for trend removal induces an autocorrelation structure (Diggle, 1990), we chose to show the autocorrelation function induced by the selected filter on the reference model (deterministic trend + white noise). A white noise series is a series of independent Gaussian random variables with zero mean and common variance parameter. The following convention was chosen to compute cross-correlation functions between variables 1 and 2: variable 1 was considered as reference and variable 2 shifted for increasing and decreasing lags. Consequently, the number of pairs of observations decreased with increasing absolute lag values and the maximum absolute lag value considered was fixed at 10.
1 2 3 4 5 6 7 8 9 10 11 12 13 14 15 16 17 18 19 20 21 22 23 24 25 RESULTS Shoot growth
No significant difference was observed between the two varieties regarding the final mean values of the variables selected to characterise their aerial growth (Table 1). However, at the end of the observation period, Ariane exhibited more variability in all variables than X3305.
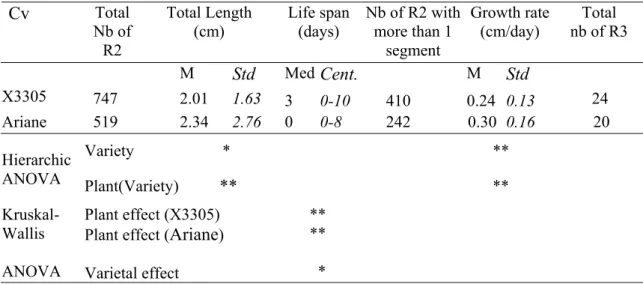
Sample autocorrelation functions showed significant coefficients at different lags depending on both the variable and variety (Fig. 1). In X3305, a rhythmic and particularly stable pattern appeared for both leaf area and shoot length (Fig. 1a). Significant and positive coefficients were observed at lags 3 and 6, while negative at lags 4 and 7. Thus, the variations in leaf area and shoot length were synchronised with a rhythm of three weeks, and were in opposition phase the following week. No significant autocorrelation coefficients were observed for the number of new leaves. In Ariane, the number of new leaves tended to alternate, i.e. exhibited a two-week rhythm, but only the first autocorrelation coefficients were significant and the pattern died out rapidly (Fig. 1b). The variations in leaf area and shoot length were only negatively correlated at lag 2 and those in leaf area tended to be synchronised each three weeks. Finally, in X3305, the elongation variables had higher autocorrelation coefficients than the number of new leaves and exhibited a similar rhythm of three weeks. By contrast, in Ariane, leaf emergence had higher autocorrelation coefficients than leaf and shoot elongation, and tended to alternate.
1 2 3 4 5 6 7 8 9 10 11 12 13 14 15 16 17 18 19 20 21 22 23 24 25
In X3305, the cross-correlation function between the variations in leaf area and shoot
length appeared to be an even function of the lag since r(k) ≅ r(-k) (Fig. 2a). Indeed,
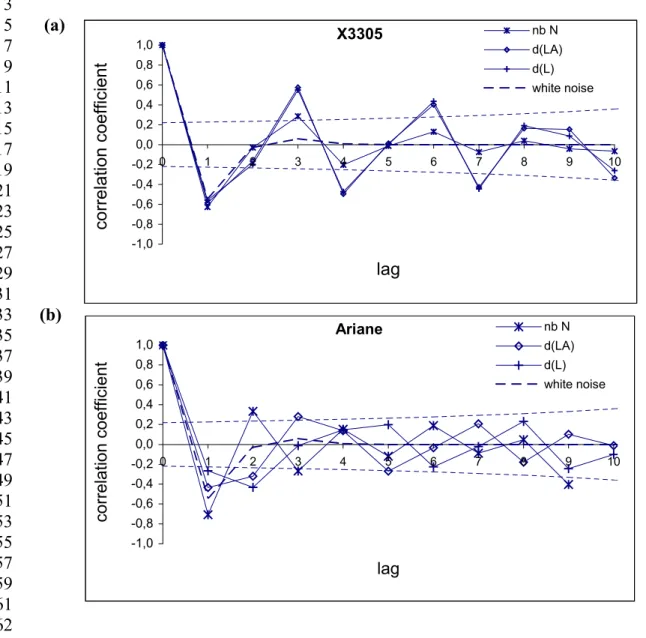
the cross-correlation coefficient was highly significant at lag 0 while, at higher positive or negative lags, the coefficients were successively positive and negative with a symmetric rhythm of three weeks (negative at lags ±1, ±4, ±7, positive at lags ±3, ±6). This remarkable structure indicates that these two variables followed a similar rhythm. Their respective cross-correlation functions with the number of new leaves (Fig. 2b) were also quite similar with significant coefficients observed for positive lags while few or no significant coefficients were observed for negative lags. This dissymmetry of the cross-correlation function indicates that the elongation processes is correlated to the number of leaves that emerged in the weeks before while the inverse is not true. The elongation process, in both leaves and shoots, was positively correlated with the number of leaves emerged one week before (positive coefficients at lags 1) while in opposition phase with the number of leaves emerged two weeks before (negative coefficients at lags 2). This pattern tended to repeat with a three-week rhythm. In Ariane, the variations in leaf area and shoot length were synchronised in the current week and four weeks before, with an opposition phase the week after the synchrony (Fig. 2c). The number of new leaves and the variations in both leaf area and shoot length were not significantly correlated regardless the lag value and sign (Fig. 2d).
Root growth
Seven to forty roots per plant developed directly from the in vitro dead roots and
1 2 3 4 5 6 7 8 9 10 11 12 13 14 15 16 17 18 19 20 21 22 23 24 25
exhibited a large variation between plants (Table 2). A six-fold coefficient was observed between the plants that had the lowest and largest number of secondary roots. Basically, the fewer the leaves, the fewer the roots each plant had. The converse was also true. Few tertiary roots developed for any plant (Table 3) and most had only one segment, which meant that they lived less than one week. Thus, these roots were not analysed in the following.
Root system architecture. Among R1, a large variation was observed in the final
length. However, the selected roots were homogeneous in their growth rate between plants and no difference was observed between varieties (Table 2). By contrast, their mean branching density was significantly different between X3305 and Ariane, with a higher density observed in X3305. As a consequence, the total number of R2 per plant as well as the mean number of R2 per selected R1 root was significantly lower in Ariane than in X3305 (Table 2). About 50% of R2 stopped growing during their first three days of growth, these roots developing a single segment. The number of R2 which were still growing from one observation date to the following decreased exponentially. Because of this exponential decrease, R2 life span was analysed through median and centiles values. In both varieties, significant differences were observed between plants (Table 3). Despite this intra-variety heterogeneity, significant differences were also observed between varieties: the R2 life span was significantly shorter in Ariane than in X3305. R2 mean length was also significantly different between both plants and varieties, with R2 slightly longer in Ariane than in X3305. The mean R2 growth rate, life span and total length were calculated on the sub-sample of R2 which developed more than 2 segments (Table 3). In both varieties, these R2 grew nearly twice as slowly as R1 and their growth rate was
1 2 3 4 5 6 7 8 9 10 11 12 13 14 15 16 17 18 19 20 21 22 23 24
significantly higher in Ariane than in X3305. Their total length was also significantly different between varieties, while their life span was not different (data not shown). Finally, the differences in R2 between varieties can be summarized as follows: in X3305, the R2 were more numerous than in Ariane and more than 50% developed at least during two successive observations (i.e. more than 3 days), these roots growing relatively slowly and remaining quite short. By contrast, in Ariane, few R2 developed, less than 50% of them remained alive for more than 3 days but these roots grew faster and became longer.
Root growth dynamics. The growth dynamics of primary and secondary roots were
studied per plant through five variables which were calculated weekly: (i) the mean total length and the mean growth rate of both R1 and R2, and (ii) the number of new R2. In both varieties, the sample autocorrelation functions of the variables related to R1 did not show a clear pattern and few or no coefficients were significant regardless of the lag (cross-correlation functions not shown). By contrast, sample autocorrelation functions of the variables related to R2 showed rhythmic patterns with significant coefficients (Fig. 3). In both varieties, R2 emerged rhythmically. Only one significant coefficient was observed at lag 3 in X3305 while an alternation, i.e. a two-week rhythm with significant coefficients until lag 5, was observed in Ariane. R2 growth rates exhibited a quite similar pattern in both varieties with an opposition phase observed each two weeks (negative coefficients at lag 2). In X3305, a synchrony was also observed each 3 weeks for this variable. In both varieties, the mean length of R2 did not show significant autocorrelation coefficients.
1 2 3 4 5 6 7 8 9 10 11 12 13 14 15 16 17 18 19 20 21 22 23 24 25
In both varieties, the cross-correlation functions between the mean length and mean growth rate of R1 did not show significant coefficients and these two variables were also poorly correlated to the equivalent variables in R2 (cross-correlation functions not shown). By contrast, the cross-correlation functions between the three variables considered on R2 showed significant coefficients (Fig. 4). In X3305, these three variables were synchronous in the current week (Fig. 4a). The cross-correlation function between R2 growth and both the number of R2 and their mean total length were dissymmetric, with higher coefficients for negative than positive lags. Thus, the variations in R2 growth rate were correlated to the two other variables observed in the weeks before, with a rhythm of three weeks (negative coefficients at lags -1, -4 and -7 and positive coefficients at lags -3, -5 and -8). The cross-correlation function between the number of R2 and their mean total length exhibited an even structure, with a rhythm of three weeks until lags ±3 or ±4, and which rapidly died out at higher lags. This particular structure was also observed on the cross-correlation function between the number of R2 and their mean total length in Ariane (Fig. 4c), even though the coefficients were less significant and the rhythm was different (two-week).
In X3305, the emergence of new R2 was correlated to both the R1 growth rate and mean length for negative lags only (Fig. 4b). A positive correlation was observed in the current week and three weeks before (lags 0 and -3), while an opposition phase was observed one week after (negative coefficients at lags -2 and 1). In Ariane, the number of R2 was significant correlated only to the R1 mean length and for negative lags (Fig. 4d). A positive coefficient was observed in the current week and with a four-week rhythm towards negative lags. In both varieties, high correlation
1 2 3 4 5 6 7 8 9 10 11 12 13 14 15 16 17 18 19 20 21 22 23 24
coefficients were observed for high negative lags suggesting relatively long term effects of the R1 growth rate in X3305 and the R1 total length in Ariane, on the number of new R2.
Comparison between aerial and root system dynamics
This comparison was performed at the whole plant scale. The three variables studied in the aerial part were plotted against the five variables studied on root systems, and cross-correlation functions were considered for each pair of variables. Since the cross-correlation functions were too numerous, we chose to present only the main results.
In both varieties, the variables related to R1 were not correlated to the variations in leaf area and shoot length (cross-correlation functions not shown). By contrast, significant cross-correlation coefficients were observed with the number of new leaves (Fig. 5). In X3305, the number of leaves was positively correlated to the R1 mean length and growth rate that occurred one week after leaf emergence (lag -1) and this repeated with a three-week rhythm. However, the pattern died quite rapidly with increasing lags (Fig. 5a, b) . In Ariane (Fig. 5c), the number of new leaves was alternatively positively and negatively correlated to the R1 mean length for negative lags, with a rhythm of two weeks beginning from a synchrony in the current week. Cross-correlation coefficients with the R1 growth rate were not significant (Fig. 5d). Finally, leaf emergence was synchronised with the R1 mean length in both varieties, and with the R1 growth rate only in X3305.
Regarding the variables related to R2, in both varieties, the cross-correlation functions between the number of new leaves and the number of new R2 exhibited a rhythmic pattern, with significant coefficients only for positive lags (Fig. 6a, c). Thus, leaf emergence was correlated to the number of new R2 that developed before them, with a rhythm of three weeks in X3305 and two weeks in Ariane. In X3305, no significant correlation was observed in the current week and the pattern died out after lag 5. In Ariane, leaf and R2 emergence were synchronous in the current week and each two weeks afterwards, with significant coefficients until high positive lags. The cross-correlation functions between the number of new leaves and R2 growth rate showed a rhythmic pattern only in X3305, with a three-week rhythm (Fig. 6b). Similarly, higher correlation coefficients were observed between the R2 variables and the variations in both leaf area and shoot length in X3305 than in Ariane (correlation functions shown for leaf area only, Fig. 6). In X3305, the cross-correlation function between the leaf area and the number of R2 exhibited an rhythmic pattern for both positive and negative lags. These variables were negatively correlated in the current week and were positively correlated the week after, this pattern repeating each three weeks afterwards (negative coefficients at lags 0, ±3 and -6, positive at lags ±2 and ±5). Significant coefficients were observed between the shoot length and both the number of R2 and R2 growth rate, but only for negative lags and still with a three-week rhythm (cross-correlation functions not shown). 1 2 3 4 5 6 7 8 9 10 11 12 13 14 15 16 17 18 19 20 21
1 2 3 4 5 6 7 8 9 10 11 12 13 14 15 16 17 18 19 20 21 22 23 24 DISCUSSION
The present study highlighted the existence of rhythmic patterns on the studied plants, which involved different processes and periods depending on the variety. A three-week rhythm was observed in X3305 and concerned mainly the elongation processes in the aerial part (leaf expansion and increases in shoot length, Fig. 1) while a two-week rhythm was observed in Ariane, mainly in R2 emergence and in a lesser extent in leaf emergence (Fig. 1 and 3). However, due to the low number of studied plants and to the development stage of the young plants that were just issuing
from in vitro culture and still in acclimation phase, the fluctuations in growth
observed in the present study are not equivalent to previous observations in the field (for instance Abbott, 1984 or Costes and Lauri, 1995). In particular, the number of leaves developed as well as their rhythm of emergence were very low. In Ariane, the fact that the successive leaves tended to emerge each two weeks while the total number of leaves per plant was not different between the varieties indicates that the number of new leaves which developed at once, and consequently the “signal” recorded, was particularly low. On the other hand, leaves emerged more synchronously in Ariane than in X3305. The differences in the leaf emergence rhythm between varieties are consistent with a stable leaf emergence rate for a given
variety as demonstrated previously in peach (Kervella et al., 1995). These
differences could also be due to different adaptations of the varieties to the experimental conditions. Indeed, environmental conditions such as temperature, light, water and nitrogen supply have been shown to influence growth components in
1 2 3 4 5 6 7 8 9 10 11 12 13 14 15 16 17 18 19 20 21 22 23 24 25
environmental conditions and variety behaviour could thus be further investigated since, in the present study, different environmental conditions were not compared.
The variations in leaf area and shoot length were rhythmic only in X3305, with a three-week rhythm (Fig.1). In Ariane, these processes were in opposition phase every two weeks. In both varieties, leaf and shoot elongation occurred synchronously (Fig. 3). This synchrony was symmetric and very clear in X3305 while it was only a tendency in Ariane. Increase in leaf area and shoot length occurred with a delay of one week after leaf emergence in X3305 while no clear synchronism between leaf emergence and elongation processes appeared in Ariane. This lack of synchronism in Ariane may be due to the weakness of the leaf emergence signal. The existence of dependency between leaf emergence and shoot elongation was established many years ago through defoliation experiments which suppressed further shoot elongation (Abbott, 1984). Further investigations have shown the role of hormones in this dependency, in particular auxin and gibberellins (Steffens and Hedden, 1992; Zhao et al., 2002). The present study provides information on the relative timing of the processes and suggests that both this timing and the intensity of the signal could be variety dependent.
The growth rate observed in primary roots varied from 0.2 to 1 cm per day without any significant difference between varieties. These values are similar to those found
in young citrus trees (Bevington, 1985), peach trees (Pagès et al., 1993) and oil
palms (Jourdan and Rey, 1997) but lower than those observed in rubber tree taproots (Thaler and Pagès, 1996). In many other studies, root growth rates have been
1974) or the dried and fresh weight (Kuehny and Halbrooks, 1993; Zhu et al., 2003)
which would not have allowed us to do a direct comparison of the results. The 1
2
growth rate of secondary roots was about half as low as that of primary roots. This decrease in growth rates with the successive branching orders is consistent with previous observations carried out in different species, for instance on oak tree
(Riedacker et al., 1982), peach tree (Pagès et al., 1993) or oil palm (Jourdan and Rey,
1997). 3 4 5 6 7 8 9 10 11 12 13 14 15 16 17 18 19 20 21 22 23 24 25
In addition, our results highlighted a significant difference in the growth rate of secondary roots between the two studied varieties even though a large heterogeneity between plants of the same variety was also observed. On average, secondary roots grew faster in Ariane than in X3305. Similarly, the life span of the secondary roots was different between the two varieties. In Ariane the secondary roots had a slightly lower longevity than those of X3305. In both varieties, the life span of secondary roots decreased exponentially over time and, consequently, most of the secondary roots died within the first seven days of emerging. Despite different experimental conditions, the range of life spans of the secondary roots is consistent with previous studies and with about 20% of secondary roots surviving more than 14 days, apple secondary roots appear to have a low to intermediate longevity, as previously stated for fine roots by Wells and Eissenstat (2001). For comparison, 40% and 6% of the
roots survived more than fourteen days in Prunus avium and Picea sitchensis
respectively (Black et al., 1998).
The branching density, calculated along selected primary roots which grew throughout the observation period, was also significantly different between the two
1 2 3 4 5 6 7 8 9 10 11 12 13 14 15 16 17 18 19 20 21 22 23 24 25
studied varieties. The values obtained in the present study varied from 0.8 to 0.4 secondary roots per cm on average, according to the variety, and were in the same
range of values as those for the peach tree, as mentioned by Pagès et al. (1993). The
difference in root branching density between varieties showed that the root systems of Ariane plants were half as branched than those of X3305 plants. This result combines with the difference in growth rate to show that each variety has specific rules that lead to a different hierarchy between the primary and secondary roots and thus to different root architecture. These structural differences may lead to different capabilities in terms of soil exploration and possibly in nutrient uptake since fine root physiology has been shown to depend upon root age and branching order (Wells and Eissenstat, 2003; Comas and Eissenstat, 2004). Moreover, recent studies have demonstrated that different internal hormone concentrations and transports, as well as external concentrations in ions and plant susceptibility could explain differences in
root system architecture (Bhalerao et al., 2002, Lopez-Bucio et al., 2003). Our
experimentation was designed to provide similar nutrient availability to all plants, ensuring a negligible effect of external concentrations of ions on root elongation and lateral root initiation. Thus, two main assumptions remain: that there are differences in variety susceptibility to external concentrations in ions and differences in hormone concentration or transport. However, we are not able at this stage of our investigation to focus on one particular hormone among those possibly involved, i.e. auxin, cytokinines, ABA and gibberellins (e.g. Casson and Lindsey, 2003).
In terms of the dynamics of root growth, fluctuations were observed in the number of R2 and in their growth rates, in both varieties, while R1 growth did not exhibit any evident rhythm (Fig. 3). Even though, as far as we know, no study on apple tree roots
1 2 3 4 5 6 7 8 9 10 11 12 13 14 15 16 17 18 19 20 21 22 23 24 25
has focused on the root dynamics depending on branching order, similar fluctuations in root growth rates were observed in other perennial species (Drew and Ledig, 1980; Kuehny and Halbrooks, 1993; Thaler and Pagès, 1996). The relationships between the emergence of secondary roots and the fluctuations in the growth of primary roots was indicated mainly through positive cross-correlation coefficients between the number of new R2 and the R1 mean length during the current week (Fig. 4). Such relationships between growth and branching of primary roots are consistent with
previous results obtained in the peach tree (Pagès et al., 1993).
The fluctuations in R1 length were synchronous with the emergence of leaves but with different rhythms and synchronisms between varieties (Fig. 5). The existence of synchronisms between these two processes in the current week in Ariane, or in the week before R1 elongation in X3305, suggests that leaf emergence may be involved in the timing of primary root elongation. Furthermore, R2 emergence also exhibited a rhythmic synchronism with leaf emergence but their cross-correlation coefficients were higher for positive lags than for negative lags (Fig. 6). Thus, in contrast to primary roots, secondary roots were synchronous with the leaf emergence that occurred after them or inversely new leaves were correlated to the number of new R2 developed in the previous weeks. This suggests that new secondary roots enhanced the emergence of new leaves, possibly via a feedback effect which could result from an increase in water and nutrient uptake and supply towards the aerial part.
R2 emergence also showed significant cross-correlation coefficients with the variations in leaf area (Fig. 6). This relationship was more pronounced in X3305 than in Ariane, the lack of clear synchronism in Ariane being interpreted previously as a
1 2 3 4 5 6 7 8 9 10 11 12 13 14 15 16 17 18 19 20 21 22 23 24
consequence of the weakness of the aerial signals. In X3305, an opposition phase between the variations in leaf area and both the R2 emergence and growth rate was observed in the current week. This result is consistent with a previous study carried out in the rubber tree by Thaler and Pagès (1996) and with the assumption of a possible dependence between root branching and leaf development. Indeed, the initiation of secondary roots may be enhanced by growth factors synthesised in
growing leaves such as auxin (Pagès et al., 1993) which has also been reported to be
involved in shoot-root relationships in apple trees, especially via xylem
differentiation (Soumelidou et al., 1994; Kamboj, 1997).
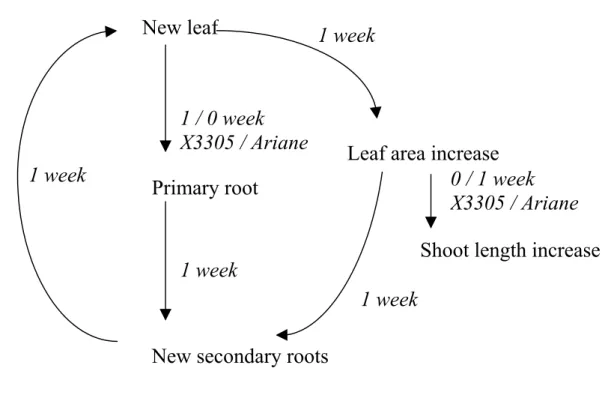
In conclusion, the synthesis of the results obtained in the present study led us to propose a conceptual model which represents the root-shoot relationship as a cyclic process including three steps (Fig. 7). Indeed, leaf emergence was followed by variations in R1 length (or synchronous with them in Ariane) which was followed by new R2 emergence, while this latter event impacted on further leaf emergence. A parallel loop concerns the fluctuations in leaf area which follow leaf emergence and may, as R1 growth, enhance R2 emergence. This integrated view of the plant is consistent with the existence of a functional equilibrium between shoots and roots at the whole plant scale which is usually interpreted as a consequence of water status
(Diaz-Perez et al., 1995), limitation in carbon acquisition (Drew, 1982) or carbon
and nitrogen partitioning (Marcelis, 1996). This equilibrium has also been assumed to develop models of partitioning (e.g. Minchin and Thorpe, 1996; Thornley, 1998). Even though the proposed scheme needs further confirmation at the adult stage, on other crops and in other environmental conditions, it supports the assumption that the
1 2 3 4 5 6 7 8 9 10 11 12 13 14 15 16 17 18 19 20 21 22 23 24 25 26 27 28 29 30 31 32 33 34 35 36 37 38 39 40
root-shoot equilibrium could involve the relative dynamics of both aerial and root parts and could have consequences on the structural organisation of the root system.
ACKNOWLEDGEMENTS : E. García-Villanueva Ph.D. was financially supported by CONACYT-México. We gratefully thank G. Garcia and S. Feral for technical assistance in field observations and H. Boukcim for his help in minirhizotrons building. We acknowledge K. Renton for improving the English.
LITERATURE CITED
Abbott, DL. 1984. The apple tree: physiology and management. Grower Books,
London.
Aguirrezabal LAN, Deléens E, Tardieu F. 1993. Carbon nutrition, root branching
and elongation: can the present state of knowledge allow a predictive approach at
a whole-plant level? Environmental and Experimental Botany 33, 121-130.
Atger C, Edelin C. 1994. Initial data on the comparative architecture of root systems
and crowns. Canadian Journal of Botany 72, 963-975.
Atkinson D. 1974. Some observations on the distribution of root activity in apple
trees. Plant and Soil 40, 333-342.
Atkinson D. 1983. The growth, activity and distribution of the fruit tree root system.
Plant and Soil 71, 23-35.
Avery DJ. 1969. Comparisons of fruiting and deblossomed maiden apple trees, and
of non-fruiting trees on a dwarfing and an invigorating rootstock. New
Phytologist 68, 323-336.
Berman ME, DeJong TM. 2003. Seasonal patterns of vegetative growth and
competition with reproductive sinks in peach (Prunus persica). Journal of
Horticultural Science and Biotechnology 78, 303-309.
Bevington KB. 1985. Annual root growth pattern of young Citrus trees in relation to
shoot growth, temperature, and water soil content. Journal of the American
Society for Horticultural Science 110, 840-845.
Bhalerao RP, Eklof JL, Ljung K, Marchant A, Bennett M, Sandberg G. 2002.
Shoot-derived auxin is essential for early lateral root emergence in Arabidopsis
seedlings. Plant Journal 29, 325-332.
Black KE, Harbron CG, Franklin M, Atkinson D, Hooker JE. 1998. Differences
in root longevity of some tree species. Tree Physiology 18, 259-264.
Brockwell PJ, Davis RA. 2002. Introduction to Time Series and Forecasting, 2nd
edition. New-York. Springer.
Casson S, Lindsey K. 2003. Genes and signalling in root development. New
Phytologist 158, 11-33.
Chatfield C. 2003. The Analysis of Time Series: An Introduction. 6th edition. Boca
Comas LH, Eissenstat DM. 2004. Linking fine roots traits to maximum potential
growth rate among 11 mature temperate tree species. Functional Ecology 18,
388-397. 1 2 3 4 5 6 7 8 9 10 11 12 13 14 15 16 17 18 19 20 21 22 23 24 25 26 27 28 29 30 31 32 33 34 35 36 37 38 39 40 41 42 43 44 45 46 47 48
Costes E, Lauri PE. 1995. Processus de croissance en relation avec la ramification
sylleptique et la floraison chez le pommier. In: J. Bouchon Ed.. Architecture des
arbres fruitiers et forestiers. Montpellier (France), INRA Editions. 74, 41-50.
Costes E, Salles JC, Garcia G. 2001. Growth and branching pattern along the main
axis of two apple cultivars grafted on two different rootstocks. Acta Horticulturae
557, 131-138.
Costes E, Fournier D, Salles JC. 2000. Changes in primary and secondary growth
as influenced by crop load effects in 'Fantasme®' apricot trees. The Journal of
Horticultural Science & Biotechnology 75, 510-519.
Daugaard H, Callesen O. 2002. The effect of rootstock on yield and quality of
'Mutsu' apples. Journal of Horticultural Science and Biotechnology 77, 248-251.
Diaz-Perez J, Shackel KA, Sutter EG. 1995. Relative water content and water
potential of tissue-cultured apple shoots under water deficits. Journal of
Experimental Botany 46, 111-118.
Diggle PJ. 1990. Time Series: A Biostatistical Introduction. Oxford: Oxford
University Press.
Diggle PJ, Heagerty P, Liang KY and Zeger SL. 2002. Analysis of Longitudinal
Data, 2nd edn. Oxford: Oxford University Press.
Drake SR. 1988. Maturity, storage quality, carbohydrate and mineral content of
'Goldspur' apples as influenced by rootstock. Journal of the American Society for
Horticultural Science 133, 949-952.
Drew AP, Ledig PM. 1980. Episodic growth and relative shoot:root balance in
loblolly pine seedlings. Annals of Botany 45, 142-148.
Drew AP. 1982. Shoot-root plasticity and episodic growth in red pine seedlings.
Annals of Botany 49:347-357.
Godin C, Guédon Y, Costes E, Caraglio Y. 1997. Measuring and analyzing plants
with the AMAPmod software. In: Michalewicz M. Ed., Advances in
computational life science. Vol. I Plants to ecosystems, Chapter 4, CSIRO,
Australia.
Greathouse DC, Laetsch, WM, Phinney BO. 1971. The shoot-growth rhythm of a
tropical tree Theobroma cacao. American Journal of Botany 58, 281-286.
Hallé F, Oldeman RAA, Tomlinson PB. 1978. Tropical trees and forests. Berlin.
Springer-Verlag.
Jourdan C, Rey H. 1997. Architecture and development of the oil-palm (Elaeis
guineensis Jacq.) root system. Plant and Soil 189, 33-48.
Kamboj JS 1997. Polar transport of [3H]-IAA in apical shoot segments of different
appe rootstocks. Journal of Horticultural Science 72, 773-7780.
Kervella J, Pagès L, Génard M. 1995. Genotypic differences in the leaf emergence
rate of young peach trees. Journal of the American Society for Horticultural
Science 120, 278-282.
Kuehny JS, Halbrooks MC. 1993. Episodic whole plant growth patterns in
Ligustrum. Physiologia Plantarum 89, 33-39.
Larsen FE, Higgins SS, Dolph CA. 1992. Rootstock influence over 25 years on
yield, yield efficiency and tree growth of cultivars 'Delicious' and 'Golden
Lopez-Bucio J, Cruz-Ramirez A, Herrera-Estrella L. 2003. The role of nutrient
availability in regulating root architecture. Current Opinion in Plant Biology 6,
280-287. 1 2 3 4 5 6 7 8 9 10 11 12 13 14 15 16 17 18 19 20 21 22 23 24 25 26 27 28 29 30 31 32 33 34 35 36 37 38 39 40 41 42 43 44 45 46 47 48 49
Lynch J. 1995. Root architecture and plant productivity. Plant Physiology 109, 7-13.
Lyndon RF. 1998. The shoot apical meristem. Its growth and development.
Cambridge University Press. Cambridge.
Marcelis LFM. 1996. Sink strength as a determinant of dry matter partitioning in the
whole plant. Journal of Experimental Botany 47, 1281-1291.
Médiène S, Pagès L, Jordan, MO, le Bot J, Adamowicz S. 2002. Influence of
nitrogen availability on shoot development in young peach trees Prunus persica
(L.) Batsch. Trees: Structure and Function 16, 547-554.
Minchin PEH, Thorpe MR. 1996. What determines carbon partitioning between
competing sinks. Journal of Experimental Botany 47, 1293-1296.
Murashige TA. 1962. A revised medium for rapid growth and bioassays with
tobacco tissue cultures. Physiologia Plantarum 15, 473-497.
Neufeld HS, Durall DM, Rich PM, Tingey DT. 1989. A rootbox for quantitative
observations on intact entire root systems. Plant and Soil 117, 295-298.
Pagès L, Kervella J, Chadoeuf J. 1993. Development of the root system of young
peach trees (Prunus persica L. Batsch): a morphological analysis. Annals of
Botany 71, 369-375.
Psarras G, Merwin IA. 2000. Water stress affects rhizosphere respiration rates and
root morphology of young 'Mutsu' apple trees on M.9 and MM.111 rootstocks.
Journal of the American Society for Horticultural Science 125, 588-595.
Riedacker A, Dexheimer J, Takavol R, Alaoui H. 1982. Modifications
expérimentales de la morphogenèse et des tropismes dans le système racinaire de
jeunes chênes. Canadian Journal of Botany 60, 765-778.
Roche L, Masseron A, Mathieu V, Mazollier J, Lemarquand A, Laurens F, Pitiot C, Lavoisier C, Coureau C, Pouzoulet D, Mery D, Perrin F, Westercamp P, Saint-Hilary JF, Tronel C, Montagnon JM. 2003 Preliminary
results of a national systematic experiment. Some new apples for tomorrow !
Arboriculture Fruitière 572, 9-11.
Schechter I, Elfving DC, Proctor JTA. 1991. Apple tree canopy development and
photosynthesis as affected by rootstock. Canadian Journal of Botany 69,
295-300.
Seleznyova AN, Thorp TG, White M, Tustin S, Costes E. 2003. Application of
architectural analysis and AMAPmod methodology to study dwarfing phenomenon: the branch structure of 'Royal Gala' apple grafted on dwarfing and
non-dwarfing rootstock/interstock combinations. Annals of Botany 91, 665-672.
Soumelidou K, Morris DA, Battey NH, Barnett JR, John P. 1994. Auxin
transport capacity in relation to the dwarfing effect of apple rootstocks. Journal
of Horticultural Science 69, 719-725.
Steffens G, Hedden P. 1992. Comparison of growth and gibberellin concentrations
in shoots from orchard-grown standard and thermosensitive dwarf apple trees.
Physiologia Plantarum 86, 554-550.
Thaler P, Pagès L. 1996. Periodicity in the development of the root system of young
rubber trees (Hevea brasiliensis Muell. Arg.): relationship with shoot
development. Plant, Cell and Environment 19, 56-64.
Thornley JHM. 1998. Modelling shoot:root relations: the only way forward? Annals
Williamson JG, Coston DC. 1989. The relationship among root growth, shoot
growth and fruit growth of peach. Journal of the American Society for
Horticultural Science 114, 180-183. 1 2 3 4 5 6 7 8 9 10 11 12 13 14 15 16
Wells CE, Eissenstat DM. 2001. Marked differences in survivorship among apple
roots of different diameters. Ecology 82, 882-892.
Wells CE, Eissenstat DM. 2003. Beyond the roots of young seedlings: the influence
of age and order on fine root physiology. Journal of Plant Growth Regulation 21,
324-334.
Zhu L, Welander M, Hellgren O. 1999. Growth rates and biomass production of
micropropagated apple trees of M26 and Gravenstein on their own roots and in different micrografted combinations under non limiting nutrient conditions.
Journal of Experimental Botany 50, 1189-1198.
Zhao H, Hertel R, Ishikawa H, Evans ML. 2002. Species differences in ligand
specificity of auxin-controlled elongation and auxin transport: comparing Zea
1 2 3 4 5 6 7 8 9 10 11 12 13 14 15 16 17 18 19 20 21 22 23 24 25 26 27 28 29 30
TABLE 1: Total number of leaves, leaf area (LA), shoot length, basal diameter and number of primary roots per plant, of young ‘X3305’ and ‘Ariane’ apple plants
sixteen weeks after transfer from in vitro culture. Standard deviation are indicated in
italics between brackets. Significant differences between varieties were tested by a Kruskal-Wallis non-parametric ANOVA (ns: non-significant; * : significant with p < 0.05; ** : significant with p < 0.01).
Variety Nb of leaves Leaf area
(mm²) Shoot length (mm) Basal diameter (mm) Nb of R1 X3305 16 (4.85) 122.82 (86.42) 56.70 (41.90) 3.10 (0.41) 19.2 (12.95) Ariane 19 (5.61) 122.36 (102.99) 49.16 (47.93) 2.84 (0.47) 18.6 (9.02) Varietal effect ns ns ns ns ns
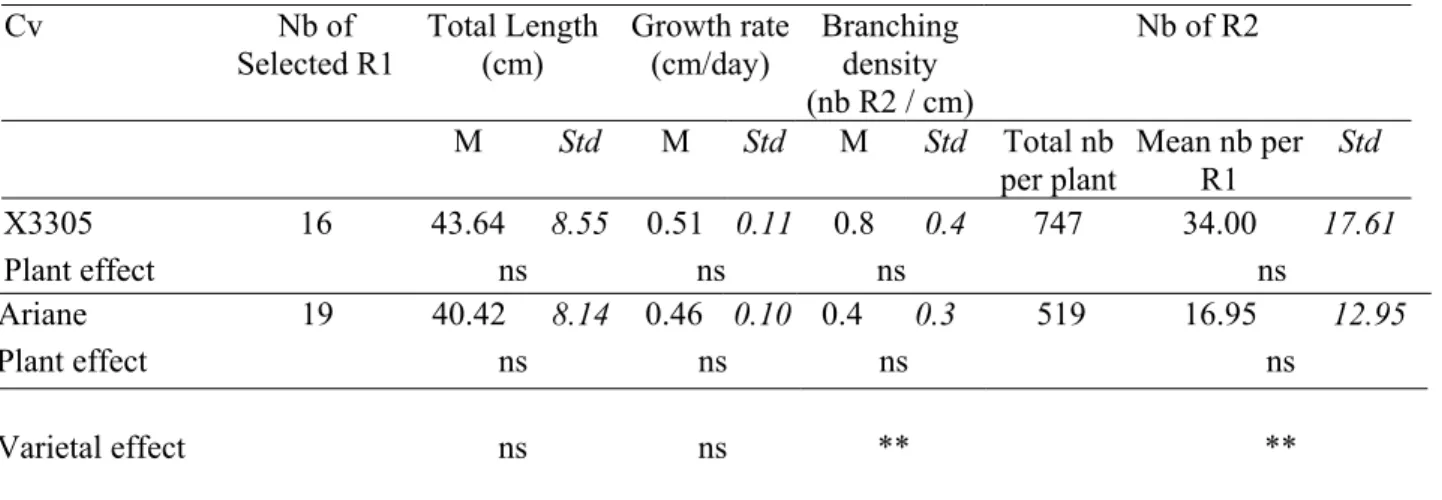
TABLE 2: Mean length, growth rate, branching density, and number of secondary roots of a selection of primary roots (R1), which grew all over the observation period
(sixteen weeks after transfer from in vitro culture), on young ‘X3305’ and ‘Ariane’
apple plants. Standard deviations are indicated in italics. Significant differences between plants and varieties were tested by a Kruskal-Wallis non-parametric ANOVA (ns: non-significant; *: significant with p < 0.05; **: significant with p < 0.01). Cv Nb of Selected R1 Total Length (cm) Growth rate (cm/day) Branching density (nb R2 / cm) Nb of R2 M Std M Std M Std Total nb per plant Mean nb per R1 Std X3305 16 43.64 8.55 0.51 0.11 0.8 0.4 747 34.00 17.61 Plant effect ns ns ns ns Ariane 19 40.42 8.14 0.46 0.10 0.4 0.3 519 16.95 12.95 Plant effect ns ns ns ns Varietal effect ns ns ** **
TABLE 3: Total number of secondary (R2) and tertiary roots (R3) per plant. Mean and standard deviation of the total length (mm), median and centiles (25% and 75%) of the life span (days) are indicated for all R2 roots. The mean growth rate (mm/day) was calculated for R2 roots with more than one segment (Standard deviations in italics). Significant difference between plants and varieties were tested by a Kruskal-Wallis non-parametric ANOVA for the life span and by a hierarchic ANOVA with plant effect within the variety effect, for both length and growth rate (ns: non-significant, * : significant with p < 0.05; ** : significant with p < 0.01).
1 2 3 4 5 6 7 8 9 10 11 12 13 14 15 16 17 18 19 20 21 22 23 24 25 26 27 28 29 30 31 32 33 34 35 36 Cv Total Nb of R2 Total Length (cm) Life span (days) Nb of R2 with more than 1 segment Growth rate (cm/day) Total nb of R3 M Std MedCent. M Std X3305 747 2.01 1.63 3 0-10 410 0.24 0.13 24 Ariane 519 2.34 2.76 0 0-8 242 0.30 0.16 20 Variety * ** Hierarchic ANOVA Plant(Variety) ** ** Kruskal-Wallis ANOVA Plant effect (X3305) Plant effect (Ariane) Varietal effect
** ** *
1 2 3 4 5 6 7 8 9 10 11 12 13 14 15 16 17 18 19 20 21 22 23 24 25 26 27 28 29 30 31 32 33 34 35 36 37 38 39 40 41 42 43 44 45 46 FIGURE CAPTIONS
FIG. 1.Sample autocorrelation functions of the variables characterising the aerial growth: number of new leaves (nb N), variations in leaf area d(LA), and shoot length d(L) calculated per plant, for two apple varieties, X3305 (a) and Ariane (b). Each unit on the x-axis corresponds to one lag of seven days. Autocorrelation function induced by the selected filter on the reference model, i.e. deterministic trend + white noise ( ) and randomness 95% confidence limits (---) are indicated with dashed lines.
FIG. 2. Cross-correlation functions between variables of aerial growth calculated per plant and for two apple varieties: between leaf area d(LA) and shoot length d(L) for X3305 (a) and Ariane (c); between leaf area d(LA) or shoot length d(L) and the number of new leaves (nb N), for X3305 (b) and Ariane (d). Each unit on the x-axis corresponds to one lag of seven days. Randomness 95% confidence limits (---) are indicated with dashed lines.
FIG.3. Sample autocorrelation functions of the variables characterising secondary roots, for two apple varieties X3305 (a) and Ariane (b): Number of new secondary roots (nbR2), their growth rate (GR R2) and mean total length (long R2). Each unit on the x-axis corresponds to one lag of seven days. Autocorrelation function induced by the selected filter on the reference model, i.e. deterministic trend + white noise ( ) and randomness 95% confidence limits (---) are indicated with dashed lines. FIG. 4. Cross-correlation functions between root variables: between the number of new secondary roots (nb R2), their growth rate (GR R2) and mean total length (long R2), calculated on selected primary roots for two apple varieties X3305 (a) and Ariane (c); between the number of new secondary roots (nb R2) and the growth rate of primary roots (GR R1) and their mean total length (long R1), for X3305 (b) and Ariane (d). Each unit on the x-axis corresponds to one lag of seven days. Randomness 95% confidence limits (---) are indicated with dashed lines.
FIG. 5. Cross-correlation functions between the number of new leaves (nbN) and the mean total length of primary roots (long R1) for two apple varieties X3305 (a) and Ariane (c); between the number of new leaves (nbN) and the growth rate of primary roots (GR R1) for X3305 (b) and Ariane (d). Each unit on the x-axis corresponds to one lag of seven days. Randomness 95% confidence limits (---) are indicated with dashed lines.
FIG. 6. Cross-correlation functions between variables characterising the aerial systems and secondary roots: between the number of new leaves (nbN), leaf area d(LA), and number of new secondary roots (nb R2), for two apple varieties X3305 (a) and Ariane (c); between the same variables of aerial systems and the growth rate of secondary roots (GR R2), for X3305 (b) and Ariane (d). Each unit on the x-axis corresponds to one lag of seven days. Randomness 95% confidence limits (---) are indicated with dashed lines.
1 2 3 4 5
FIG. 7. Schematic representation of cyclic succession of events between aerial and root systems with the corresponding time delays which were highlighted in time-series analysis (in italics).
1 2 3 5 7 9 11 13 15 17 19 21 23 25 27 29 31 33 35 37 39 41 43 45 47 49 51 53 55 57 59 61 62 63 64 65 66 67 68 69 70 71 72 73 74 75 76 (a) X3305 -1,0 -0,8 -0,6 -0,4 -0,2 0,0 0,2 0,4 0,6 0,8 1,0 0 1 2 3 4 5 6 7 8 9 10 lag correlation coefficient nb N d(LA) d(L) white noise Ariane -1,0 -0,8 -0,6 -0,4 -0,2 0,0 0,2 0,4 0,6 0,8 1,0 0 1 2 3 4 5 6 7 8 9 10 lag correlation coefficient nb N d(LA) d(L) white noise (b)
FIG. 1. Sample autocorrelation functions of the variables characterising the aerial growth: number of new leaves (nb N), variations in leaf area d(LA), and shoot length d(L) calculated per plant, for two apple varieties, X3305 (a) and Ariane (b). Each unit on the x-axis corresponds to one lag of seven days. Autocorrelation function induced by the selected filter on the reference model, i.e. deterministic trend + white noise ( ) and randomness 95% confidence limits (---) are indicated with dashed lines.
(a ) X3 30 5 -1 -0 ,5 0 0, 5 1 -1 0 -9 -8- 7- 6-5 -4- 3- 2-1 0 1 2 3 4 5 6 7 8 9 10 la g correlation coef ficient d( LA ) d( L) X3 30 5 -1 -0 ,5 0 0, 5 1 -1 0 -9 -8 -7- 6- 5- 4-3 -2 -1 0 1 2 3 4 5 6 7 8 9 10 la g nb N - d( LA ) nb N d( L) correlation coef ficient (b ) Ar ia ne -1 -0 ,5 0 0, 5 1 -1 0 -9 -8 -7-6 -5- 4-3 -2 -1 0 1 2 3 4 5 6 7 8 9 10 la g correlation coef ficient d( LA ) d( L) (c ) Ar ia ne -1 -0 ,8 -0 ,6 -0 ,4 -0 ,2 0 0, 2 0, 4 0, 6 0, 8 1 -1 0-9 -8 -7-6 -5 -4 -3 -2 -1 0 1 2 3 4 5 6 7 8 9 10 la g correlation coef ficient nb N - d( LA ) nb N - d( L) (d )
FIG. 2. Cross-correlation functions between variables of aerial gr
owth calculated per plant and for two apple varieties: betwee
n leaf area d(LA)
and shoot length d(L) for X3305 (a) and Ariane (c); between leaf
area d(LA) or shoot length d(L)
and the num
ber of new leaves (
nb N), for
X3305 (b) and Ariane (d). Each unit on the x-axis corresponds
to one lag of seven days. Random
ness 95% confidence lim
its (---)
are indicated
with dashed lines.
1 3 5 7 9 11 13 15 17 19 21 23 25 27 29 31 33 35 37 39 41 43 45 47 49 51 53 55 57 59 61 63 64 65 66 67 68 69 70 (a) X3305 -1,0 -0,8 -0,6 -0,4 -0,2 0,0 0,2 0,4 0,6 0,8 1,0 0 1 2 3 4 5 6 7 8 9 1 nbR2 GR R2 long R2 white noise lag correlation coefficient 0 (b) Ariane -1,0 -0,8 -0,6 -0,4 -0,2 0,0 0,2 0,4 0,6 0,8 1,0 0 1 2 3 4 5 6 7 8 9 1 nbR2 GR R2 long R2 white noise lag correlation coefficient 0
FIG.3. Sample autocorrelation functions of the variables characterising secondary roots, for two apple varieties X3305 (a) and Ariane (b): Number of new secondary roots (nbR2), their growth rate (GR R2) and mean total length (long R2). Each unit on the x-axis corresponds to one lag of seven days. Autocorrelation function induced by the selected filter on the reference model, i.e. deterministic trend + white noise ( ) and randomness 95% confidence limits (---) are indicated with dashed lines.
X3 30 5 -1 -0 ,5 0 0, 5 1 -1 0 -9 -8- 7- 6-5 -4- 3- 2-1 0 1 2 3 4 5 6 7 8 9 10 la g correlation coef ficient d( LA ) d( L) (a ) X3 30 5 -1 -0 ,5 0 0, 5 1 -1 0 -9-8 -7- 6- 5- 4-3 -2 -1 0 1 2 3 4 5 6 7 8 9 10 la g nb N d( LA ) nb N d( L) correlation coef ficient (b ) Ar ia ne -1 -0 ,5 0 0, 5 1 -1 0 -9 -8 -7-6 -5- 4-3 -2 -1 0 1 2 3 4 5 6 7 8 9 10 la g correlation coef ficient d( LA ) d( L) (c ) Ar ia ne -1 -0 ,8 -0 ,6 -0 ,4 -0 ,2 0 0, 2 0, 4 0, 6 0, 8 1 -1 0-9 -8 -7-6 -5 -4 -3 -2 -1 0 1 2 3 4 5 6 7 8 9 10 la g correlation coef ficient nb N d( LA ) nb N d( L) (d)
FIG. 4. Cross-correlation functions between r
oot variables: between the num
ber of new secondary roots (nb R2), their growth rat
e (GR R2) and
m
ean total length (long R2), calculated on selected prim
ary roots
for two apple varieties X3305 (a) and Ariane (c); between the
num
ber of new
secondary roots (nb R2) and the growth rate of prim
ary root
s (GR R1) and their m
ean total
length (long R1), for X3305 (b) and
Ariane (d). Each
unit on the x-axis corresponds to one lag of seven days. Random
ness 95% confidence lim
its (---) are indicated with dashed lines
.
X3 30 5 -1 -0 ,5 0 0, 5 1 -1 0 -9 -8- 7- 6-5 -4- 3- 2-1 0 1 2 3 4 5 6 7 8 9 10 la g correlation coef ficient d( LA ) d( L) (a ) X3 30 5 -1 -0 ,5 0 0, 5 1 -1 0 -9-8 -7- 6- 5- 4-3 -2 -1 0 1 2 3 4 5 6 7 8 9 10 la g nb N d( LA ) nb N d( L) correlation coef ficient (b ) Ar ia ne -1 -0 ,5 0 0, 5 1 -1 0 -9 -8 -7-6 -5- 4-3 -2 -1 0 1 2 3 4 5 6 7 8 9 10 la g correlation coef ficient d( LA ) d( L) (c ) Ar ia ne -1 -0 ,8 -0 ,6 -0 ,4 -0 ,2 0 0, 2 0, 4 0, 6 0, 8 1 -1 0-9 -8 -7-6 -5 -4 -3 -2 -1 0 1 2 3 4 5 6 7 8 9 10 la g correlation coef ficient nb N d( LA ) nb N d( L) (d)
FIG. 5. Cross-correlation functions between
the num
ber of new leaves (nbN) and the m
ean total length of prim
ary roots (long R1)
for two apple
varieties X3305 (a) and Ariane (c); between the num
ber of new leav
es (nbN) and the growth rate of prim
ary roots (GR R1) for X33
05 (b) and
Ariane (d). Each unit on the x-axis corre
sponds to one lag of seven days. Random
ness 95% confidence lim
its (---) are indicated
with dashed
lines.
X 3305 -1 -0 ,8 -0 ,6 -0 ,4 -0 ,2 0 0, 2 0, 4 0, 6 0, 8 1 -1 0 -9 -8 -7 -6 -5 -4 -3 -2 -1 012 34567 89 10 nb N - G R R2 d( LA ) - G R R 2 la g correl ation c oeffici ent (b ) Ar ia n e -1 -0 ,8 -0 ,6 -0 ,4 -0 ,2 0 0, 2 0, 4 0, 6 0, 8 1 -1 0 -9- 8-7 -6- 5- 4- 3- 2-1 0 1 2 3 4 5 6 7 8 9 10 nb N - G R R2 d( LA ) - G R R 2 la g correl ation c oeffici ent (d ) X 3305 -1 -0 ,8 -0 ,6 -0 ,4 -0 ,2 0 0, 2 0, 4 0, 6 0, 8 1 -1 0 -9 -8 -7 -6 -5 -4 -3 -2 -10 12 34 56 78 9 10 nb N - n b R2 d( LA ) - nb R 2 la g correl ation c oeffici ent (a ) Ar ia n e -1 -0 ,8 -0 ,6 -0 ,4 -0 ,2 0 0, 2 0, 4 0, 6 0, 8 1 -1 0 -9-8 -7- 6- 5-4 -3- 2-1 0 1 2 3 4 5 6 7 8 91 0 n b N Nb R2 d( LA ) N b R 2 la g correl ation c oeffici ent (c )
FIG. 6. Cross-correlation functions between variables characteris
ing the aerial system
s and secondary roots: between the num
ber
of new leaves
(nbN), leaf area d(LA), and num
ber of new secondary roots (nb R2
), for two apple varieties X3305
(a) and Ariane (c); between th
e sam
e
variables of aerial system
s and the growth rate of secondary r
oots (GR R2), for X3305 (b) and Ariane (d). Each unit on the x-a
xis corresponds to
one lag of seven days. Random
ness 95% confidence lim
its (---) are indicated with dashed lines.
1 2 3 4 5 6 7 8 9 10 11 12 13 14 15 16 17 18 19 20 21 22 23 24 25 26 27 28 29 30 31 32 33 34 35
New leaf
Leaf area increase
Shoot length increase
0 / 1 week
X3305 / Ariane
1 week
1 week
1 / 0 week
X3305 / Ariane
Primary root
1 week
1 week
New secondary roots
FIG. 7. Schematic representation of cyclic succession of events between aerial and root systems with the corresponding time delays which were highlighted in time-series analysis (in italics).